3 Separation and Detection of Amino Acids
Synopsis: Amino acid analysis usually involves two distinct processes. First is the separation of the individual amino acids from each other and from other contaminants; then the detection of the separated components.
Separation is based on the different properties of the side chains, such as polarity or charge. Separation is generally achieved by some form of chromatography, such as ion exchange, metal affinity, and gel filtration chromatography.
Detection is based on chemical reactions that generate coloured or fluorescent amino acid derivatives that can be seen and measured.
Amino acid analysis
Amino acid analysis is a necessary aspect of experiments to determine protein structure
Analysis involves two processes:

- The mixture must be separated into individual components (Figure 3.1)
- The components of interest must be detected
-
- Detection can be qualitative and determine what is present
- Detection can be quantitative and measure how much is present.
Chromatography separates components of a mixture
Particles of solid are chosen with a given property.
For example, silica gel contains HO-Si-OH groups that are effective in forming hydrogen bonds with polar amino acids. This makes up the stationary phase.
Liquid solvent or buffer flows past the particles and is nonpolar. This makes up the mobile phase.
Amino acids rapidly exchange between phases.
Polar amino acids (P) spend more of their time hydrogen bonded to the stationary silica – they move more slowly. Nonpolar amino acids (N) spend more time in the moving solvent. They move almost as fast as solvent (Figure 3.2).
Thin layer chromatography
LABORATORY-RELATED CONTENT
 The information discussed in this section is related to Lab 1.
The silica gel is spread as a thin layer on a plastic or glass sheet.
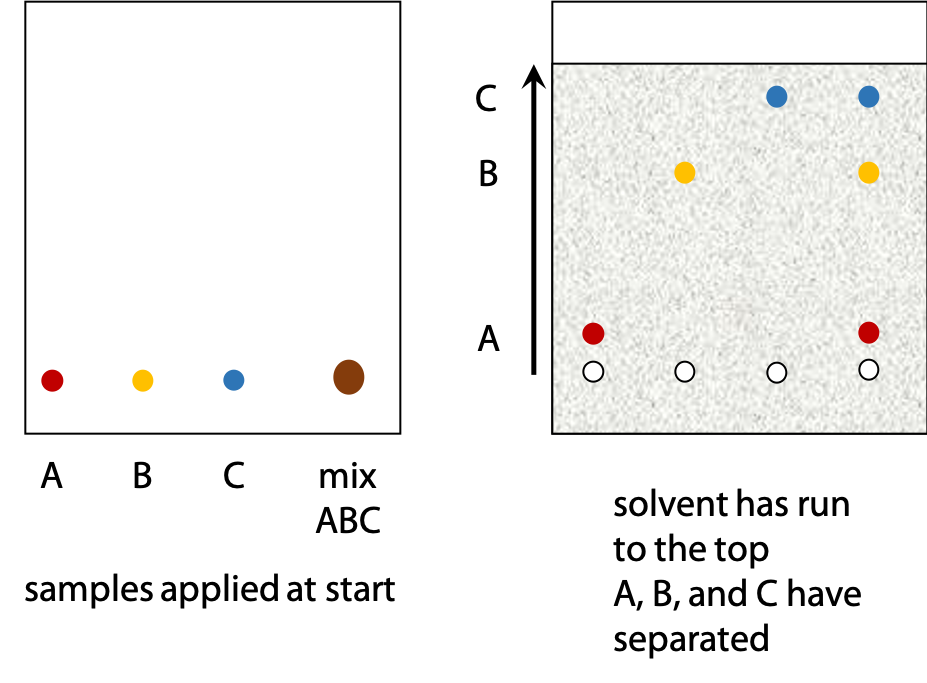
Samples are applied to the silica gel in a small drop of solvent. Each sample forms a spot and different sample spots are arranged in a row near the bottom edge of the sheet (Figure 3.3).
The lower edge of the sheet is dipped in solvent. As solvent soaks up the sheet, the sample spots shift as the solvent moves past.
Different substances move at different rates, so the components of an initial mixture are separated. Pure samples of substances suspected to be in the mixture are also applied. Spots in the mixture can be identified if they move the same distance as one of the pure samples.
Polarity is the basis for separation of substances by thin layer chromatography.

The rate at which a given sample, e.g. an amino acid, moves up the sheet depends on its relative preference for stationary phase (silica gel) or mobile phase (nonpolar solvent). A very polar amino acid such as aspartate will spend most of its time stuck to the silica gel and will barely move. A very non-polar amino acid such as leucine will spend most of its time in the solvent. It will move up the sheet almost as fast as the solvent. Amino acids with intermediate polarity will be in equilibrium between the two phases and will move part way up the sheet.
Relative mobility, RF
The highest point that the solvent reaches is called the solvent front. The ratio of distance moved by a sample and by the solvent front is called relative mobility, RF (Figure 3.4).
Very polar solutes will have RF close to zero, while very non polar solutes will have RF close to 1.0. Most substances will be spread out in between these two extremes.
The value of RF will depend on the solvent used and solvent must be carefully chosen for a given mixture of compounds.
Other formats for chromatography
Column chromatography – Protein biochemistry work-horse
A granular solid such as silica gel is packed into a glass tube or column. Silica is usually held in place by a porous disk at the bottom. A sample mixture is applied at the top, then the solvent or buffer solution is allowed to flow through. Sample solutes travel with the flow of buffer solution to the bottom of the column (Figure 3.5). Substances that bind more strongly to the solid phase require more buffer to pass through or be eluted from the column. The main advantage is that the separated components of the mixture can be collected allowing additional experiments to be performed on the individual components.

Collection tubes are changed after a fixed volume of buffer or solvent has passed through, whether sample has come through or not. When enough tubes have been collected, their contents are detected and the quantity of sample in each tube is graphed as a function of volume buffer that has passed since the start. The volume of buffer needed to move a given sample through the column is called its elution volume.
High performance liquid chromatography (HPLC)
Column chromatography using specially designed columns and with solvent pumped through for greater efficiency. This is the usual method in research labs.
Detection of separated amino acids
All 20 amino acids are colourless substances, while quantities in an analysis may be anything from 10-6 to 10-10 moles.
The separated amino acids must be detected by special means, which involve reaction with a colour or fluorescence-generating reagent.
Ninhydrin: reacts with -amino N to a give purple colour (10-8 mol detectable).
Fluorescamine: reacts with -amino N to give yellow fluorescence (10-10 mol detectable). When illuminated with UV lamp, the sample emits a yellow glow.
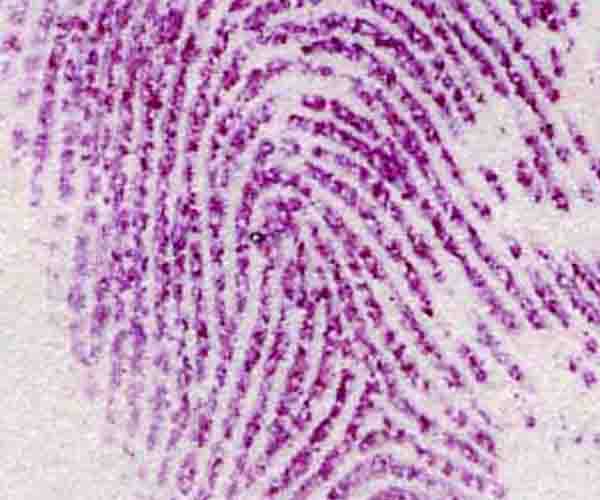
Since fingerprint sweat contains significant traces of amino acids, ninhydrin and fluorescamine are both used by police investigators to detect otherwise invisible fingerprints (Figure 3.6).
The reagents are either sprayed onto the TLC plates, or added to the solvent as it emerges from the column. The intensity of colour or fluorescence is recorded and plotted as a graph. Colour intensity is proportional to the number of moles of each amino acid.
An alternative method often used in conjunction with HPLC is to prelabel the sample compound with a coloured or fluorescent dye before separation and record the colour intensity as each amino acid emerges from the column. This method is often preferred for quantitative analysis, since the dye reaction can be allowed to go to completion ahead of time (see Lecture 5).
Dyes used for prelabelling include fluorodinitrobenzene, dansyl chloride, dabsyl chloride, phenylisothiocyanate.
Ninhydrin and fluorescamine can’t be used to label amino acids before separation, since the colour-forming reaction destroys the amino acid.
Different mechanisms of chromatography
Reversed phase chromatography:
Instead of polar silica gel, a non-polar hydrocarbon silicon derivative is used as the solid stationary phase; instead of non-polar solvent, polar solvent is used as mobile phase. The order of passage is reversed, since now polar solutes don’t bind and have high RF, while non-polar solutes do bind and have low RF. (Used because it’s better at distinguishing subtle differences in hydrocarbon side chains of amino acids.)
Ion exchange chromatography
LABORATORY-RELATED CONTENT
The information discussed in this section is related to Lab 1.
The silica gel stationary phase is replaced by ionic resins:
Cation exchange resins are based on polymers with negative carboxylate groups, which will bind positive ions or cations.
Anion exchange resins are made from polymers with positive amino groups, which will bind negative ions or anions.
Solutes will now bind according to their charge rather than polarity, e.g. positive amino acids NH3+-CHR-CO2H bind to negative charged resin.
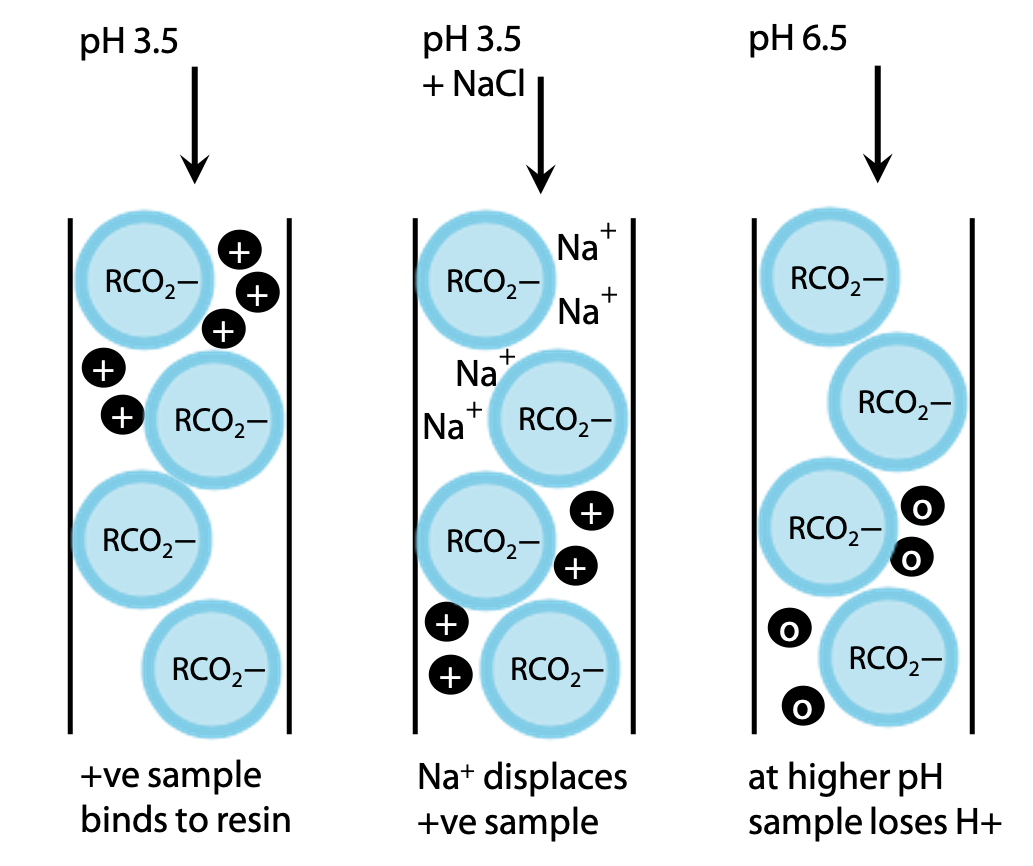
All amino acids can be made positive to some degree by lowering the pH, e.g to pH 3.5 (Figure 3.7). The exact charge on a given amino acid will depend on its exact pKa value. There are enough differences that all 20 amino acids are easily distinguished.
The amino acids can be eluted by adding NaCl to the buffer, so that Na+ binds in exchange for the +ve amino acid NH3+-CHR-CO2H. More weakly bound amino acids are displaced by a low NaCl concentration, while tightly bound amino acids require a higher concentration of NaCl to be eluted.
Alternatively, pH may be increased. As pH rises, amino acids become deprotonated giving a net neutral charge, NH3+-CHR-CO2– and their binding to the negative resin is weakened.
Amino acids are detected and concentration measured as they come out of the column.

The volume of buffer needed to move a given amino acid from top to bottom of the column is also measured: this is the elution volume for that amino acid. Elution volumes may be normalized by comparing with elution volumes of a common standard such as Ala or Leu.
Elution volumes are characteristic for a given amino acid and this allows amino acids to be identified (Figure 3.8).
Separation of proteins from complex mixtures
Protein samples can be extremely complex, since proteins are generally extracted from cellular sources. Bacteria such as Escherichia coli or yeasts such as Saccharomyces cerevisiae are often grown as sources of proteins and enzymes. Other sources include extracts of tissues such as animal liver. These extracts may contain about 1000 to 3000 different proteins. There are three problems must be addressed.
- A typical single protein may represent only 0.03 to 0.1% by mass of the protein mixture. This can be increased by inducing over-expression of a gene inserted into yeast or bacteria.
- There may be several other proteins present in the extract with similar properties to the one you are trying to isolate.
- Proteins are easily damaged under harsh conditions such as extreme pH, non-aqueous solvents and temperature. Therefore, separation techniques must be carried out at 0 – 4oC and near neutral pH to minimize loss of sample.
Complete protein purification involves successive application of several chromatographic or other separation techniques. Since there may be other proteins with similar charge, separations based on other properties such as size are also applied.
Proteins are readily separated by ion exchange chromatography – separation based on charge of protein.
Anion exchangers are positive charged polymers that bind and retain negative charged solutes (anions) including proteins.
Cation exchangers are negative charged polymers that bind positive charged solutes (cations) including proteins.
Since a protein is a long chain of many different amino acids, each protein species has a unique electric charge which is the algebraic sum of the number of negative and positive amino acid side chains. For histidine, the contribution may be a fractional positive charge, since histidine is only partly protonated (approximately +0.24) at neutral pH. The N-terminal (pKa = 8) and C-terminal (pKa = 3) may also contribute charge.
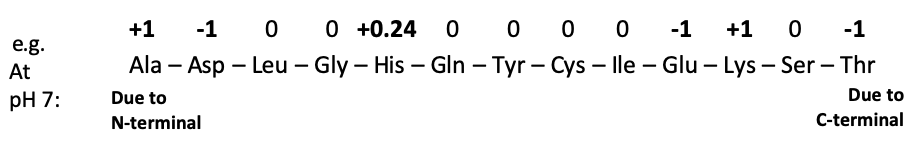
Net charge = + 1 – 1 + 0.24 – 1 + 1 – 1 = –0.76
By changing the pH used in an ion exchange column, it’s also possible to change the net charge on a given peptide chain. However, many proteins may not tolerate much pH change.
Proteins with the appropriate charge will bind to ion exchanger. They are released from the resin by gradually increasing the concentration of neutral salt such as NaCl or KCl, a technique known as gradient elution (Figure 3.9). The upper part of the graph on the right shows a gradually increasing NaCl concentration in the buffer.
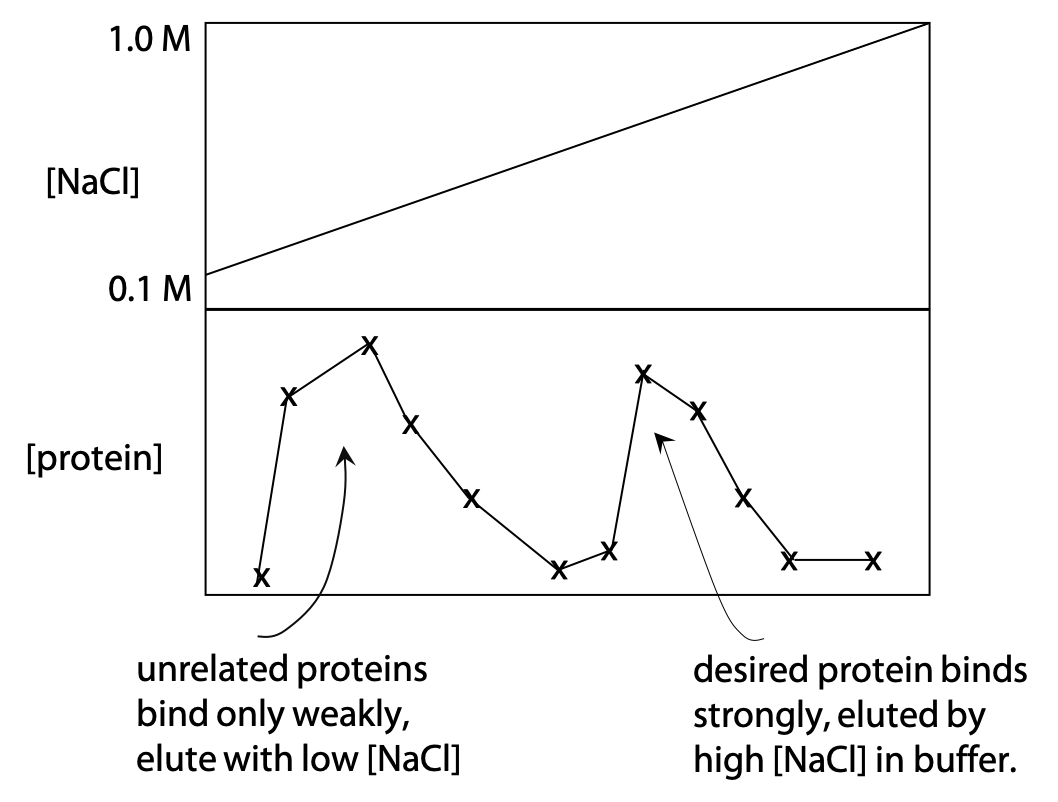
The lower part shows the protein concentration measured in the buffer as it comes out of the column. Proteins that lack charge or have the same charge as the resin will not bind and are eluted quickly. Proteins that have the opposite charge to the resin bind until the NaCl concentration has risen enough to release them. Proteins that have a higher charge will bind more tightly, which means a higher NaCl concentration is needed to release or elute them. Resin and pH are chosen, so that the desired protein binds moderately tightly.
Metal affinity chromatography
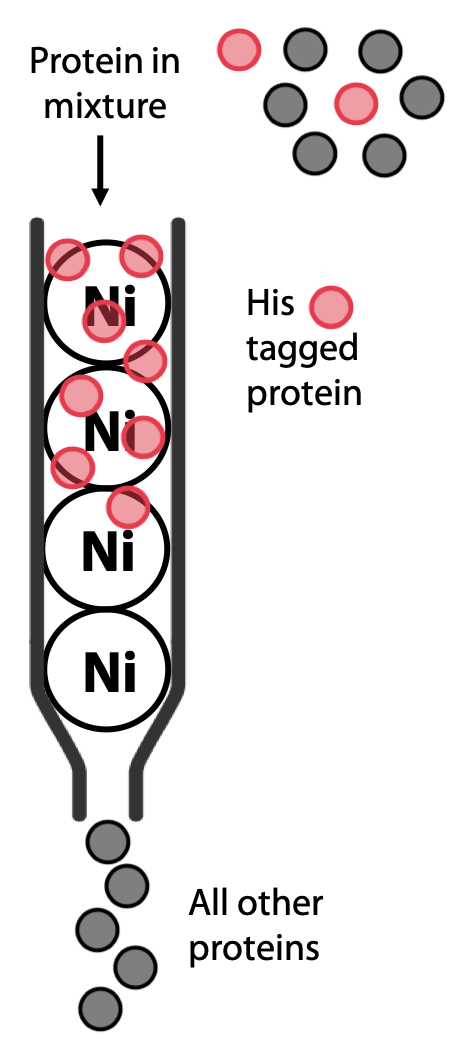
This is a widely used modern technique, because it can yield almost pure proteins in a single efficient step. It relies on the fact that clusters of histidine in a protein have high affinity for binding transition metals such as Ni2+ or Co2+. A column is prepared with resin containing Ni bound to a chelating agent.
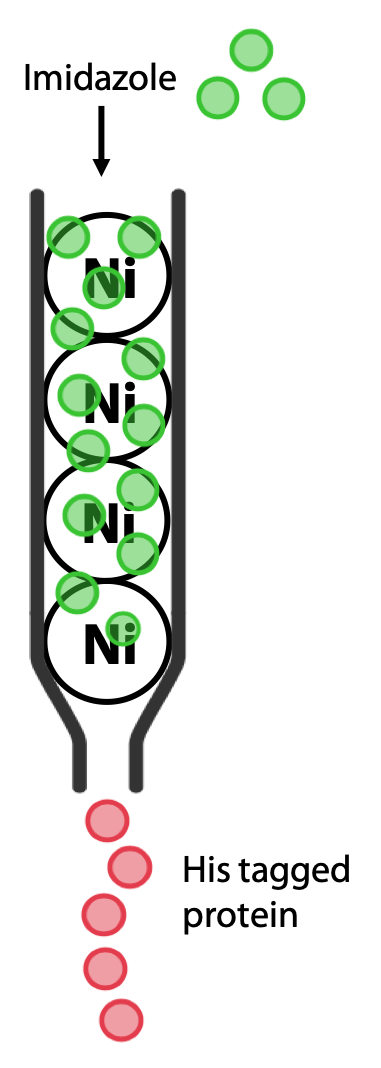
Most natural proteins do not contain histidine clusters, so it will not bind to the column. However, if the protein of interest is being artificially expressed in yeast or bacteria, its gene can be modified to add a cluster of 6-8 histidines, known as a His-tag, either at the N- or the C- terminus of the polypeptide, where they are less likely to interfere with the protein’s natural function.
Natural protein: Met-Pro-Ser-Leu-Ser-Tyr-etc
His-tagged protein: -His-His-His-His-His-His-Pro-Ser-Leu-Ser-Tyr-etc
The protein of interest is now the only one that should bind to the column (Figure 3.10). The protein is then eluted by adding buffer containing imidazole, a molecule that resembles the histidine side chain. Imidazole will occupy the Ni2+ sites on the resin, allowing the His-tagged protein to pass out of the column and be collected (Figure 3.11).
Gel filtration chromatography
LABORATORY-RELATED CONTENT
The information discussed in this section is related to Lab 2.
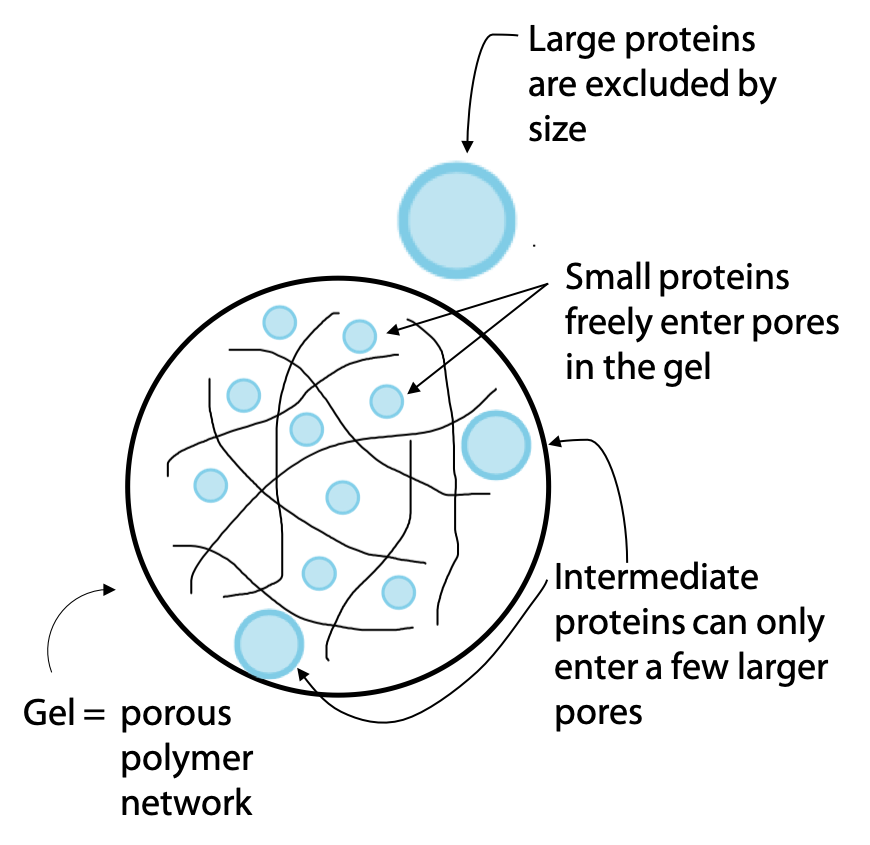
Another widely used chromatography technique is called gel filtration or molecular exclusion chromatography. Separation is on the basis of molecular size, with the largest molecules emerging first (the term gel filtration is a bit misleading, due to the fact that it seems to imply smaller molecules might pass through more easily). The stationary phase of the column consists of a hydrated gel, formed from a polymer, which absorbs water to form an aqueous network of open pores (Figure 3.12).
The gel is in the form of beads or granules. Molecules in the sample that are small enough can fit into the pores of the gel. Since the gel is the stationary phase, these molecules progress through the column more slowly.
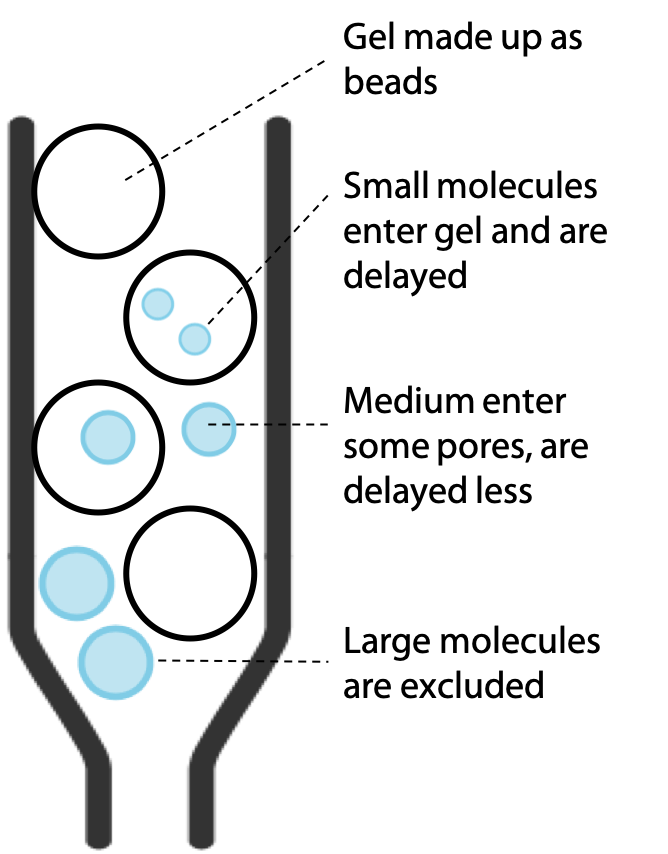
The larger molecules are excluded from the pores by their size, but this does not block them, since they simply stay in the buffer that flows around the outside of the beads of gel. Therefore, large molecules progress at a rate similar to the buffer, while smaller molecules are slowed down according to the extent that they can penetrate the gel (Figure 3.13).
Gel filtration can be used to estimate molecular mass of proteins
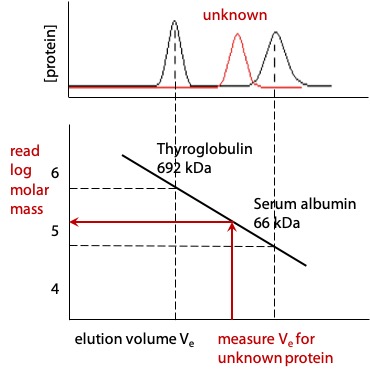
Elution volume of proteins is a negative slope linear function of the log of molecular mass.
If the elution volume is measured for two or more proteins of known molecular mass, it is then possible to measure the elution volume of an unknown protein and estimate its molecular mass either by interpolating the graph or by deriving the equation of the straight line (Figure 3.14).
Gels of various kinds are commercially available, which have different pore sizes for different sizes of protein.