3.3 Indexes
Section Exercises – after the reading
Work on section 3.3 exercises in Fundamentals of Business Math Exercises after reading this section. Discuss your solutions with your peers and/or course instructor.
You may consult answers to select exercises: Fundamentals of Business Math Exercises – Select Answers
You read in the Financial Post that the S&P/TSX Composite Index is up 12.74 points while the NASDAQ is down 45.98, and you wonder what this means for your investment portfolio. The consumer price index rose 3.1% since last year, and you wonder if the raise your employer offered you keeps pace. To make sense of these numbers, you need to understand indexes.
What is an index?
Very often we need a measure that will allow us to compare quantities sharing the same specific characteristic with respect to some fixed quantity of same characteristic.
For example, how does the tuition cost in some specific program in a given year compare to the tuition cost at specific, fixed year? Or, how does the cost of housing in a particular area compare over time to the housing cost in a specific year? Or, how does the production output at certain staffing levels compare to the production output at some fixed staffing level? In other words, we wish to be able to compare a particular type of quantity to some base value. This is where index numbers come in.
An index is a number that is used to compare a quantity sharing the same characteristic as another, fixed value quantity, but measured under different circumstances. Usually, but not always, the comparison involves two different points of time. This comparison between the given quantity and the fixed, base quantity is expressed as a rate of the given quantity with respect to the base quantity, which is then multiplied by the base index (usually 100). The result is called an index number, which expresses the relationship between the two quantities. The index values are calculated by statisticians using weighted averages through complex and very specific processes. In our course, the base index will have the value of 100.
Definition of index number:
[latex]\text{index}=\dfrac{\text{given quantity}}{\text{base quantity}}\cdot 100[/latex]
This fundamental relationship allows us to make comparisons of two quantities using their corresponding indexes through the relationship of proportion:
Fundamental relationship of indexes:
[latex]\text{index 1 }:\text{ index 2 }=\text{ quantity 1 }:\text{ quantity 2 }[/latex]
or
[latex]\dfrac{\text{index 1 }}{\text{index 2 }}=\dfrac{\text{quantity 1 }}{\text{quantity 2 }}[/latex]
A special case of the above relationship is when one of the indexes is the base index. The base index is effectively the anchor point against all other index values. Remember that the value of base index is 100.
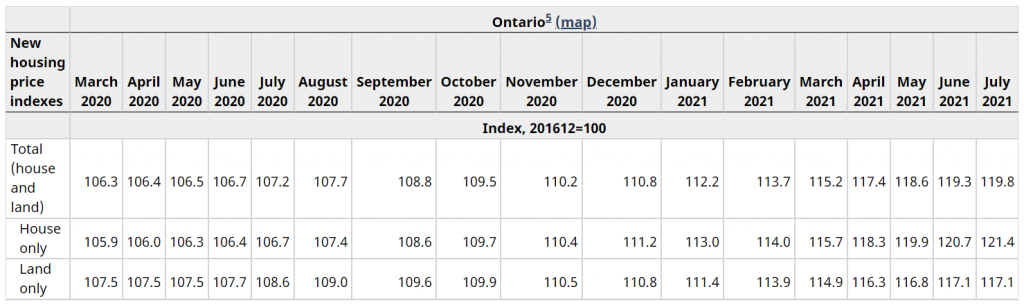
For example, if we look at the data from Statistics Canada, we can see that the base of the index for new housing price in Ontario is set for December 2016. We also see that the Ontario new housing price index for house and land was 117.2 in July 2021. This means that the index has increased from 100 in December 2016 to 119.8 in July 2021, i.e, the average price of new house and land in Ontario has increased during that period by 19.8%.
In particular, if the price of a new house and land in December 2016 was $500,000, we can calculate the comparable value in July 2021 using the fundamental relationship of indexes:
[latex]\begin{align*} &I_{\text{Dec 2016}}:I_{\text{Jul 2021}}=P_{\text{Dec 2016}}:P_{\text{Jul 2021}}\\ &\\ &\Rightarrow 100:117.2=500000:P_{\text{Jul 2021}}\\ &\\ &\Rightarrow 100\cdot P_{\text{Jul 2021}}=117.2\cdot 500000\\ &\\ &\Rightarrow P_{\text{Jul 2021}}=\frac{117.2\cdot 500000}{100}=\$586,000 \end{align*}[/latex]
Therefore, a new house and land property priced at $500,000 at base time of December 2016 would be priced, on average, at $586,000 in July 2021.
Similarly, we might want to estimate what a new house and land in Ontario valued at $450,000 in July 2020 would be expected to cost a year later, in July 2021. We can see that the new housing price index for house and land in Ontario in July 2020 was July 107.2. See table below:
Then, using the fundamental index relationship we have:
[latex]\begin{align*} &I_{\text{Jul 2020}}:I_{\text{Jul 2021}}=P_{\text{Jul 2020}}:P_{\text{Jul 2021}}\\ &\\ &\Rightarrow 107.2:119.8=450000:P_{\text{Jul 2021}}\\ &\\ &\Rightarrow 107.2\cdot P_{\text{Jul 2021}}=119.8\cdot 450000\\ &\\ &\Rightarrow P_{\text{Jul 2021}}=\frac{119.8\cdot 450000}{107.2}=\$502,891.79 \end{align*}[/latex]
So, a new house and land in Ontario priced at $450,000 in July 2020 would have the expected value of $502,891.79 in July 2021.
On the other hand, we might be interested in what the expected price of new house and land would have been in July 2020 if it was valued in July 2021 at $739,000. Again, we can use the fundamental relationship of indexes to determine the answer to that question. We have:
[latex]\begin{align*} &I_{\text{Jul 2020}}:I_{\text{Jul 2021}}=P_{\text{Jul 2020}}:P_{\text{Jul 2021}}\\ &\\ &\Rightarrow 107.2:119.8=P_{\text{Jul 2020}}:739000\\ &\\ &\Rightarrow 107.2\cdot739000=119.8\cdot P_{\text{Jul 2020}}\\ &\\ &\Rightarrow P_{\text{Jul 2020}}=\frac{107.2\cdot 739000}{119.8}=\$661,275.46 \end{align*}[/latex]
So, a new house and land in Ontario priced at $739,000 in July 2021 would have a year earlier, in July 2020, the expected value of $661,275.46.
Example 3.3 A: Indexing the Price of Gold
In January 2000, the average price of gold per troy ounce was $284.32 (in US dollars). In May 2011, the average price of gold was $1,494.89. Express the gold price in 2011 indexed against the gold price in 2000.
Answer:
gold price index in 2011 = ?, base year = 2000, [latex]I=index, p=price[/latex]
[latex]\begin{align*} \overset{\checkmark}{I_{2000}}:\overset{?}{I_{2011}}=\overset{\checkmark}{p_{2000}}:\overset{\checkmark}{p_{2011}}&\Rightarrow I_{2000}\cdot p_{2011}=I_{2011}\cdot p_{2000}\\ &\Rightarrow I_{2011}=\frac{I_{2000}\cdot p_{2011}}{p_{2000}}\\ &\Rightarrow I_{2011}=\frac{100\cdot 1494.89}{284.32}=525.78 \end{align*}[/latex]
Therefore, the May 2011 gold price has an index number of 525.78 when compared to the January 2000 price. This means that the price of gold has increased by 425.78% over the approximate 11-year period.
Concept Check
Check your understanding of what index is and how it is calculated.
MathMatize: Index as a comparison
Specialty Indexes
While indexes can be created for any comparison of two quantities, two specialized indexes are widely used across the business and financial sectors of Canada: the consumer price index and the S&P/TSX Composite Index.
Consumer Price Index
One of the most closely watched price indexes in Canada is the consumer price index, or CPI. Historical values for this index (base year = 2002) are illustrated in the graph on the left, while the historical rates of inflation (1915-2020) are depicted in the graph on the right using the Statistics Canada CPI data (Table 18-10-0005-01 Consumer Price Index, annual average, not seasonally adjusted; accessed September 12, 2021):

The CPI, calculated by Statistics Canada on a monthly basis, is used as a measure for estimating the rate of inflation or the cost of living (notice the slope of the CPI line increases or decreases in accordance with the change in the rate of inflation). The CPI measures the average price of the goods and services that a typical Canadian household commonly purchases, which is called the market basket. This basket contains about 600 items in categories such as food, housing, transportation, furniture, recreation, and clothing. The CPI is used for many purposes, such as increases in wages, pensions, salaries, prices, the Canada Pension Plan (CPP), and Old Age Security (OAS).
In the section opener, we looked at the question of discussing your raise with your employer. Since the CPI reflects the changing cost of living, you must ensure that any raise your employer offers covers, at the barest minimum, the increased costs of living. For example, if the CPI increased from 133.4 to 136 over the year, reflecting a 2.6% rate of inflation, then your raise needs to be at least 2.6% to keep you in the same financial position as last year.
Purchasing Power
The consumer price index is applied in determining the purchasing power of a currency, which is the amount of goods and services that can be exchanged for a unit of a particular currency, such as the dollar. The result of the calculation is a percentage showing how much more or less of a product is received in return for every unit of currency spent. For example, in 1990s the cost of a movie ticket was about $5. If someone hid a five-dollar bill under their mattress and found it today, they could not use it to cover the cost of admission to the movie today. In other words, the purchasing power of that five-dollar bill has drastically declined.
The calculation of the purchasing power of a dollar (PPD) follows from the fundamental relationship of indexes, comparing the value of $1 today to its equivalent value in the base year:
[latex]\begin{align*} (\text{CPI})_{base}:(\text{CPI})_{current}&=\overbrace{(\$1)_{base}}^{\text{PPD}}:(\$1)_{current}\\ &\\ &\Rightarrow 100\cdot (\$1)_{current}=(\text{CPI})_{current}\cdot\text{PPD}\\ &\\ &\Rightarrow \text{PPD}=\frac{100\cdot \$1}{(\text{CPI})_{current}}\\ &\\ &\Rightarrow \text{PPD}=\frac{\$1}{(\text{CPI})_{current}}\cdot 100 \end{align*}[/latex]
Therefore,
Example 3.3 B: How Has Your Purchasing Power Changed?
In March 2006, the CPI was 108.6. By March 2011 it had risen to 119.4. As a percent change, how did your purchasing power change over that time frame?
Answer: % change in purchasing power = ? , 2006 vs. 2011
[latex]\begin{align*} &\text{% change in purchasing power}\\ &\\ &=\frac{\overset{?}{\text{change in purchasing power from 2006 to 2011}}}{\underset{?}{\text{purchasing power in 2006}}}\\ &\\ &=\frac{\overset{?}{(\text{purchasing power in 2011})}-\overset{?}{(\text{purchasing power in 2006})}}{\underset{?}{\text{purchasing power in 2006}}}\\ &\\ &=\frac{\dfrac{100}{\text{CPI}_{2011}}-\dfrac{100}{\text{CPI}_{2006}}}{\dfrac{100}{\text{CPI}_{2006}}}=\frac{\dfrac{100}{119.4}-\dfrac{100}{108.6}}{\dfrac{100}{108.6}}\\ &\\ &\approx -0.090452 = -9.0452\% \end{align*}[/latex]
From March 2006 to March 2011, your purchasing power declined by 9.0452%. In other words, for the same amount of money, you were able to buy approximately 9% less worth of items in 2011 than in 2006.
Concept Check
Check your understanding of CPI and the purchasing power of the dollar.
MathMatize: CPI and the purchasing power
Real Income
Another application of the consumer price index allows you to assess your real earnings. With the cost of living (inflation) always changing, it is difficult to assess how much more or less money you are truly making. Real income allows you to remove the effects of inflation from your income, allowing for a fair comparison of earnings at different points in time. For example, if your gross earnings last year were $50,000 and you received a $1,500 raise this year, how much more are you truly earning if the CPI changed from 114.6 to 116.6 over the same time frame?
The calculation of real income follows from the fundamental relationship of indexes, comparing the current income value, called the nominal income, to its equivalent value in the base year, the real income:
[latex]\begin{align*} (\text{CPI})_{base}:(\text{CPI})_{current}&=\overbrace{(\text{income})_{base}}^{\text{real income}}:(\text{income})_{current}\\ &\\ &\Rightarrow 100\cdot (\text{income})_{current}=(\text{CPI})_{current}\cdot\text{real income}\\ &\\ &\Rightarrow \text{real income}=\frac{100\cdot (\text{income})_{current}}{(\text{CPI})_{current}}\\ &\\ &\Rightarrow \text{real income}=\frac{(\text{income})_{current}}{(\text{CPI})_{current}}\cdot 100 \end{align*}[/latex]
Therefore,
For example, suppose your gross earnings were $40,000 when the CPI was 111.7. Suppose further that your current income is $42,000 and the CPI is 113.3. To assess how your income has changed, you need to calculate your real income for each and compare the real income values to check if, in reality, your income increased, decreased or stayed the same.
Calculate the real income for $40,000 when the CPI was 111.7, call it [latex](\text{real income})_{\text{old}}[/latex]:
[latex](\text{real income})_{\text{old}}=\frac{\text{old income}}{\text{old CPI}}\cdot 100=\frac{40000}{111.7}\cdot 100=\$35,810.21[/latex]
Calculate the real income for $42,000 when the CPI was 113.3, call it [latex]\text{real income}_{\text{new}}[/latex]:
[latex](\text{real income})_{\text{new}}=\frac{\text{new income}}{\text{new CPI}}\cdot 100=\frac{42000}{113.3}\cdot 100=\$37,069.73[/latex]
Comparing the amounts, you see that your real income expressed in base-year dollars has risen by $37,069.73 − $35,810.21 = $1,259.52. Notice that your nominal income rose by $2,000. This means that of your $2,000 increase in income, you really are only making $1,259.82 more. In other words, the $2,000 increase was in name only. The real increase in terms of purchasing power was $1,259.82. The other $740.18 represents your increased cost of living.
Concept Check
Check your understanding of the concepts of real income and keeping up with inflation.
MathMatize: Inflation and real income
Example 3.3 C: Did You Get a Raise?
Now that your boss has conducted your performance review, the time has come to discuss your raise. Last year you earned $81,250 annually. Your boss has offered you a new salary of $83,000 annually. You know last year that the CPI was 104.1 and this year it sits at 106.6. Assess the salary offer.
Answer: which offer is better? [latex]\rightarrow[/latex] compare real incomes of last year vs. current year offer
[latex](\text{real income})_{\text{last year}}=\frac{\text{last year income}}{\text{last year CPI}}\cdot 100=\frac{81250}{104.1}\cdot 100=\$78,049.95[/latex]
[latex](\text{real income})_{\text{offer}}=\frac{\text{income offer}}{\text{current year CPI}}\cdot 100=\frac{83000}{106.6}\cdot 100=\$77,861.16[/latex]
Therefore, although it appears as if you are receiving a $1,750 wage increase, when you factor in the increased cost of living you are actually earning $188.79 less than you did last year. Perhaps you should discuss this matter further with your boss. Since the CPI had a percent change of 2.4015% (verify!), your income must rise to at least $83,201.25 for you to break even.
Section Exercises – after the reading
Work on section 3.3 exercises in Fundamentals of Business Math Exercises after reading this section. Discuss your solutions with your peers and/or course instructor.
You may consult answers to select exercises: Fundamentals of Business Math Exercises – Select Answers
