Cost-Volume-Profit Analysis Investigation Project – Chapter 8
Ana Duff, adapted from work by J. Olivier and D. Lippman
Modeling data for Cost-Volume-Profit Analysis
Getting the data
-
Create a document in Microsoft Word and add the heading CVP Analysis Summary.
-
Get the data:
- Download the Excel file CVP Analysis Data.
- Save the document.
-
Open https://www.desmos.com/calculator
Cost model
-
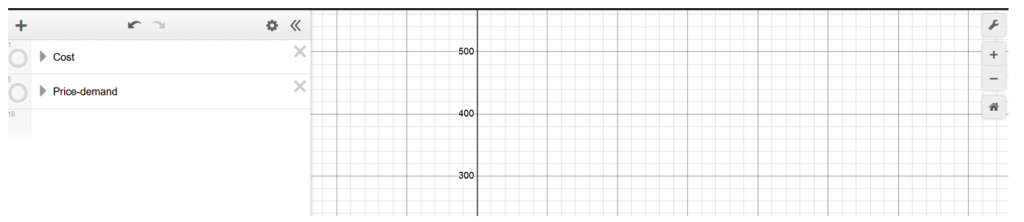
Open a new folder and name it Cost.
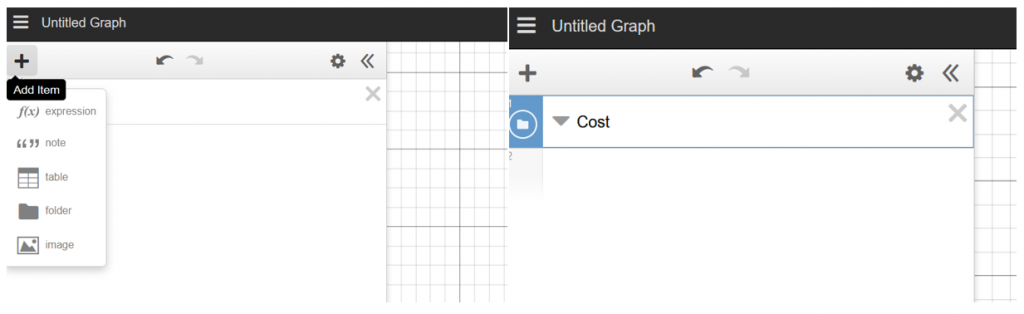
-
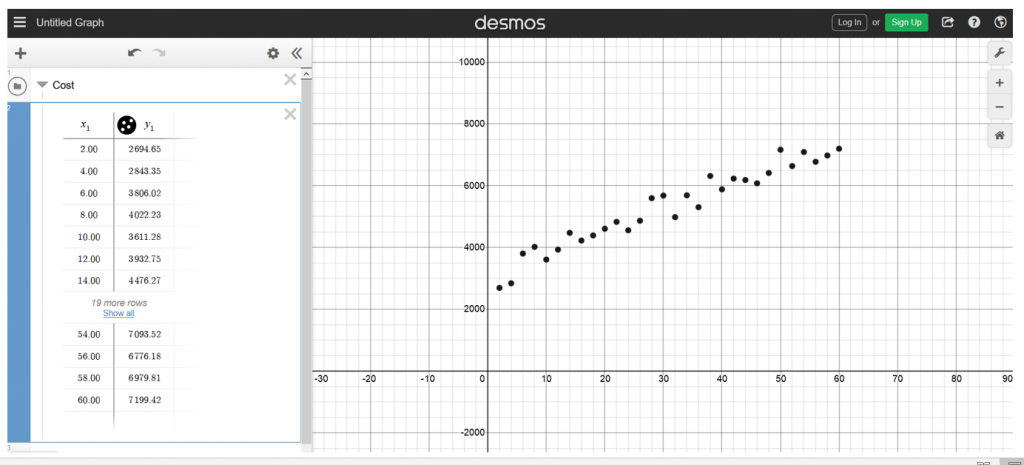
Select the data in cost-production worksheet and copy into Cost folder
- Make note that the data variables created by Desmos are [latex]x_1[/latex] and [latex]y_1[/latex]. You can change these but will have to make the corresponding changes to formulas used below as well.
-
Analyze the data trend and decide on an appropriate function type to model the cost data
-
- Cost data appears to follow a linear trend
- Should try [latex]C(x)=mx+b[/latex]
-
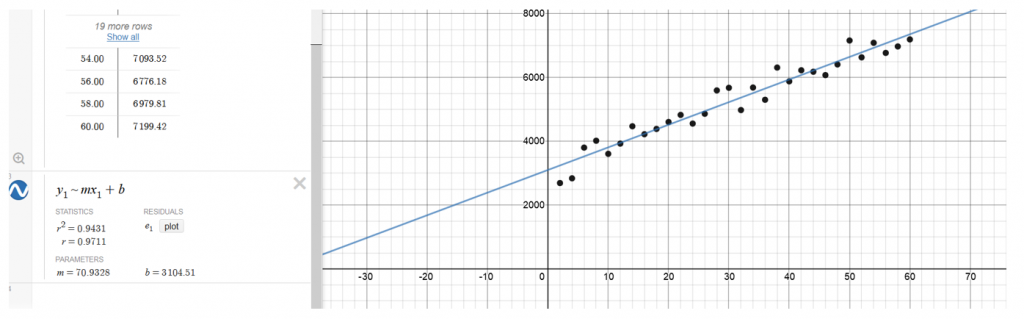
Create an appropriate cost function model using the Desmos regression tool
- In Cost folder, add y1~mx1+b to a new line in the folder
-
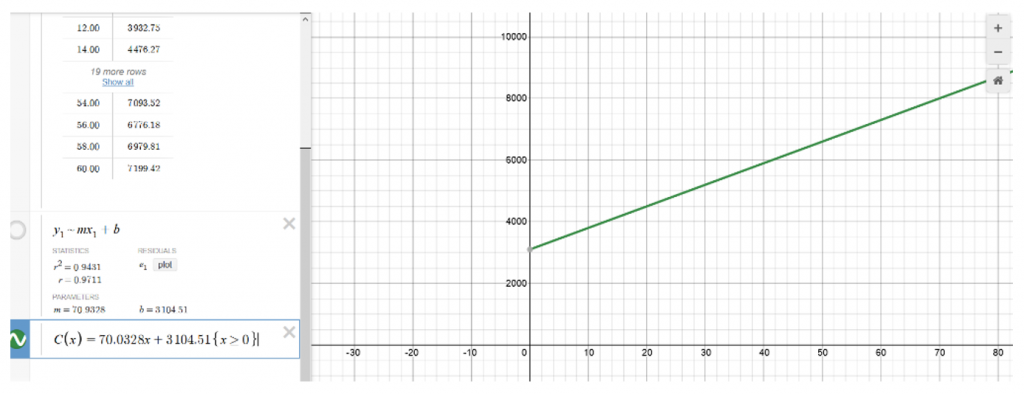
Write the cost function model and plot it:
- In Cost folder, add the appropriate formula for , with appropriate domain restrictions;
- Hide the regression model and the data.
-
Hide and minimize Cost folder:
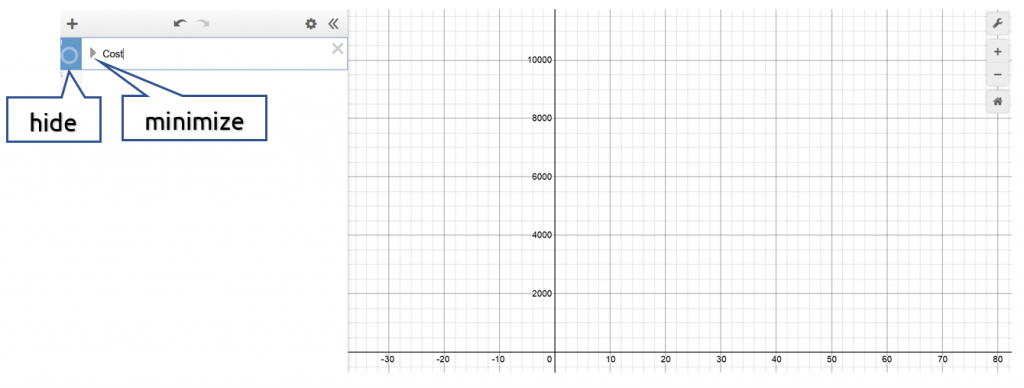
Hide folder content list and graph
-
Record in your CVP Analysis Summary document the cost function model and its domain.
Price-demand model
-
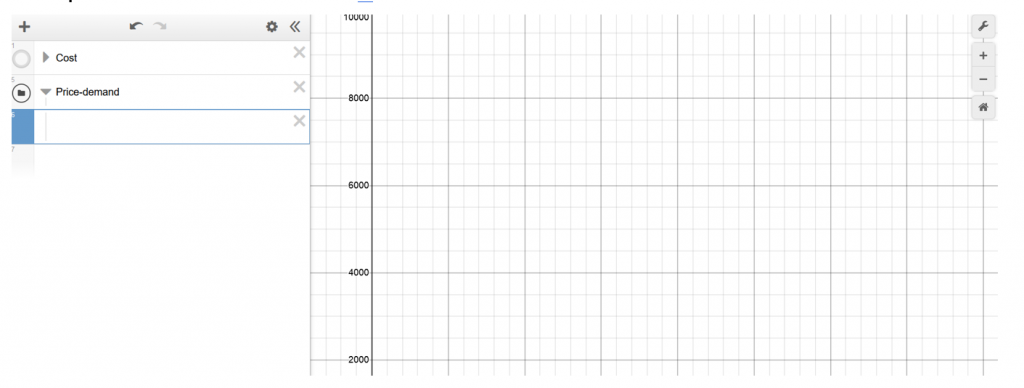
Open a new folder and name it Price-demand.
-
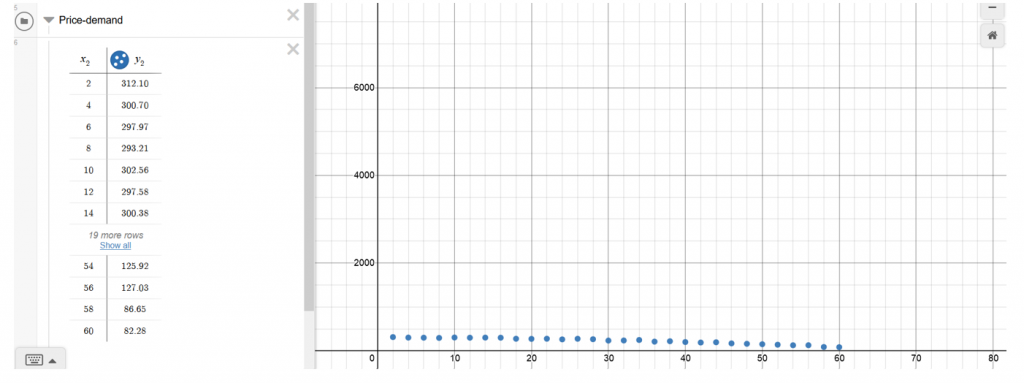
Copy-paste data from PriceDemandData file into Price-Demand folder.
-
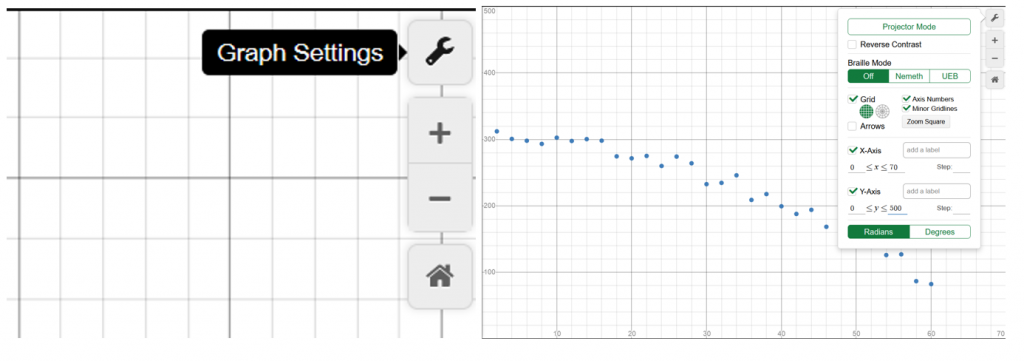
Adjust scaling of the axes for a better view
- Click on Graph Settings tool and adjust the horizontal and vertical view window.
-
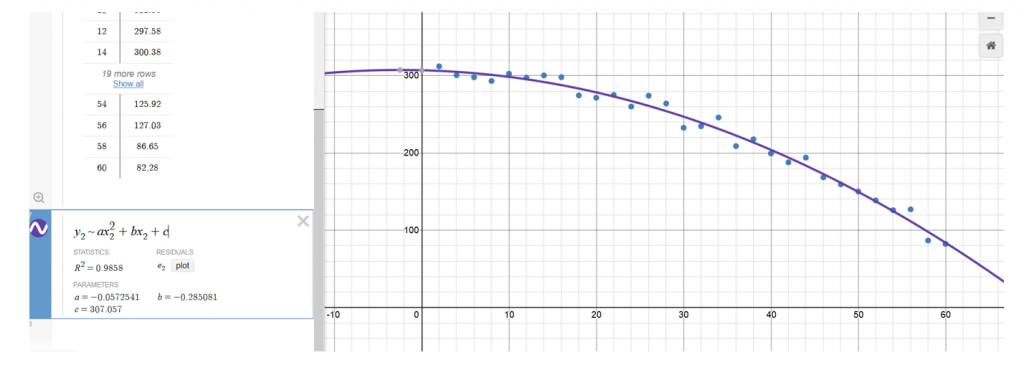
Analyze the data trend and decide on an appropriate function type to model the cost data
- Price-demand data appears to follow a quadratic trend
- Should try [latex]p(x)=ax^2+bx+c[/latex]
-
Create an appropriate price-demand function model using the Desmos regression tool
- In price-demand folder, add y2~ax2^2+bx2+c
-
Write the cost function model and plot it
- In Price-demand folder, add the appropriate formula for , with appropriate domain restrictions;
- Hide the regression model and the data.

-
Hide and minimize Price-demand folder
-
Enter into your CVP Analysis Summary document the price function model and its domain.
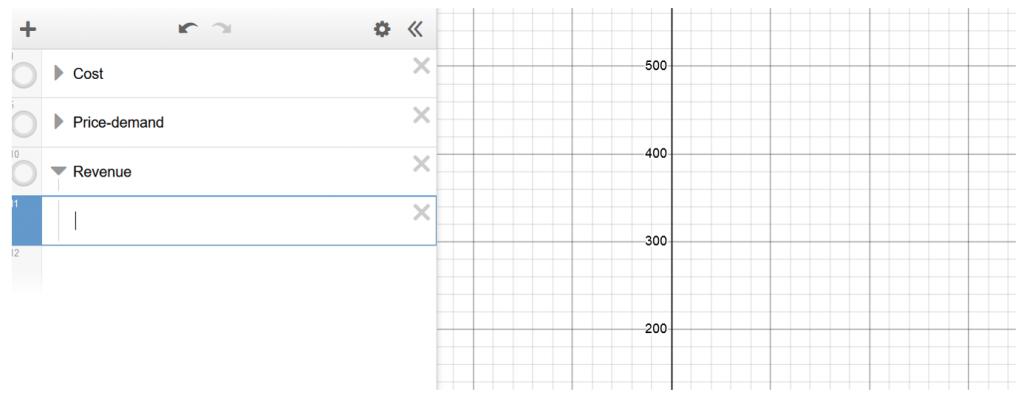
Revenue model
-
Open a new folder and name it Revenue
-
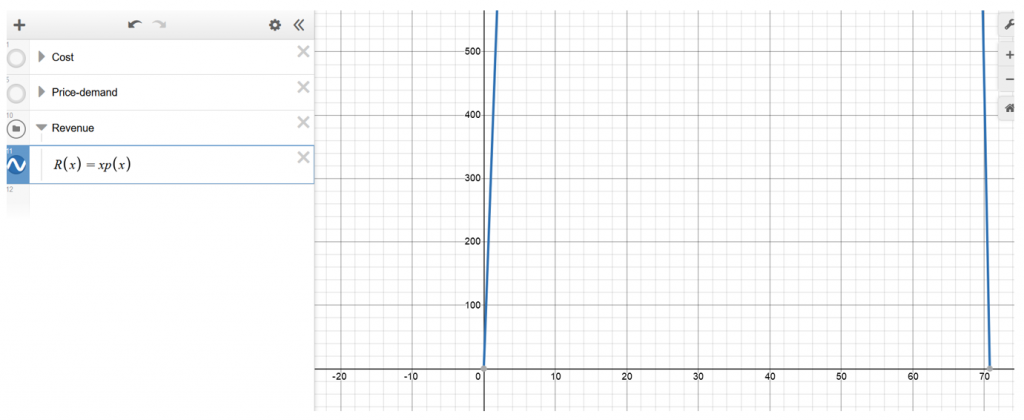
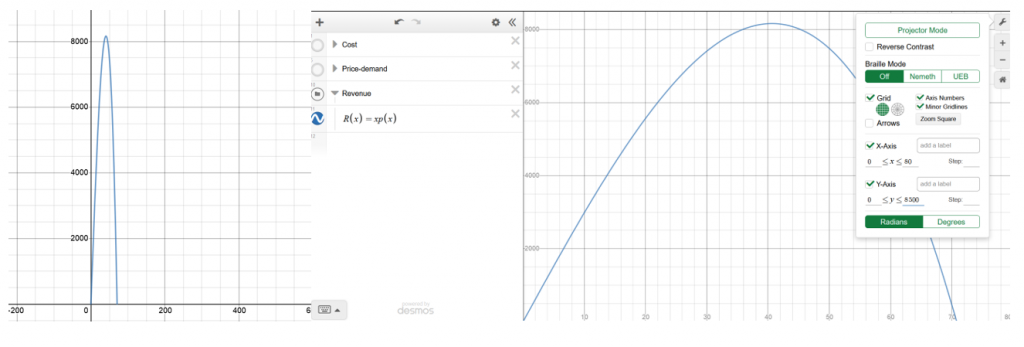
Write the revenue function and plot it
-
Adjust scaling of the axes for a better view
- Zoom out until the whole graph is visible, then click on Graph Settings tool and adjust the horizontal and vertical view window.
-
Hide and minimize Revenue folder
-
Determine the maximum revenue amount and when it occurs (demand and price).
-
Enter into your CVP Analysis Summary document the following:
- the revenue function model
- the maximum revenue amount and when it occurs (demand and price).
Profit model
-
Open a new folder and name it Profit
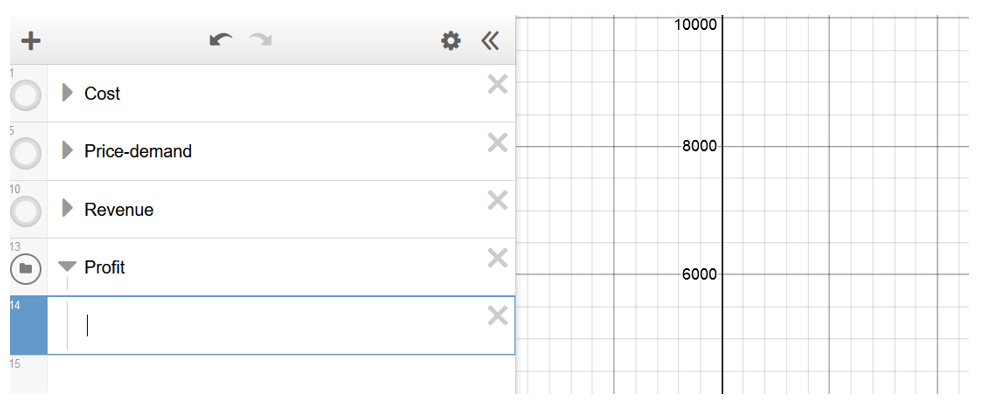
-
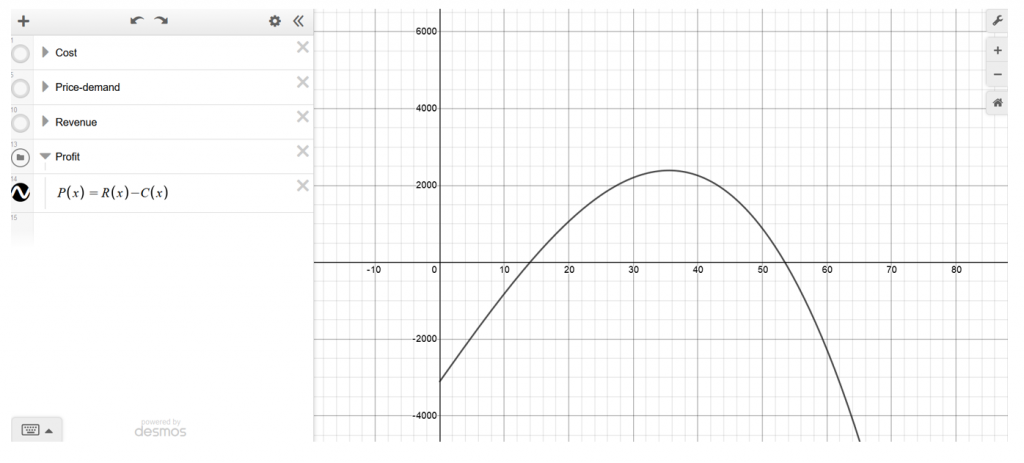
Write the profit function and plot it
-
Hide and minimize Profit folder
-
Determine the maximum profit amount and when it occurs (demand and price).
-
Enter into your CVP Analysis Summary document the following:
- the profit function model
- the maximum profit amount and when it occurs (demand and price).
Cost-volume-profit analysis chart
-
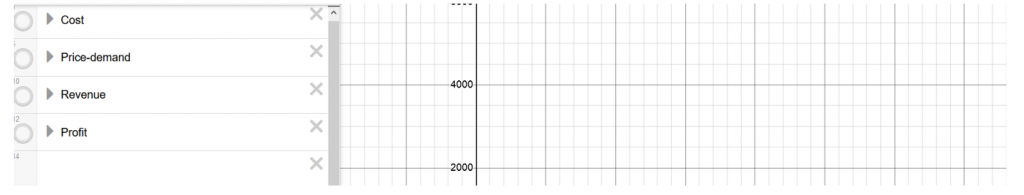
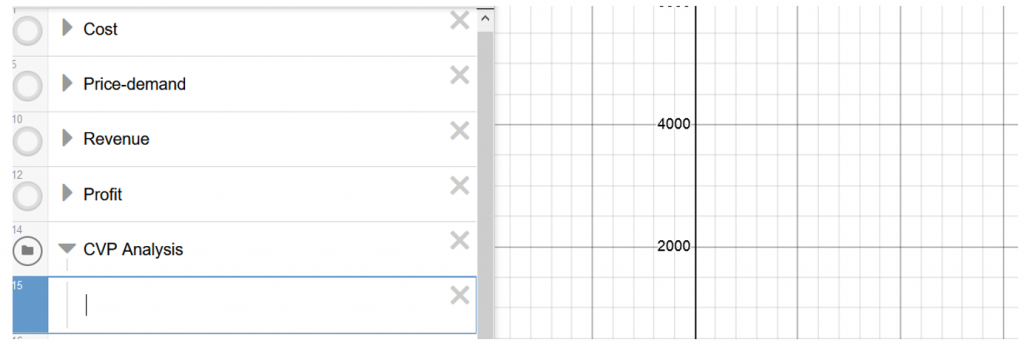
Create a new folder titled CVP Analysis
-
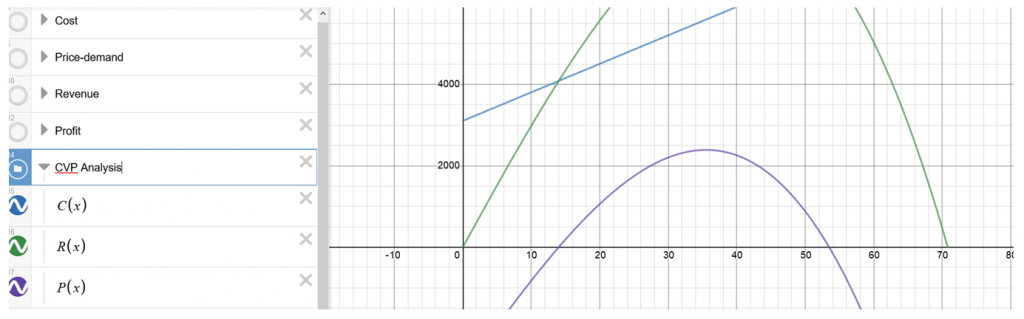
Plot the cost, revenue and profit models
-
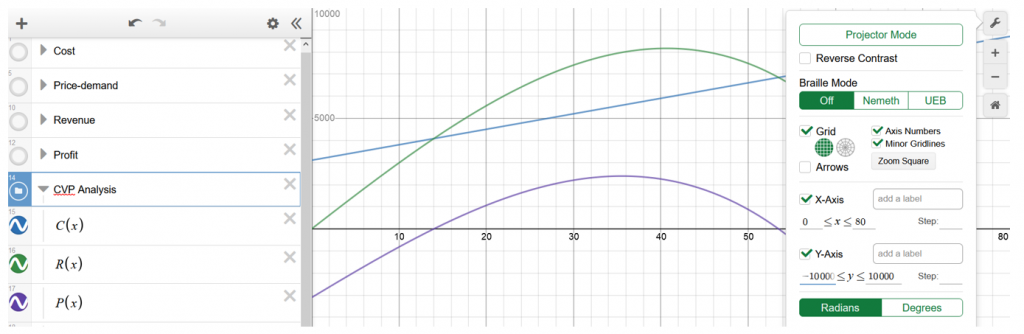
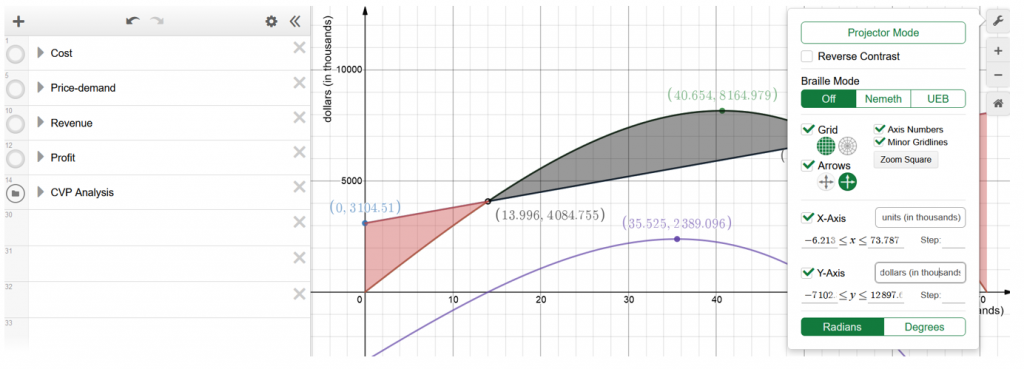
Adjust scaling of the axes for a better view
- Zoom out until all three graphs are fully visible, then click on Graph Settings tool and adjust the horizontal and vertical view window.
-
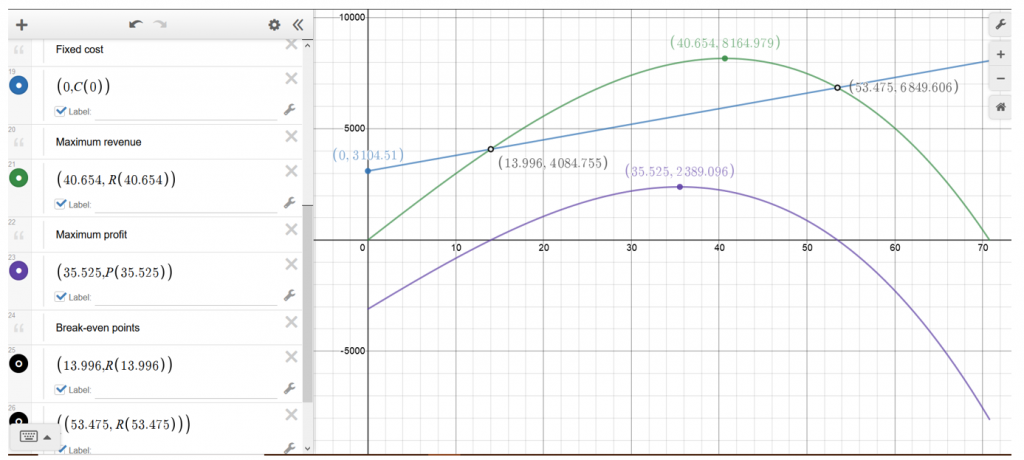
Add points of interest to the graph: fixed cost, maximum revenue, maximum cost, maximum profit and break-even points
- Click on the graph around each point of interest and note the value of the point as identified by Desmos;
- Plot and label each point on the graph.
-
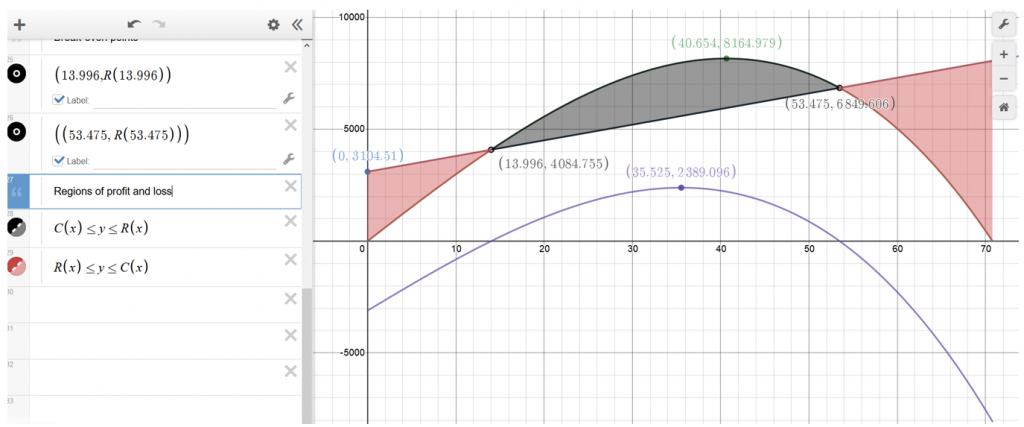
Mark regions of profit and loss
- Plot area where revenue is higher than cost: ;
- Plot area where cost is higher than revenue: .
-
Finalize the CVP Analysis Graph
- Minimize CVP folder;
- Add graph arrows and axes titles using Graph Settings tool.
-
Complete your CVP Analysis Summary document by adding the following:
- the break-even demand, price and revenue
- the link to the graph through Share Your Graph – Copy Link tool and insert it into the Word document;
- the image of the graph by first downloading it using Share Your Graph – Export Image tool, then copying into the submission document.
THE END
Attribution: Created by Ana Duff (Ontario Tech University), published under Creative Commons Attribution-NonCommercial-ShareAlike licence (CC-BY-NC-SA)
Any modifications to this case study may affect its solvability and caution is advised.
