9.4 Value Stream Mapping
Learning Objective
3. Describe the concept of Value Stream Mapping.
Value Stream Mapping
The emergence of waste in supply chain activities directly impact availability of goods to the final consumers. One of the best ways to manage waste is to apply lean approach with Value Stream Mapping technique.
As cited by Adrianto & Kholil (2015) in the article by Amrina & Fitrahaj (2020), Lean is an approach in identifying and eliminating waste or non-value-added activities through continuous improvement. There are 8 things that cause waste (Helleno, Moraes & Simon, 2017):
- Overproduction (excessive production),
- Unnecessary Inventory (inventory that is not needed),
- Defect (defective product),
- Unnecessary Motion (movements that do not add value),
- Excessive Transportation (excessive material or product movement),
- Inappropriate Processing (inappropriate process),
- Waiting (waiting time), and
- Unutilized Talent (ability that is not utilized) (Amrina & Fitrahaj, 2020).
In the Lean concept, waste can be removed through 12 techniques, and one of them is Value Stream Mapping (Amrina & Zagloel, 2019). As cited by Firdaus (2018) in the article by Amrina & Fitrahaj (2020), Value Stream Mapping (VSM) is a method used to visualize waste in a complete process. VSM maps the process flow, information flow and material flow. VSM helps decision makers identify activities that do not add value by mapping current conditions.
Mapping the value-added processes within the supply chain is useful for management because it aligns stakeholders, from multiple departments, on the needs of the customer and the demands of the supplier. It’s also an effective tool for illustrating the overall supply chain for a product to a variety of audiences (Justin, 2017).
Video: Value Stream Mapping (2:27)
Watch this video to understand how Value Stream Mapping works and its benefits.
Media 9.3. Value Stream Mapping [Video]. The Supply Chain Sustainability School.
Five Lean Thinking Fundamentals:
Lean Approach is based on five principles:
- Specify Value: It is hard to identify what adds value to your business. Value is defined by customers in terms of specific products and services they are willing to pay for.
- Identify the Value Stream: The Value Stream itself is the series of individual processes that connect together to create the valuable goods or service that an organization produces for its customer. The process of mapping the Value Stream is designed to view the big, macro picture in order for executives to make strategic decisions as part of an extended organizational transformation effort.
- Make Value Flow Continuous: The best way of having a continuous flow of material and information is to eliminate the wastes involved in supply chain process. Having eliminated waste, makes remaining value creating steps flow.
- Let Customers Pull Value: There are two ways organizations work – Push and Pull. Traditional organizations used to work on Push System wherein what ever they produce were make available for consumers to consume. This no longer works in today’s market, rather customer’s pull cascades all the way back to the lowest level supplier, enabling just in time production.
- Pursue Perfection: Adding value and eliminating non-value added steps is a never ending process. With changing needs and demands of consumers, companies need to look into the processes time and again to ensure perfection.
Building a Value Stream Map
Value Stream Map in Supply chain is a visual way to identify steps involved in the supply chain process and their relationship. It makes decision makers to see value added and non-value added activities clearly by drawing the whole process from upstream to downstream on a paper. “To Create flow you need a vision. Mapping helps you see and focus on flow with a vision of an ideal or improved state (Rother and Shook, 2018) . Figure 9.5 shows an example of how Value Stream Map looks.
Value Stream Map: Example
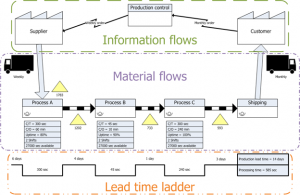
Note. Components of a Value Stream Map. From Wikimedia Commons, 2013. CC-BY-SA 3.0. [Image description].
As shown in Figure 9.5, Value Stream Maps are divided into three sections – Information Flows, Material Flows and Lead Time Ladder. Let’s look into these sections:
- Information Flows: Information flow is located at the top half of the map and is drawn from right to left, starting with customers indicating the pull value principle. To present the flow of information between customer and company and then company and supplier, narrow line is used.
- Material Flow: Material Flow is located in the center of the map and is drawn from left to right. It provides valuable information to decision makers and includes the activities such as identifying different processes along with a few statistics such as cycle time, changeover time, uptime, batch sizes, working time and scrap rate. The icons used at this stage are very important as they represent clear flow of material. This is the section that highlights wastage a company is making in terms of holding over or under inventory. It is important to note that material movement is pushed by producer and not pulled by consumer.
- Lead Time Ladder: The bottom part is the simplest and extremely important. It indicates the length each process takes in value chain.
Did You Know?
The shorter your production lead time, the shorter the time between paying for raw material and getting paid for product made from those materials. A shorter production lead time will lead to an increasing in the number of inventory turns, a measure with which you may be more familiar (Rother and Shook, 2018).
Once the current information and material flow along with lead time calculation is complete, companies tend to reach at a current state map which is analyzed by all the stakeholder and company representatives to highlight wastes and its sources. These wastes are eliminated by implementing a future-state map which is the final stage of value stream mapping process.
Check Your Understanding
Answer the question(s) below to see how well you understand the topics covered above. You can retake it an unlimited number of times.
Use this quiz to check your understanding and decide whether to (1) study the previous section further or (2) move on to the next section.
Check Your Understanding: Value Stream Mapping
Media Attributions and References
DanielPenfield. (2013). [Value stream map: Example] [Image]. Wikimedia Commons. https://commons.wikimedia.org/wiki/File:ValueStreamMapParts.png. CC BY SA 3.0.
The process that starts with customer demand.
Time taken from start of product to its completion.
Time elapsed during converting a line or machine from running one product to another.
Time during which a piece of equipment (such as a computer) is functioning or able to function (Mariam Webster, n.d.)
The number of products manufactured in one batch.
The time spend on job for which a worker is paid salary.
The rate that measures quality of output.
The time gap between placing an ordering and receiving it.
