4.7: Break-Even Analysis
Formula & Symbol Hub
For this section you will need the following:
Symbols Used
- [latex]CM[/latex] = Unit contribution margin
- [latex]n[/latex] = Breakeven level of output
- [latex]TFC[/latex] = Total fixed cost
- [latex]TR[/latex] = Total revenue at Break-even
Formulas Used
-
Formula 4.7a – Unit Break-Even
[latex]\begin{eqnarray*}n&=&\frac{TFC}{CM}\end{eqnarray*}[/latex]
-
Formula 4.7b – Dollar Break-Even
[latex]\begin{eqnarray*}TR&=&\frac{TFC}{CR}\end{eqnarray*}[/latex]
Introduction
Should you start up the Internet business described in the last section? Right now, all you have are some projected costs and a forecasted level of sales. You imagine you are going to sell [latex]400[/latex] units. Is that possible? Is it reasonable to forecast this many sales?
Now you may say to yourself, “[latex]400[/latex] units a month . . . that’s about [latex]13[/latex] per day. What’s the big deal?” But let’s gather some more information. What if you looked up your industry in Statistics Canada data and learned that the product in question sells just [latex]1,000[/latex] units per month in total? Statistics Canada also indicates that there are eight existing companies selling these products. How does that volume of [latex]400[/latex] units per month sound now? Unless you are revolutionizing your industry, it is unlikely you will receive a [latex]40\%[/latex] market share in your first month of operations. With so few unit sales in the industry and too many competitors, you might be lucky to sell [latex]100[/latex] units. If this is the case, are you still profitable?
Simply looking at the fixed costs, variable costs, potential revenues, contribution margins, and typical net income is not enough. Ultimately, all costs in a business need to be recovered through sales. Do you know how many units have to be sold to pay your bills? The answer to this question helps assess the feasibility of your business idea.
What Is Break-Even Analysis?
If you are starting your own business and head to the bank to initiate a start-up loan, one of the first questions the banker will ask you is your break-even point. You calculate this number through break-even analysis, which is the analysis of the relationship between costs, revenues, and net income with the sole purpose of determining the point at which total revenue equals total cost. This break-even point is the level of output (in units or dollars) at which all costs are paid but no profits are earned, resulting in a net income equal to zero. To determine the break-even point, you can calculate a break-even analysis in two different ways, involving either the number of units sold or the total revenue in dollars. Each of these two methods is discussed in this section.
Method 1: Break-Even Analysis in Units
In this method, your goal is to determine the level of output that produces a net income equal to zero. This method requires unit information, including the unit selling price and unit variable cost.
It is helpful to see the relationship of total cost and total revenue on a graph. Assume that a company has the following information:
[latex]\begin{eqnarray*}TFC&=&\$400\\S&=&\$100\\VC&=&\$60\end{eqnarray*}[/latex]
The graph shows dollar information on the [latex]y[/latex]-axis and the level of output on the [latex]x[/latex]-axis. Here is how you construct such a graph:
1. Plot the total costs:
a. At zero output you incur the total fixed costs of [latex]\$400[/latex]. Denote this as Point 1 [latex](0,\$400)[/latex].
b. As you add one level of output, the total cost rises in the amount of the unit variable cost. Therefore, total cost is:
[latex]TFC+(VC)=\$400+1(\$60)=\$460[/latex]
Denote this as Point 2 [latex](1, \$460)[/latex]
c. As you add another level of output (2 units total), the total cost rises once again in the amount of the unit variable cost, producing [latex]\$400+2(\$60)=\$520[/latex]. Denote this as Point 3 [latex](2, \$520)[/latex].
d. Repeat this process for each subsequent level of output and plot it onto the figure. The red line plots these total costs at all levels of output.
2. Plot the total revenue:
a. At zero output, there is no revenue. Denote this as Point 4 [latex](0, \$0)[/latex].
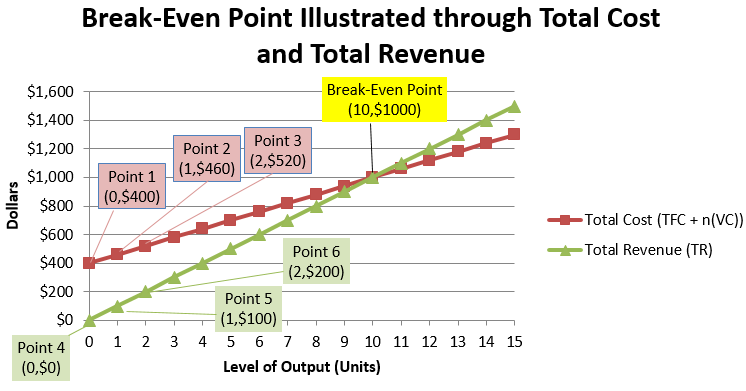
b. As you add one level of output, total revenue rises by the selling price of the product. Therefore, total revenue is [latex]n(S)=1(\$100) = \$100[/latex]. Denote this as Point 5 [latex](1, \$100)[/latex].
c. As you add another level of output (2 units total), the total revenue rises once again in the amount of the selling price, producing [latex]2(\$100) = \$200[/latex]. Denote this as Point 6 [latex](2, \$200)[/latex].
d. Repeat this process for each subsequent level of output and plot it onto the figure. The green line plots the total revenue at all levels of output.
The purpose of break-even analysis is to determine the point at which total cost equals total revenue. The graph illustrates that the break-even point occurs at an output of 10 units. At this point, the total cost is [latex]\$400 + 10(\$60) = \$1,000[/latex], and the total revenue is [latex]10(\$100)=\$1,000[/latex]. Therefore, the net income is [latex]\$1,000 − \$1,000 = \$0[/latex]; no money is lost or gained at this point.
Unit Break-Even Formula
Recall that Formula 4.6b[latex]NI=n\left(S\right)-\left(TFC+n\left(VC\right)\right)[/latex] states that the net income equals total revenue minus total costs. In break-even analysis, net income is set to zero, resulting in:
[latex]0 = n(S)−(TFC + n(VC))[/latex]
Rearranging and solving this formula for [latex]n[/latex] gives the following:
[latex]\begin{eqnarray*}0&=&n(S)-TFC-n(VC)\;\;\\TFC&=&n(S)-n(VC)\;\;\\TFC&=&n(S-VC)\;\;\\[1ex]\frac{TFC}{(S-VC)}&=&n\end{eqnarray*}[/latex]
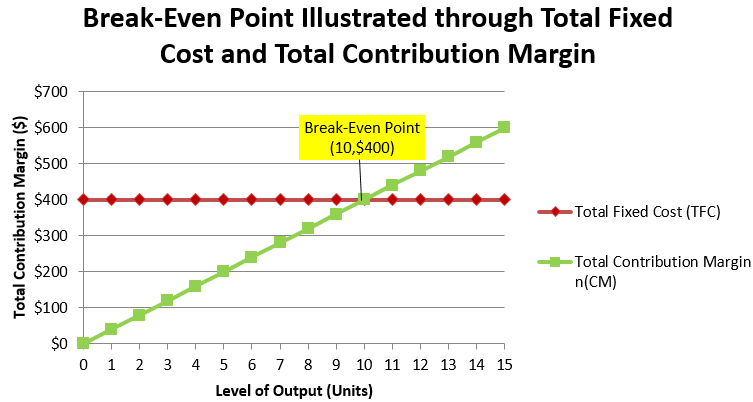
Formula 4.6c[latex]CM=S-VC[/latex] states that [latex]CM = S − VC[/latex]; therefore, the denominator becomes just [latex]CM[/latex]. The calculation of the break-even point using this method is thus summarized in Formula 4.7a.
[latex]\boxed{4.7\text{a}}[/latex] Unit Break-Even
[latex]{\color{blue}{n}}\text{ is Breakeven Level of Output (Units):}[/latex] This is the level of output in units that produces a net income equal to zero.
[latex]{\color{purple}{TFC}}\text{ is Total Fixed Costs:}[/latex] The total of all costs that are not affected by the level of output.
[latex]{\color{red}{CM}}\text{ is Unit Contribution Margin:}[/latex] The amount of money left over per unit after you have recovered your variable costs. Calculate this by taking the unit selling price and subtracting the unit variable cost (Formula 4.6c[latex]CM=S-VC[/latex]). You use this money to pay off your fixed costs.
HOW TO
Calculate the break-even point in units
Step 1: Calculate or identify the total fixed costs ([latex]TFC[/latex]).
Step 2: Calculate the unit contribution margin ([latex]CM[/latex]) by applying any needed techniques or formulas.
Step 3: Apply Formula 4.7a[latex]\begin{align*}n=\frac{TFC}{CM}\end{align*}[/latex].
Continuing with the example that created the graph on the previous page:
Step 1: Total fixed costs are known, [latex]TFC = \$400[/latex].
Step 2: The unit contribution margin is [latex]\$100 − \$60 = \$40[/latex]. For each unit sold this is the amount left over that can be applied against total fixed costs.
Step 3: Applying Formula 4.7a[latex]\begin{align*}n=\frac{TFC}{CM}\end{align*}[/latex] results in [latex]n = \$400 \div \$40 = 10\;\text{units}[/latex].
 Key Takeaways
When you calculate the break-even units, the formula may produce a number with decimals. For example, a break-even point might be [latex]324.39[/latex] units. How should you handle the decimal? A partial unit cannot be sold, so the rule is always to round the level of output up to the next integer, regardless of the decimal. Why? The main point of a break-even analysis is to show the point at which you have recovered all of your costs. If you round the level of output down, you are [latex]0.39[/latex] units short of recovering all of your costs. In the long-run, you always operate at a loss, which ultimately puts you out of business. If you round the level of output up to [latex]325[/latex], all costs are covered and a tiny dollar amount, as close to zero as possible, is left over as profit. At least at this level of output you can stay in business.
Example 4.7.1
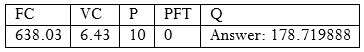
Recall the Internet business explored throughout Examples 4.6.1 to 4.6.4. Now let’s determine the break-even point in units. As previously calculated, the total fixed costs are [latex]\$638.03[/latex] and the unit contribution margin is [latex]\$3.57[/latex].
Solution
Step 1: Write what you know from the question.
The total fixed costs are known: [latex]TFC = \$638.03[/latex].
The contribution rate is known: [latex]CM = \$3.57[/latex].
Step 2: Apply Formula 4.7a.[latex]\begin{align*}n=\frac{TFC}{CM}\end{align*}[/latex]
[latex]\begin{eqnarray*}n&=&\frac{\$638.03}{\$3.57}\\[1ex]n&=&178.719888\end{eqnarray*}[/latex]
Round this up to [latex]179[/latex].
Calculator instructions:
Step 3: Write as a statement.
In order for your Internet business to break even, you must sell [latex]179[/latex] units. At a price of [latex]\$10[/latex] per unit, that requires a total revenue of [latex]\$1,790[/latex]. At this level of output your business realizes a net income of [latex]\$1[/latex] because of the rounding.

Method 2: Break-Even Analysis in Dollars
The income statement of a company does not display unit information. All information is aggregate, including total revenue, total fixed costs, and total variable costs. Typically, no information is listed about unit selling price, unit variable costs, or the level of output. Without this unit information, it is impossible to apply Formula 4.7a[latex]\begin{align*}n=\frac{TFC}{CM}\end{align*}[/latex].
The second method for calculating the break-even point relies strictly on aggregate information. As a result, you cannot calculate the break-even point in units. Instead, you calculate the break-even point in terms of aggregate dollars expressed as total revenue.
Dollar Break-Even Formula
To derive the break-even point in dollars, once again start with Formula 4.6b[latex]NI=n\left(S\right)-\left(TFC+n\left(VC\right)\right)[/latex], where total revenue at break-even less total fixed costs and total variable costs must equal a net income of zero:
[latex]\begin{eqnarray*}NI&=&TR-(TFC+TVC)\\0&=&TR-(TFC+TVC)\end{eqnarray*}[/latex]
Rearranging this formula for total revenue gives:
[latex]\begin{eqnarray*}0&=&TR-TFC-TVC\;\;\\TR&=&TFC+TVC\end{eqnarray*}[/latex]
Thus, at the break-even point the total revenue must equal the total cost. Substituting this value into the numerator of Formula 4.6f gives you:
[latex]\begin{eqnarray*}CR&=&\frac{(TR-TVC)}{TR}\times100\;\;\\[1ex]CR&=&\frac{((TFC\cancel{+TVC})\cancel{-TVC})}{TR}\times100\;\;\\[1ex]CR&=&\frac{TFC}{TR}\times100\end{eqnarray*}[/latex]
A final rearrangement results in Formula 4.7b, which expresses the break-even point in terms of total revenue dollars.
[latex]\boxed{4.7\text{b}}[/latex] Dollar Break-Even
[latex]{\color{teal}{TR}}\text{ is Total Revenue at Break-even:}[/latex] The total amount of dollars that the company must earn as revenue to pay for all of the fixed and variable costs. At this level of revenue, the net income equals zero.
[latex]{\color{purple}{TFC}}\text{ is Total Fixed Costs:}[/latex] The total of all costs that are not affected by the level of output.
[latex]{\color{brown}{CR}}\text{ is Contribution Rate:}[/latex] The percentage of the selling price, expressed in decimal format, available to pay for fixed costs.
HOW TO
Calculate the break-even point in total revenue dollars
Step 1: Calculate or identify the total fixed costs ([latex]TFC[/latex]).
Step 2: Calculate the contribution rate ([latex]CR[/latex]), by applying any needed techniques or formulas. If not provided, typically the [latex]CR[/latex] is calculated using Formula 4.6f[latex]\begin{align*}CR=\frac{TR-TVC}{TR}\times100\end{align*}[/latex], which requires aggregate information only.
Step 3: Apply Formula 4.7b[latex]\begin{align*}TR=\frac{TFC}{CR}\end{align*}[/latex] to calculate the break-even point in dollars.

Assume that you are looking at starting your own business. The fixed costs are generally easier to calculate than the variable costs. After running through the numbers, you determine that your total fixed costs are [latex]\$420,000[/latex], or [latex]TFC = \$420,000[/latex]. You are not sure of your variable costs but need to gauge your break-even point. Many of your competitors are publicly traded companies, so you go online and pull up their annual financial reports. After analyzing their financial statements, you see that your competitors have a contribution rate of [latex]35\%[/latex], or [latex]CR = 0.35[/latex], on average. What is your estimate of your break-even point in dollars?
Step 1: Total fixed costs are [latex]TFC = \$420,000[/latex].
Step 2: The estimated contribution rate is [latex]CR = 0.35[/latex].
Step 3: Applying Formula 4.7b[latex]\begin{align*}TR=\frac{TFC}{CR}\end{align*}[/latex] results in:
[latex]TR = \$420,000 \div 0.35 = \$1,200,000[/latex]
If you average a similar contribution rate, you require total revenue of [latex]\$1,200,000[/latex] to cover all costs, which is your break-even point in dollars.
Key Takeaways
You need to be very careful with the interpretation and application of a break-even number. In particular, the break-even must have a point of comparison, and it does not provide information about the viability of the business.
Break-Even Points Need to Be Compared. The break-even number by itself, whether in units or dollars, is meaningless. You need to compare it against some other quantity (or quantities) to determine the feasibility of the number you have produced. The other number needs to be some baseline that allows you to grasp the scope of what you are planning. This baseline could include but is not limited to the following:
- Industry sales (in units or dollars)
- Number of competitors fighting for market share in your industry
- Production capacity of your business
For example, in your Internet business the break-even point is [latex]179[/latex] units per month. Is that good? In the section opener, you explored a possibility where your industry had total monthly sales of [latex]1,000[/latex] units and you faced eight competitors. A basic analysis shows that if you enter the industry and if everyone split the market evenly, you would have sales of [latex]1,000[/latex] divided by nine companies, equal to [latex]111[/latex] units each. To just pay your bills, you would have to sell almost [latex]61\%[/latex] higher than the even split and achieve a [latex]17.9\%[/latex] market share. This doesn’t seem very likely, as these other companies are already established and probably have satisfied customers of their own that would not switch to your business.
Break-Even Points Are Not Green Lights. A break-even point alone cannot tell you to do something, but it can tell you not to do something. In other words, break-even points can put up red lights, but at no point does it give you the green light. In the above scenario, your break-even of [latex]179[/latex] units put up a whole lot of red lights since it does not seem feasible to obtain. However, what if your industry sold [latex]10,000[/latex] units instead of [latex]1,000[/latex] units? Your break-even would now be a [latex]1.79\%[/latex] market share ([latex]179[/latex] units out of [latex]10,000[/latex] units), which certainly seems realistic and attainable. This does not mean “Go for it,” however. It just means that from a strictly financial point of view breaking even seems possible. Whether you can actually sell that many units depends on a whole range of factors beyond just a break-even number. For instance, if your Google ad is written poorly you might not be able to generate that many sales. The break-even analysis cannot factor in this non-quantitative variable, and for that reason it cannot offer a “go ahead.”
Try It
1) What would happen to the break-even point in each of the following situations? Would it increase, decrease, or remain the same?
a. The unit contribution margin increases.
b. The total fixed costs increase.
c. The contribution rate decreases.
Solution
a. Decrease. In Formula 4.7a[latex]\begin{align*}n=\frac{TFC}{CM}\end{align*}[/latex], the denominator is larger, producing a lower break-even.
b. Increase. In both Formula 4.7a[latex]\begin{align*}n=\frac{TFC}{CM}\end{align*}[/latex] and Formula 4.7b[latex]\begin{align*}TR=\frac{TFC}{CR}\end{align*}[/latex], the numerator is larger, producing a higher break-even.
c. Increase. In Formula 4.7b[latex]\begin{align*}TR=\frac{TFC}{CR}\end{align*}[/latex], the denominator is smaller, producing a higher break-even.
Example 4.7.2
In the annual report to shareholders, Borland Manufacturing reported total gross sales of [latex]\$7,200,000[/latex], total variable costs of [latex]\$4,320,000[/latex], and total fixed costs of [latex]\$2,500,000[/latex]. Determine Borland’s break-even point in dollars.
Solution
Step 1: Write what you know from the question.
The total fixed costs are known: [latex]TFC = \$2,500,000[/latex]. Other known information includes the following:
[latex]\begin{eqnarray*}TR&=&\$7,200,000\\TVC&=&\$4,320,000\end{eqnarray*}[/latex]
Step 2: Calculate the contribution rate by applying Formula 4.6f.[latex]\begin{align*}CR=\frac{TR-TVC}{TR}\times100\end{align*}[/latex]
[latex]\begin{eqnarray*}CR&=&\frac{\$7,200,000-\$4,320,000}{\$7,200,000}\times100\\[1ex]CR&=&\frac{\$2,880,000}{\$7,200,000}\times100\\[1ex]CR&=&40\%\end{eqnarray*}[/latex]
Step 3: Apply Formula 4.7b[latex]\begin{align*}TR=\frac{TFC}{CR}\end{align*}[/latex] and solve.
[latex]\begin{eqnarray*}TR&=&\frac{\$2,500,000}{40\%}\\[1ex]TR&=&\frac{\$2,500,000}{0.4}\\[1ex]TR&=&\$6,250,000\end{eqnarray*}[/latex]
Step 4: Write as a statement.
Borland Manufacturing achieves its break-even point at [latex]\$6,250,000[/latex] in total revenue. At this point, total fixed costs are [latex]\$2,500,000[/latex] and total variable costs are [latex]\$3,750,000[/latex], producing a net income of zero.
Section 4.7 Exercises
In each of the following questions, round all of the money and percentages to two decimals unless otherwise specified.
Mechanics
- Franklin has started an ink-jet print cartridge refill business. He has invested [latex]\$2,500[/latex] in equipment and machinery. The cost of refilling a cartridge including labor, ink, and all other materials is [latex]\$4[/latex]. He charges [latex]\$14.95[/latex] for his services. How many cartridges does he need to refill to break even?
- Hasbro manufactures a line of children’s pet toys. If it sells the toy to distributors for [latex]\$2.30[/latex] each while variable costs are [latex]75¢[/latex] toy, how many toys does it need to sell to recover the fixed cost investment in these toys of [latex]\$510,000[/latex]? What total revenue would this represent?
- You are thinking of starting your own business and want to get some measure of feasibility. You have determined that your total fixed costs would be [latex]\$79,300[/latex]. From annual business reports and competitive studies, you estimate your contribution rate to be [latex]65\%[/latex]. What is your break-even in dollars?
- If a business has total revenue of [latex]\$100,000[/latex], total variable costs of [latex]\$60,000[/latex], and total fixed costs of [latex]\$20,000[/latex], determine its break-even point in dollars.
- If the break-even point is [latex]15,000[/latex] units, the selling price is [latex]\$95[/latex], and the unit variable cost is [latex]\$75[/latex], what are the company’s total fixed costs?
- Louisa runs a secretarial business part time in the evenings. She takes dictation or handwritten minutes and converts them into printed word-processed documents. She charges [latex]\$5[/latex] per page for her services. Including labor, paper, toner, and all other supplies, her unit variable cost is [latex]\$2.50[/latex] per page. She invested [latex]\$3,000[/latex] worth of software and equipment to start her business. How many pages will she need to output to break even?
- If your organization has a contribution rate of [latex]45\%[/latex] and knows the break-even point is [latex]\$202,500[/latex], what are your organization’s total fixed costs?
- What is the unit contribution margin on a product line that has fixed costs of [latex]\$1,800,000[/latex] with a break-even point of [latex]360,000[/latex] units?
Solutions
- [latex]229[/latex]
- [latex]329,033[/latex] toys; [latex]TR = \$756,775.90[/latex]
- [latex]\$122,000[/latex]
- [latex]\$50,000[/latex]
- [latex]\$300,000[/latex]
- [latex]1,200[/latex] pages
- [latex]\$91,125[/latex]
- [latex]\$5[/latex]
Applications
- Ashley rebuilds old laptops as a home hobby business. Her variable costs are [latex]\$125[/latex] per laptop and she sells them for [latex]\$200[/latex]. She has determined that her break-even point is [latex]50[/latex] units per month. Determine her net income for a month in which she sells [latex]60[/latex] units.
- Burton Snowboards reported the following figures last week for its Custom V Rocker Snowboard:
[latex]\begin{eqnarray*}\text{Sales}&=&\$70,000\;\;\\\text{Total Fixed Costs}&=&\$19,000\;\;\\\text{Total Variable Costs}&=&\$35,000\;\;\\\text{Total Costs}&=&\$54,000\;\;\\\text{Net Income}&=&\$16,000\end{eqnarray*}[/latex]
If the above numbers represent [latex]70\%[/latex] operational capacity, express the weekly break-even point in dollars as a percentage of maximum capacity.
- Shardae is starting a deluxe candy apple business. The cost of producing one candy apple is [latex]\$4.50[/latex]. She has total fixed costs of [latex]\$5,000[/latex]. She is thinking of selling her deluxe apples for [latex]\$9.95[/latex] each.
- Determine her unit break-even point at her selling price of [latex]\$9.95[/latex].
- Shardae thinks her price might be set too high and lowers her price to [latex]\$8.95[/latex]. Determine her new break-even point.
- An advertising agency approaches Shardae and says people would be willing to pay the [latex]\$9.95[/latex] if she ran some “upscale” local ads. They would charge her [latex]\$1,000[/latex]. Determine her break-even point.
- If she wanted to maintain the same break-even units as determined in a., what would the price have to be to pay for the advertising?
- Robert is planning a wedding social for one of his close friends. Costs involve [latex]\$865[/latex] for the hall rental, [latex]\$135[/latex] for a liquor license, [latex]\$500[/latex] for the band, and refreshments and food from the caterer cost [latex]\$10[/latex] per person. If he needs to raise [latex]\$3,000[/latex] to help his friend with the costs of his wedding, what price should he charge per ticket if he thinks he can fill the social hall to its capacity of [latex]300[/latex] people?
- Boston Beer Company, the brewer of Samuel Adams, reported the following financial information to its shareholders:
[latex]\begin{eqnarray*}\text{Total Revenue}&=&\$388,600,000\\\text{Total Variable Costs}&=&\$203,080,000\;\;\\\text{Total Fixed Costs}&=&\$182,372,000\\\text{Total Costs}&=&\$385,452,000\\\text{Net Income}&=&\$3,148,000\end{eqnarray*}[/latex]
If this represented sales of [latex]2,341,000[/latex] barrels of beer, determine its break-even point in units and dollars.
- In the beverage industry, PepsiCo and The Coca-Cola Company are the two big players. The following financial information, in millions of dollars, was reported to its shareholders:
[latex]\begin{eqnarray*}\text{PepsiCo}\\\text{Total Revenue}&=&\$14.296\\\text{Total Variable Costs}&=&\$7.683\\\text{Total Fixed Costs}&=&\$6.218\\\text{Total Costs}&=&\$13.901\\\text{Net Income}&=&\$0.395\\\\\text{The Coca-Cola Company }\\\text{Total Revenue}&=&\$21.807\\\text{Total Variable Costs}&=&\$12.663\\\text{Total Fixed Costs}&=&\$8.838\\\text{Total Costs}&=&\$21.501\;\;\\\text{Net Income}&=&\$0.306\end{eqnarray*}[/latex]
Compare the break-even points in total dollars between the two companies based on these reports.
Solutions
- [latex]\$750[/latex]
- [latex]38\%[/latex]
- a. [latex]918[/latex]; b. [latex]1,124[/latex]; c. [latex]1,101[/latex]; d. [latex]\$11.04 [/latex]
- [latex]\$25[/latex]
- [latex]2,301,277[/latex] barrels; [latex]TR = \$382,006,032.77[/latex]
- PepsiCo = [latex]\$13,442,088,008.47[/latex]; The Coca-Cola Company = [latex]\$21,077,238,188.98[/latex]; PepsiCo is [latex]36.22\%[/latex] lower
Challenge, Critical Thinking, & Other Applications
- Calculate the following:
- By what percentage does the unrounded unit break-even point change if the unit contribution margin increases by [latex]1\%[/latex] while all other numbers remain the same?
- By what percentage does the unrounded unit break-even point change if total fixed costs are reduced by [latex]1\%[/latex] while all other numbers remain the same?
- What do the solutions to the above questions illustrate?
- École Van Belleghem is trying to raise funds to replace its old playground equipment with a modern, child-safe structure. The Blue Imp playground equipment company has quoted the school a cost of [latex]\$49,833[/latex] for its [latex]20m \times 15m[/latex] megastructure. To raise the funds, the school wants to sell Show ‘n’ Save books. These books retail for [latex]\$15.00[/latex] each and cost [latex]\$8.50[/latex] to purchase. How many books must the school sell to raise funds for the new playground?
- The Puzzle Company had total revenue of [latex]\$4,750,000[/latex], total fixed costs of [latex]\$1,500,000[/latex], and total variable costs of [latex]\$2,750,000[/latex]. If the company desires to earn a net income of [latex]\$1,000,000[/latex], what total sales volume is needed to achieve the goal?
- Whirlpool Corporation had annual sales of [latex]\$18.907[/latex] billion with a net income of [latex]\$0.549[/latex] billion. Total variable costs amounted to [latex]\$16.383[/latex] billion.
- Determine Whirlpool Corporation’s break-even in dollars.
- If Whirlpool Corporation managed to increase revenues by [latex]5\%[/latex] the following year while implementing cost-cutting measures that trimmed variable costs by [latex]2\%[/latex], determine the percent change in the break-even dollars.
Use the following information for questions 19 and 20:
[latex]\begin{eqnarray*}S&=&\$100\;\;\\VC&=&\$60\;\;\\TFC&=&\$250,000\end{eqnarray*}[/latex]
- Calculate the current break-even point in both units and dollars.
- A production manager is trying to control costs but is faced with the following tradeoffs under three different situations:
- Total fixed costs are reduced by [latex]15\%[/latex], but unit variable costs will rise by [latex]5\%[/latex].
- Unit variable costs are reduced by [latex]10\%[/latex], but fixed costs will rise by [latex]5\%[/latex]
- Total fixed costs are reduced by [latex]20\%[/latex], but unit variable costs will rise by [latex]10\%[/latex].
- Unit variable costs are reduced by [latex]15\%[/latex], but fixed costs will rise by [latex]15\%[/latex].
- Based strictly on break-even calculations, which course of action would you recommend she pursue?
Solutions
- a. [latex]-0.\overline{9900}\%[/latex]; b. [latex]−1\%[/latex]; c. lowering [latex]TFC[/latex] always better
- [latex]7,667[/latex] books
- [latex]\$5,937,500[/latex]
- a. [latex]\$14.795[/latex] billion; b. [latex]−30.2\%[/latex]
- [latex]n=6,250[/latex]; [latex]TR=\$625,000[/latex]
- a. [latex]n=5,744[/latex]; [latex]TR=\$574,000[/latex]; b. [latex]n=5,707[/latex]; [latex]TR=\$570,700[/latex]; c. [latex]n=5,883[/latex]; [latex]TR=\$588,300[/latex]; d. [latex]n=5,868[/latex]; [latex]TR=\$586,800[/latex]; e. Option B
THE FOLLOWING LATEX CODE IS FOR FORMULA TOOLTIP ACCESSIBILITY. NEITHER THE CODE NOR THIS MESSAGE WILL DISPLAY IN BROWSER.[latex]NI=n\left(S\right)-\left(TFC+n\left(VC\right)\right)[/latex][latex]CM=S-VC[/latex][latex]\begin{align*}n=\frac{TFC}{CM}\end{align*}[/latex][latex]\begin{align*}CR=\frac{TR-TVC}{TR}\times100\end{align*}[/latex][latex]\begin{align*}TR=\frac{TFC}{CR}\end{align*}[/latex]
Attribution
“5.2: Break-Even Analysis” from Business Math: A Step-by-Step Handbook (2021B) by J. Olivier and Lyryx Learning Inc. through a Creative Commons Attribution-NonCommercial-ShareAlike 4.0 International License unless otherwise noted.
