4.6: Cost-Revenue-Net Income Analysis
Formula & Symbols Hub
For this section you will need the following:
Symbols Used
- [latex]\times 100[/latex] = Percentage multiplier
- [latex]\%C[/latex] = Percent change
- [latex]CM[/latex] = Unit contribution margin
- [latex]CR[/latex] = Contribution rate
- [latex]n[/latex] = Level of output
- [latex]NI[/latex] = Net income
- [latex]n(CM)[/latex] = Total contribution margin
- [latex]n(S)[/latex] = Total revenue
- [latex]S[/latex] = Unit selling price
- [latex]\text{SAvg}[/latex] = Simple Average
- [latex]TR[/latex] = Total revenue
- [latex]TFC[/latex] = Total fixed costs
- [latex]TFC+n(VC)[/latex] = Total costs
- [latex]TVC[/latex] = Total variable cost
- [latex]VC[/latex] = Unit variable cost
- [latex]V_\textrm{i}[/latex] = Initial value
- [latex]V_\textrm{f}[/latex] = Final value
Formulas Used
-
Formula 2.4a – Simple Average
[latex]\begin{align*}\text{SAvg}=\frac{\sum x}{n}\end{align*}[/latex]
-
Formula 3.2a – Percent Change
[latex]\begin{align*}\%C=\frac{V_\textrm{f}-V_\textrm{i}}{V_\textrm{i}}\times 100\end{align*}[/latex]
-
Formula 4.6a – Unit Variable Cost:
[latex]\begin{eqnarray*}VC=\frac{TVC}{n}\end{eqnarray*}[/latex]
-
Formula 4.6b – Net Income Using a Total Revenue and Cost Approach
[latex]\begin{eqnarray*}NI&=&n(S)-(TFC+n(VC))\end{eqnarray*}[/latex]
-
Formula 4.6c – Unit Contribution Formula
[latex]\begin{eqnarray*}CM&=&S-VC\end{eqnarray*}[/latex]
-
Formula 4.6d – Net Income Using Total Contribution Margin Approach Formula
[latex]\begin{eqnarray*}NI&=&n(CM)-TFC\end{eqnarray*}[/latex]
-
Formula 4.6e – Contribution Rates Formula
[latex]\begin{eqnarray*}CR&=&\frac{CM}{S}\times 100\end{eqnarray*}[/latex]
-
Formula 4.6f – Contribution Rate if Aggregate Information Is Known
[latex]\begin{eqnarray*}CR&=&\frac{TR-TVC}{TR}\times 100\end{eqnarray*}[/latex]
Introduction
The end of the month is approaching, and bills are coming due. As you sit at your kitchen table trying to figure out your budget for next month, you wonder whether you will be able to afford that concert you had been planning on attending. Some of your costs remain unchanged from month to month, such as your rent, Internet service, gym membership, and insurance. Other costs tend to fluctuate with your usage, such as your utilities, cellphone bill, vehicle fuel, and the amount of money spent on recreational activities. Together, these regular and irregular costs total to next month’s costs.
Examining a few recent paycheque stubs, you calculate the average monthly net income you bring home from your hourly cashier position at Sobeys. The exact amount of each paycheque, of course, depends on how many hours you work. Besides your short-term costs, you need to start saving for next year’s tuition. Therefore, your budget needs to include regular deposits into your savings account to meet that goal. Once you have put your bills, paycheques, and goals together, you hope that your budget will balance. If there is a shortfall, you will have to miss out on those concert tickets.
Budgeting at work is no different in principle from your home budget. Businesses also need to recognize the different types of costs they incur each month, some of which remain the same and some of which fluctuate. Businesses need to pay for these costs by generating revenues, which correspond to your paycheque. As with your education goals, businesses also require profits to grow. A business needs to understand all of these numbers so it can plan its activities realistically.
This section explores the various types of costs and establishes a model relating total costs to total revenues to determine total profitability levels. You will then apply this model to see how the sale of an individual product contributes to covering costs and how each product individually contributes to overall profitability.
Types of Costs
A cost is an outlay of money required to produce, acquire, or maintain a product, which includes both physical goods and services. Costs can come in three forms:
- A fixed cost is a cost that does not change with the level of production or sales (call this “output” for short). In other words, whether the business outputs nothing or outputs [latex]10,000[/latex] units, these costs remain the same. Some examples include rent, insurance, property taxes, salaries unrelated to production (such as management), production equipment, office furniture, and much more. Total fixed costs are the sum of all fixed costs that a business incurs.
- A variable cost is a cost that changes with the level of output. In other words, if the business outputs nothing there is no variable cost. However, if the business outputs just one unit (or more) then a cost appears. Some examples include material costs of products, production labor (hourly or piecework wages), sales commissions, repairs, maintenance, and more. Total variable costs are the sum of all variable costs that a business incurs at a particular level of output.
- A blended cost is a cost that comprises both fixed cost and variable cost components. In other words, a portion of the total cost remains unchanged while another portion depends on the output. For calculation purposes, you must separate a blended cost into its fixed and variable cost components. A few examples will illustrate the concept of blended costs:
- Residential natural gas bills from Manitoba Hydro include a fixed charge per month of [latex]\$14[/latex] plus charges for cubic meters of actual consumption based on transportation, distribution, and primary and supplemental gas rates. In this situation, the [latex]\$14[/latex] is a fixed cost while the actual consumption of natural gas is a variable cost.
- A cellphone bill includes a fixed charge for the phone service plus any additional charges for usage, such as long distance, texting, or data.
- If employees are paid a salary plus commission, then their salaries represent fixed costs while their commissions are a variable cost.
[latex]\boxed{4.6\text{a}}[/latex] Unit Variable Cost
In calculating business costs, fixed costs are commonly calculated on a total basis only since the business incurs these costs regardless of any production. However, variable costs are commonly calculated both on a total and per-unit basis to reveal the overall cost along with the cost associated with any particular unit of output. When these variable costs are assigned on an individual basis it is called a unit variable cost. The calculation of unit variable cost has a further benefit because it allows managers to explore how the total business costs vary at different levels of output.
[latex]{\color{red}{VC}}\text{ is Unit Variable Cost:}[/latex] The unit variable cost is an adaptation of Formula 2.4a[latex]\begin{align*}\text{SAvg}=\frac{\sum x}{n}\end{align*}[/latex] (Simple Average) with specific definitions for the data and the quantity. The end result of the calculation is the typical or average variable cost associated with an individual unit of output. Being a dollar cost, the unit variable cost is rounded to two decimals.
[latex]{\color{blue}{TVC}}\text{ is Total Variable Cost:}[/latex] The total variable costs in dollars that were incurred at a particular level of output. In the simple average formula, this is represented by the symbol [latex]\textstyle\sum_x[/latex], which stands for the total of all pieces of data.
[latex]{\color{green}{n}}\text{ is Level of Output:}[/latex] In the simple average formula, [latex]n[/latex] represented the number of pieces of data. For this chapter, the definition is further specified to represent the total number of units produced or sold or the total output that incurred the total variable costs.
HOW TO
Calculate the unit variable cost
Step 1: Identify all fixed, variable, and blended costs, along with the level of output. For variable costs, understand any important elements of how the cost is structured. For blended costs, separate the costs into variable and fixed components.
Step 2: Calculate the total variable cost ([latex]TVC[/latex]) by totalling all variable costs at the indicated level of output. This involves taking any known unit variable costs and multiplying each by the level of output.
Step 3: Divide the total variable cost by the total level of output by applying Formula 4.6a[latex]\begin{align*}VC=\frac{TVC}{n}\end{align*}[/latex].

Assume a company produces [latex]10,000[/latex] units and wants to know its unit variable cost. It incurs production labour costs of [latex]\$3,000[/latex], material costs of [latex]\$1,875[/latex], and other variable costs totaling [latex]\$1,625[/latex].
Step 1: In this case, all costs are variable costs (production labor and material costs are always variable). The level of output is:
[latex]n\;=\;10,000\;\text{units}[/latex].
Step 2: Total all variable costs together to get:
[latex]\begin{eqnarray*}TVC\;&=&\;\$3,000\;+\;\$1,875\;+\;\$1,625\;\\TVC\;&=&\;\$6,500\end{eqnarray*}[/latex]
Step 3: Apply Formula 4.6a[latex]\begin{align*}VC=\frac{TVC}{n}\end{align*}[/latex] to arrive at:
[latex]\begin{eqnarray*}VC\;&=&\;\$6,500\;\div\;10,000\;\\VC&=&\;\$0.65\end{eqnarray*}[/latex]
This means that, on average, the variable cost associated with one unit of production is [latex]\$0.65[/latex].
Key Takeaways
The definitions of variable, fixed, and blended costs along with their typical associated examples represent a simplified view of how the real world operates. The complexities involved in real-world business costs complicate the fundamentals of managing a business. Therefore, here is how this textbook addresses the complexities of atypical operations, changing fixed costs, and decreasing unit variable costs:
- Atypical Operations. Although there are “normal” ways that businesses operate, there are also businesses that have atypical operations. What is a fixed cost to one business may be a variable cost to another.
- For example, rent is usually a fixed cost. However, some rental agreements include a fixed base cost plus a commission on the operational output. These rental agreements form blended costs. This textbook does not venture into any of these atypical costs and instead focuses on common cost categorizations.
- Changing Fixed Costs. In real-world applications, fixed costs do not remain flat at all levels of output. As output increases, fixed costs tend to move upwards in steps.
- For example, at a low level of output only one manager (on salary) may be needed. As output increases, eventually another manager needs to be hired, perhaps one for every [latex]20,000[/latex] units produced. In other words, up to [latex]20,000[/latex] units the fixed costs would be constant, but at [latex]20,001[/latex] units the fixed costs take a step upwards as another manager is added. The model presented in this textbook does not address these upward steps and treats fixed costs as a constant at all levels of output.
- Decreasing Unit Variable Costs. Production tends to realize efficiencies as the level of output rises, resulting in the unit variable cost dropping. This is commonly known as achieving economies of scale. As a consumer, you often see a similar concept in your retail shopping. If you purchase one can of soup, it may cost [latex]\$1[/latex]. However, if you purchase a bulk tray of [latex]12[/latex] cans of soup it may cost only [latex]\$9[/latex], which works out to [latex]75¢[/latex] per can. This price is lower partly because the retailer incurs lower costs, such as fewer cashiers to sell [latex]12[/latex] cans to one person than to sell one can each to [latex]12[/latex] different people. Now apply this analogy to production. Producing one can of soup costs [latex]75¢[/latex]. However, a larger production run of [latex]12[/latex] soup cans may incur a cost of only [latex]\$6[/latex] instead of [latex]\$9[/latex] because workers and machines can multitask. This means the unit variable cost would decrease by [latex]25¢[/latex] per can. However, the model in this textbook assumes that unit variable costs always remain constant at any given level of output.
Example 4.6.1
You are considering starting your own home-based Internet business. After a lot of research, you have gathered the following financial information:
|
Dell computer |
[latex]\$214.48[/latex] monthly lease payments |
|
Office furniture (desk and chair) |
[latex]\$186.67[/latex] monthly rental |
|
Shaw high-speed Internet connection |
[latex]\$166.88[/latex] per month |
|
Your wages |
[latex]\$30[/latex] per hour |
|
Utilities |
[latex]\$13[/latex]per month plus [latex]\$0.20[/latex] per hour usage |
|
Software (and ongoing upgrades) |
[latex]\$20.00[/latex] per month |
|
Business licences and permits |
[latex]\$27.00[/latex] per month |
|
Google click-through rate |
[latex]\$10.00[/latex] per month [latex]+ \$0.01[/latex]per click payable as total clicks per sale |
Generating and fulfilling sales of [latex]430[/latex] units involves [latex]80[/latex] hours of work per month. Based on industry response rates, your research also shows that to achieve your sales you require a traffic volume of [latex]34,890[/latex] Google clicks.
On a monthly basis, calculate the total fixed cost, total variable cost, and unit variable cost.
Solution
Step 1: Sort the costs into fixed and variable. Separate the components for blended costs. You can total the fixed costs to arrive at the total fixed costs, or TFC.
|
Fixed Costs |
Variable Costs |
||
|
Dell computer |
[latex]\$214.48[/latex] |
Wages |
[latex]\$30.00[/latex] per hour |
|
Office furniture |
[latex]\$186.67[/latex] |
Utilities (blended cost) |
[latex]\$0.20[/latex] per hour |
|
Shaw high-speed Internet |
[latex]\$166.88[/latex] |
Google clicks (blended cost) |
[latex]\$0.01[/latex] per click |
|
Utilities (blended cost) |
[latex]\$13.00[/latex] only |
|
|
|
Software |
[latex]\$20.00[/latex] |
|
|
|
Business licences/permits |
[latex]\$27.00[/latex] |
|
|
|
Google clicks (blended cost) |
[latex]\$10.00[/latex] only |
|
|
|
TOTAL FIXED COSTS |
[latex]TFC = \$638.03[/latex] |
TOTAL VARIABLE COSTS |
[latex]TVC[/latex] calculated in Step 2 below |
Step 2: Calculate variable costs, then total them to arrive at the total variable cost, or [latex]TVC[/latex].
[latex]\begin{eqnarray*}TVC&=&(\$30.00\times\text{hours})+(\$0.20\times\text{hours})+(\$0.01\times\text{Google clicks})\\TVC&=&(\$30.00\times{\color{red}{80}})+(\$0.20\times{\color{red}{80}})+(\$0.01\times{\color{blue}{34\text{,}890}})\\TVC&=&\$2,764.90\end{eqnarray*}[/latex]
Step 3: Apply Formula 4.6a[latex]\begin{align*}\text{VC}=\frac{\text{TVC}}{n}\end{align*}[/latex] to calculate the unit variable cost.
[latex]\begin{eqnarray*}\text{Unit Variable Cost}\;&=&\;\frac{\text{Total Variable Cost}}{\text{Level of Output}}\\[1ex]VC&=&\frac{\$2,764.90}{430}\\[1ex]VC&=&\$6.43\\\end{eqnarray*}[/latex]
Step 4: Write as a statement.
Seven components make up the fixed costs: the computer, furniture, Internet service, fixed utilities, software, licenses/permits, and the fixed Google cost, all totaling [latex]\$638.03[/latex].
Three components make up the variable costs: wages, hourly utilities, and Google clicks, totaling [latex]\$2,764.90[/latex].
The average unit variable cost is [latex]\$6.43[/latex] per unit sold.
For-Profit Business
Most businesses are “for-profit” businesses, meaning that they operate to make money. In Example 4.1.1, you figured out the total fixed costs, total variable costs, and the unit variable cost for your Internet business. However, you left unanswered one of the most important questions in business: If you sell the planned [latex]430[/latex] units, are you profitable? Is there any money left after you pay for all of those fixed and variable costs? You must also remember that [latex]430[/latex] units is just an estimate. What happens if you sell only [latex]350[/latex] units? What happens if you sell [latex]525[/latex] units? What happens if you decide to pay yourself a higher wage?
There are no guarantees in business, and the future is always uncertain. Successful business managers plan for the future and perform many “what-if” scenarios to answer questions such as those above. This section develops a model for calculating total net income based on total revenues and total costs. The model allows managers to analyze various scenarios and determine the impact on profitability.
[latex]\boxed{4.6\text{b}}[/latex] Net Income Using a Total Revenue and Cost Approach Formula
[latex]\Large\text{Net Income Using a Total Revenue & Cost Approach:}[/latex]
[latex]\Large{\color{red}{NI}}={\color{blue}{n}}({\color{green}{S}})-({\color{purple}{TFC}}+{\color{blue}{n}}({\color{Mahogany}{VC}}))[/latex]
[latex]{\color{red}{NI}}\text{ is Net Income:}[/latex] Net income is the amount of money left over after all costs are deducted from all revenues. If the number is positive, then the business is profitable. If the number is negative, then the business suffers a loss since the costs are exceeding the revenues.
Note that many companies use the terms net earnings or net profit instead of the term net income. Net income is based on a certain level of output. This model assumes that the number of units that are produced or purchased (for resale) by the company exactly matches the number of units that are output or sold by the company. Therefore, the model does not consider inventory and its associated costs.
[latex]{\color{blue}{n}}\text{ is Level of Output:}[/latex] The number of units produced or sold or the output that incurred all of the variable costs.
[latex]{\color{green}{S}}\text{ is Unit Selling Price:}[/latex] The unit selling price of the product.
[latex]\underbrace{{\color{blue}{n}}({\color{green}{S}})}\text{ is Total Revenue:}[/latex] This term in the formula calculates how much money or gross income the sale of the product at a certain output level brings into the organization. Total revenue is the entire amount of money received by a company for selling its product, calculated by multiplying the quantity sold by the selling price.
[latex]\underbrace{{\color{purple}{TFC}}+{\color{blue}{n}}({\color{Mahogany}{VC}})}\text{ is Total Costs:}[/latex] This term in the formula calculates how much money is spent to generate the revenue. Total cost is the sum of all costs for the company, including both the total fixed costs and total variable costs.
Two terms make up the costs: Total fixed costs ([latex]TFC[/latex]) are a constant since these costs do not change with the level of output; total variable costs, represented mathematically by [latex]n(VC)[/latex], are the level of output multiplied by the unit variable cost.
[latex]{\color{purple}{TFC}}\text{ is Total Fixed Costs:}[/latex] The total of all costs that are not affected by the level of output.
[latex]{\color{Mahogany}{VC}}\text{ is Unit Variable Cost:}[/latex] From Formula 4.6a[latex]\begin{align*}VC=\frac{TVC}{n}\end{align*}[/latex], this is the average variable cost associated with an individual unit of output.
HOW TO
Calculate net income using a total revenue and total income approach
Step 1: Calculate the total revenue. This requires identifying the unit selling price of the product and multiplying it by the level of sales.
Step 2: Calculate your total costs. This requires identifying and separating costs into fixed and variable components. Fixed costs are totaled to arrive at the total fixed cost. Total variable costs are either known or can be calculated through multiplying the unit variable cost by the level of output.
Step 3: Calculate the net income by applying Formula 4.6b[latex]NI=n\left(S\right)-\left(TFC+n\left(VC\right)\right)[/latex].
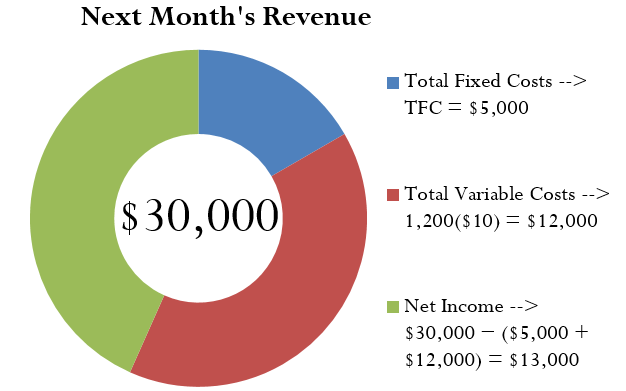
For example, assume that last month a company incurred total variable costs of [latex]\$10,000[/latex] in the course of producing [latex]1,000[/latex] units. For next month it forecasts total fixed costs of [latex]\$5,000[/latex] and all variable costs remaining unchanged. Projected production for next month is [latex]1,200[/latex] units selling for [latex]\$25[/latex] each. You want to estimate next month’s net income.
Step 1: Using Formula 4.6b[latex]NI=n\left(S\right)-\left(TFC+n\left(VC\right)\right)[/latex], you calculate total revenue from [latex]n(S)[/latex], or the total level of output multiplied by the price of the product. If you project sales of [latex]1,200[/latex] units ([latex]n[/latex]) at [latex]\$25[/latex] each ([latex]S[/latex]), then the total forecasted revenue is [latex]1,200(\$25) = \$30,000.[/latex]
Step 2: Total fixed costs, or [latex]TFC[/latex], are [latex]\$5,000[/latex]. To get the total variable costs, you must resolve [latex]n(VC)[/latex]. You calculate the unit variable cost, or [latex]VC[/latex], with Formula 4.6a[latex]\begin{align*}VC=\frac{TVC}{n}\end{align*}[/latex]. Using the current month figures, you see:
[latex]\begin{eqnarray*}VC&=&\$10,000\;\div\;1,000\;\\VC&=&\$10\end{eqnarray*}[/latex]
If the projected level of output is [latex]1,200[/latex] units, then the total variable costs are [latex]1,200(\$10) = \$12,000[/latex].
Step 3: Applying Formula 4.6b[latex]NI=n\left(S\right)-\left(TFC+n\left(VC\right)\right)[/latex] you have:
[latex]\begin{eqnarray*}NI&=&\text{Total Revenue − Total Costs}\;\\NI&=&\;\$30,000\;–\;(\$5,000\;+\;\$12,000)\;\\NI&=&\;\$13,000\end{eqnarray*}[/latex]
Based on the numbers, you forecast net income of [latex]\$13,000[/latex] for next month.
 Key Takeaway

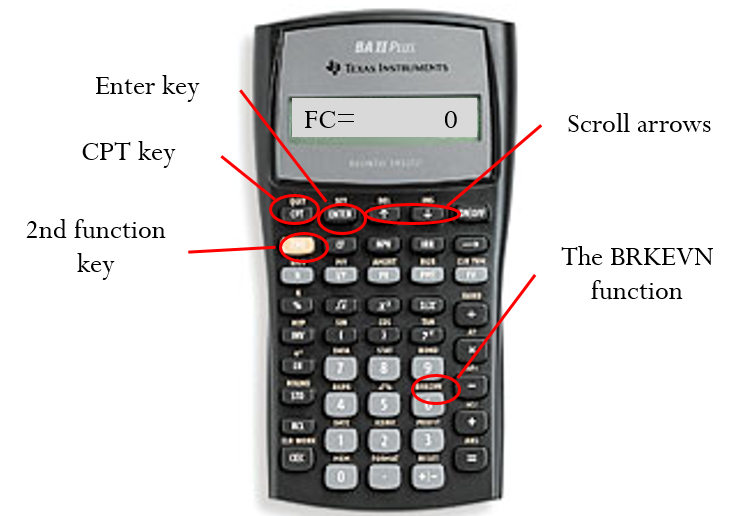
The Texas Instruments BAII Plus calculator is programmed with a version of Formula 4.6b[latex]NI=n\left(S\right)-\left(TFC+n\left(VC\right)\right)[/latex]. The function is called Brkevn, and you access it by pressing 2nd and then the number six key. The relationship between the formula symbols and the calculator symbols is displayed in the table below.
|
Variable |
Formula 4.6b Notation |
Calculator Notation |
|
Total fixed cost |
TFC |
FC |
|
Unit variable cost |
VC |
VC |
|
Price per unit |
S |
P (for price) |
|
Net income |
NI |
PFT (for profit) |
|
Level of output |
n |
Q (for quantity) |
To solve Formula 4.6b[latex]NI=n\left(S\right)-\left(TFC+n\left(VC\right)\right)[/latex] for the PFT or any other variable, enter data into all of the above variables except one. Keying in a variable requires inputting the value and pressing Enter. Use and to scroll through the display. When you are ready, scroll to the unknown variable and press CPT.
 Paths To Success
An easy way to remember Formula 4.6b[latex]NI=n\left(S\right)-\left(TFC+n\left(VC\right)\right)[/latex] is to understand what the formula represents. As explained, the calculation of [latex]n(S)[/latex] multiplies quantity by price to produce the total revenue. The [latex](TFC + n(VC))[/latex] takes the total fixed costs and adds the total variable costs (which is a function of quantity multiplied by unit variable cost) to arrive at the total cost. Therefore, Formula 4.6b[latex]NI=n\left(S\right)-\left(TFC+n\left(VC\right)\right)[/latex] expressed more simply is:
[latex]\text{Net Income}=\text{Total Revenue}-\text{Total Cost}[/latex]
Try It
1) In the following situations, explain what would happen to net income and why.
a. The selling price is raised.
b. The hourly wages of production workers are increased to match the increase in the consumer price index.
c. The level of output decreases.
d. Your insurance company lowers your insurance premiums because your company has had no claims in the past year.
Solution
- Net income increases because the total revenues increase with no similar increase in costs.
- Net income decreases because the hourly wages of production workers are variable costs.If the costs go up, then less money is left over.
- Net income decreases because both total revenueand total variable costs drop; however, the fixed costs remain the same, so there is less revenue to cover proportionally higher costs.
- Net income increases because the insurance premium is a fixed cost that has become smaller. With lower costs, more money is left over.
Example 4.6.2
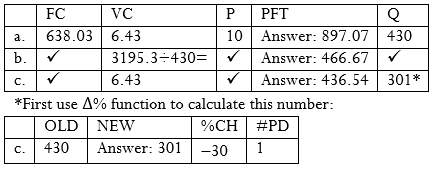
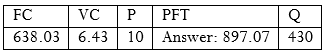
Recall from Example 4.6.1 that you are considering starting your own home-based Internet business. The following information is known:
[latex]FC = \$638.03 [/latex] [latex]VC = \$6.43[/latex] forecasted [latex]n = 430[/latex]
Based on these numbers, calculate:
- The forecasted net income if your price per unit is [latex]\$10[/latex].
- The dollar change in net income if you decide to pay yourself a higher wage of [latex]\$35.38[/latex] per hour instead of [latex]\$30.00[/latex] per hour while still working [latex]80[/latex] hours. Note the total variable costs excluding wages were [latex]\$364.90[/latex].
- The dollar change in net income if sales are [latex]30%[/latex] lower than your initial forecast, ignoring part (b) calculations.
Solution
Step 1: Write what you know from the question.
The costs, level of output, and price are known:
[latex]\begin{eqnarray*}FC&=&\$638.03\;\\VC&=&\$6.43\;\\\text{forecasted}\;n&=&430\\S&=&\$10\end{eqnarray*}[/latex]
For part b., the total variable costs excluding wages are known:
[latex]\begin{eqnarray*}TVC\;\text{(excluding wages)}&=&\$364.90\;\\\text{New wage}&=&\$35.38\;\;\\\text{Hours}&=&80\end{eqnarray*}[/latex]
For part c., the change in the level of output is known:
[latex]\%C=-30\%[/latex]
a.
Step 2: Calculate total revenue at the forecasted output.
[latex]\begin{eqnarray*}\text{Total revenue}\;&=&\;n(S\operatorname{) }\\n(S)&=&430(\$10)\;\\n(S)&=&\$4,300\end{eqnarray*}[/latex]
Step 3: Calculate total costs at the forecasted output.
[latex]\begin{eqnarray*}TFC&=&\$638.03\\TVC&=&{\color{red}{n}}({\color{blue}{VC}})\\TVC&=&{\color{red}{430}}({\color{blue}{\$6.43}})\\TVC&=&\$2\text{,}764.90\end{eqnarray*}[/latex]
Step 4: Apply Formula 4.6b[latex]NI=n\left(S\right)-\left(TFC+n\left(VC\right)\right)[/latex]
[latex]\begin{eqnarray*}NI&=&\$4,300\;–\;(\$638.03\;+\;\$2,764.90)\;\\NI&=&\$897.07\end{eqnarray*}[/latex]
b.
Step 1: Total revenue is unchanged since the output has not changed.
[latex]\text{Total Revenue}=\$4,300[/latex]
Step 2: Fixed costs are unchanged. Recalculate the total variable costs by adding the new wages to the total variable costs excluding wages. By rearranging Formula 4.6a[latex]\begin{align*}VC=\frac{TVC}{n}\end{align*}[/latex], you can see [latex]TVC = n(VC)[/latex]. Therefore, substitute [latex]TVC[/latex] in place of [latex]n(VC)[/latex] in Formula 4.6b[latex]NI=n\left(S\right)-\left(TFC+n\left(VC\right)\right)[/latex]
[latex]\begin{eqnarray*}TFC&=&\$638.03\\TVC&=&\$364.90+(\$35.38\;\times\;80\;hours)\;\\TVC&=&\$3,195.30\end{eqnarray*}[/latex]
Step 3: Apply Formula 4.6b[latex]NI=n\left(S\right)-\left(TFC+n\left(VC\right)\right)[/latex] to recalculate the new net income. Compare to net income in part a. and determine the change.
[latex]\begin{eqnarray*}NI&=&\$4,300-(\$638.03\;+\;\$3,195.30)\;\\NI&=&\$466.67\;\;\\\text{Change in}\;NI&=&\$466.67-\$897.07=-\$430.40\end{eqnarray*}[/latex]
c.
Step 1: The revised level of output is a percent change calculation where [latex]\%C=-30\%[/latex] and [latex]V_\textrm{i}=430[/latex]. Solve Formula 3.2a[latex]\begin{align*}\%C=\frac{V_\textrm{f}-V_\textrm{i}}{V_\textrm{i}}\times 100\end{align*}[/latex] (Percent Change) for [latex]V_\textrm{f}[/latex]. Once [latex]V_\textrm{f}[/latex] is known, recalculate total revenue.
[latex]\begin{eqnarray*}-30\%&=&\frac{V_\textrm{f}-430}{430}\times100\;\;\\[1ex]-129&=&V_\textrm{f}-430\;\\301&=&V_\textrm{f}\;\;\\\text{Total revenue}&=&301(\$10)\\\text{Total revenue}&=&\$3,010\end{eqnarray*}[/latex]
Step 2: Fixed costs are unchanged. Recalculate total variables costs using the revised level of output.
[latex]\begin{eqnarray*}TFC\;&=&\;\$638.03\\\\TVC&=&301(\$6.43)\\TVC&=&\$1,935.43\end{eqnarray*}[/latex]
Step 3: Apply Formula 4.6b[latex]NI=n\left(S\right)-\left(TFC+n\left(VC\right)\right)[/latex] to recalculate the new net income. Compare to net income in part a. and determine the change.
[latex]\begin{eqnarray*}NI&=&\$3,010–(\$638.03\;+\;\$1,935.43)\;\\NI&=&\$436.54\;\;\\\text{Change in}\;NI&=&\$436.54-\$897.07=-\$460.53\end{eqnarray*}[/latex]
Step 4: Write as a statement.
Under the initial scenario, a net income of [latex]\$897.07[/latex] on sales of [latex]430[/latex] units is forecast. If you pay yourself a higher wage of [latex]\$35.38[/latex] per hour, your net income decreases by [latex]\$430.40[/latex] to [latex]\$466.67[/latex]. If your forecast is inaccurate and is lower by [latex]30\%[/latex], then your net income is reduced by [latex]\$460.53[/latex], resulting in a lower net income of [latex]\$436.54[/latex].
Net Income Using a Total Contribution Margin Approach
In Example 4.6.2, you learned that if you sell the projected [latex]430[/latex] units of product for your Internet business, the total net income is [latex]\$897.07[/latex]. What if you sold [latex]431[/latex] units of the product? How would your net income change? Clearly it should rise, but by how much? One approach to answering this question is to rerun the numbers through Formula 4.6b[latex]NI=n\left(S\right)-\left(TFC+n\left(VC\right)\right)[/latex], revising the total revenues and total variable costs to calculate a new net income. This new net income can then be compared against the existing net income to determine how it changed. This is a multistep approach and involves a lot of work. An alternative approach explored in this section involves using a unit contribution margin to calculate the net income. The benefit of this approach is that with minimal calculations you can easily assess the impact of any change in the level of output.
In accounting and marketing, the contribution margin is the amount that each unit sold adds to the net income of the business. This approach allows you to understand the impact on net income of each unit sold. The contribution margin determines on a per-unit basis how much money is left over after unit variable costs are removed from the price of the product. This leftover money is then available to pay for the fixed costs. Ultimately, when all fixed costs have been paid for, the leftover money becomes the profits of the business. If not enough money is left over to pay for the fixed costs, then the business has a negative net income and loses money.
[latex]\boxed{4.6\text{c}}[/latex] Unit Contribution Formula
The difference between the increase in the total revenue and the increase in the total variable costs is how much the sale of an individual product contributes toward the change in your net income. Formula 4.6c expresses this relationship.
[latex]{\color{red}{CM}}\text{ is Unit Contribution Margin:}[/latex] This is the amount of money that remains available to pay for fixed costs once the unit variable cost is removed from the selling price of the product.
[latex]{\color{blue}{S}}\text{ is Unit Selling Price:}[/latex] The unit selling price of the product.
[latex]{\color{green}{VC}}\text{ is Unit Variable Cost:}[/latex] The typical or average variable cost associated with an individual unit of output, as determined from Formula 4.6a[latex]\begin{align*}VC=\frac{TVC}{n}\end{align*}[/latex].
If you have no units sold, your net income is negative and equal to the total fixed costs associated with your business, since there is no offsetting revenue to pay for those costs. With each unit sold, the contribution margin of each product is available to pay off the fixed costs. Formula 4.6d expresses this relationship when calculating net income.
[latex]\boxed{4.6\text{d}}[/latex] Net Income Using Total Contribution Margin Approach Formula
[latex]\Large\text{Net Income Using Total Contribution Margin Approach:}[/latex]
[latex]\Large{\color{red}{NI}}={\color{blue}{n}}({\color{green}{CM}})-{\color{purple}{TFC}}[/latex]
[latex]{\color{red}{NI}}\text{ is Net Income:}[/latex] The amount of money left over after all costs have been paid is the net income. If the number is positive, then the business is profitable. If the number is negative, then the business suffers a loss.
[latex]{\color{blue}{n}}\text{ is Level of Output:}[/latex] The number of units produced or sold or the output that incurred all of the variable costs.
[latex]{\color{green}{CM}}\text{ is Unit Contribution Margin:}[/latex] The amount of money per unit remaining after variable costs have been paid. It is available to cover fixed costs. Calculate the unit contribution margin by taking the unit selling price and subtracting the unit variable cost as per Formula 4.6c[latex]CM=S-VC[/latex].
[latex]\underbrace{{\color{blue}{n}}({\color{green}{CM}})}\text{ is Total Contribution Margin:}[/latex] This term in the formula calculates how much money is left over to pay the total fixed costs. Use the contribution margin calculated in Formula 4.6c[latex]CM=S-VC[/latex] and multiply it by the level of output to determine the total monies remaining after all variable costs are paid.
[latex]{\color{purple}{TFC}}\text{ is Total Fixed Cost:}[/latex] The total of all costs that are not affected by the level of output.
HOW TO
Calculate the net income using a contribution margin approach
Step 1: If unit information is known, apply Formula 4.6c[latex]CM=S-VC[/latex] and calculate the unit contribution margin by subtracting the unit variable cost from the selling price. This may or may not require you to use Formula 4.6a[latex]\begin{align*}VC=\frac{TVC}{n}\end{align*}[/latex] to calculate the unit variable cost.
Step 2: Calculate the total contribution margin by multiplying the contribution margin with the associated level of output.
Step 3: Calculate the total fixed costs by adding all fixed costs.
Step 4: Based on the level of output, calculate the net income by applying Formula 4.6d[latex]NI=n\left(CM\right)-TFC[/latex].
For example, using the contribution margin approach, calculate the net income for a product that sells for [latex]\$75[/latex], has unit variable costs of [latex]\$31[/latex], total fixed costs of [latex]\$23\text{,}000[/latex], and total sales of [latex]800[/latex] units.
Step 1: The unit contribution margin is calculated from Formula 4.6c[latex]CM=S-VC[/latex]. If the product sells for [latex]\$75[/latex] and has unit variable costs of [latex]\$31[/latex], then:
[latex]\begin{eqnarray*}CM&=&\$75-\$31\\CM&=&\$44\end{eqnarray*}[/latex]
This means that every unit sold has [latex]\$44[/latex] left over to contribute toward fixed costs.
Step 2: Now convert that into a total contribution margin. The first part of Formula 4.6d[latex]NI=n\left(CM\right)-TFC[/latex] calculates total contribution margin through [latex]n(CM)[/latex]. With sales of [latex]800[/latex] units, the total contribution margin is:
[latex]800(\$44)=\$35\text{,}200[/latex]
Step 3: Total fixed costs are known: [latex]TFC = \$23\text{,}000[/latex].
Step 4: Apply Formula 4.6d[latex]NI=n\left(CM\right)-TFC[/latex], which translates to:
[latex]\begin{align*}\text{Net Income}&=\text{Total Contribution Margin}-\text{Total Fixed Costs}\\\text{Net Income}&=\$35\text{,}200-\$23\text{,}000\\\text{Net Income}&=\$12\text{,}200\end{align*}[/latex]
Paths To Success
When you work with Formula 4.6d[latex]NI=n\left(CM\right)-TFC[/latex], sometimes unit information may not be known. Instead, you might just have a single aggregate number representing the total contribution margin for which somebody has already taken the total revenue and subtracted the total variable costs. In this case, skip step 1 and take the provided total contribution margin as the answer for Step 2 with no calculations necessary.
Example 4.6.3
Continuing with Example 4.6.1, calculate the unit contribution margin and net income using the contribution margin approach. From the previous examples, recall the unit variable cost is [latex]\$6.43[/latex], unit selling price is [latex]\$10[/latex], total fixed costs are [latex]\$638.03[/latex], and the projected sales are [latex]430[/latex] units.
Solution
Step 1: Write what you know from the question.
The cost, price, and sales information are known:
[latex]\begin{eqnarray*}VC&=&\$6.43\\S&=&\$10\;\;\\TFC&=&\$638.03\\n&=&430\end{eqnarray*}[/latex]
Step 2: Calculate the unit contribution margin using Formula 4.6c.[latex]CM=S-VC[/latex]
[latex]\begin{eqnarray*}CM&=&\$10.00-\$6.43\\CM&=&\$3.57\end{eqnarray*}[/latex]
Step 3: Calculate the total contribution margin by multiplying the unit contribution margin times the level of output.
[latex]\begin{eqnarray*}n(CM)&=&430(\$3.57)\\n(CM)&=&\$1,535.10\end{eqnarray*}[/latex]
Step 4: Determine the total fixed costs.
[latex]\begin{eqnarray*}TFC= $638.03\end{eqnarray*}[/latex]
Step 5: To calculate net income, apply Formula 4.6d.[latex]NI=n\left(CM\right)-TFC[/latex]
[latex]\begin{eqnarray*}NI&=&\$1,535.10-\$638.03\\NI&=&\$897.07\end{eqnarray*}[/latex]
Step 6: Write as a statement.
When a product sells for [latex]\$10[/latex], [latex]\$6.43[/latex] goes toward paying for the variable costs of your business, leaving [latex]\$3.57[/latex] as your unit contribution margin. This means that for every unit increase in sales, your net income rises by [latex]\$3.57[/latex]. Thus, if you sell [latex]430[/latex] units you have a total contribution margin of [latex]\$1,535.10[/latex], which results in a net income of [latex]\$897.07[/latex] after removing fixed costs of [latex]\$638.03[/latex].
Contribution Rates
It is difficult to compare different products and their respective dollar amount contribution margins if their selling prices and costs vary widely. For example, how do you compare a unit contribution margin of [latex]\$1,390[/latex] (selling price of [latex]\$2,599.99[/latex]) on a big screen television to a unit contribution margin of [latex]\$0.33[/latex] on a chocolate bar (selling price of [latex]\$0.67[/latex])? On a per-unit basis, which contributes relatively more to fixed costs? To facilitate these comparisons, the products must be placed on equal terms, requiring you to convert all dollar amount contribution margins into percentages. A contribution rate is a contribution margin expressed as a percentage of the selling price.
[latex]\boxed{4.6\text{e}}[/latex] Contribution Rate if Unit Information Is Known
Your choice between two formulas for calculating a contribution rate depends on whether you have unit information or only aggregate information. Both formulas are adaptations of the formula dealing with Rate, Portion, Base.
If unit information is known, including the unit variable cost and unit selling price, then calculate the contribution rate using unit information as expressed in Formula 4.6e.
[latex]\Large\text{Contribution Rate if Unit Information Is Known:}[/latex]
[latex]\Large{\color{red}{CR}}=\frac{{\color{blue}{CM}}}{\color{green}{S}}{\color{purple}{\times 100}}[/latex]
[latex]{\color{red}{CR}}\text{ is Contribution Rate:}[/latex] This represents the percentage of the unit selling price that is available to pay for all of the fixed costs of the business. When all fixed costs are paid for, this percentage is the portion of the selling price that will remain as profit. In portions, this is the rate.
[latex]{\color{blue}{CM}}\text{ is Unit Contribution:}[/latex] This is the unit dollar amount that is left over after you subtract the unit variable costs from the unit selling price of the product. In portions formula this is the portion.
[latex]{\color{green}{S}}\text{ is Unit Selling Price:}[/latex] The unit selling price of the product. In the portions formula, this is the base.
[latex]{\color{purple}{\times 100}}\text{ is Percent Conversion:}[/latex] The contribution rate is always expressed as a percentage.
If any unit information, including the unit variable cost or unit selling price, is unknown or unavailable, then you cannot apply Formula 4.6e. Sometimes only aggregate information is known. When total revenue and total variable costs for any product are known or can at least be calculated, then you must calculate the contribution rate from the aggregate information as expressed in Formula 4.6f
[latex]\boxed{4.6\text{f}}[/latex] Contribution Rate if Aggregate Information Is Known
[latex]\Large\text{Contribution Rate if Aggregate Information Is Known:}[/latex]
[latex]\Large{\color{red}{CR}}=\frac{{\color{blue}{TR}}-{\color{chocolate}{TVC}}}{{\color{blue}{TR}}}{\color{purple}{\times 100}}[/latex]
[latex]{\color{red}{CR}}\text{ is Contribution Rate:}[/latex] This represents the percentage of the unit selling price that is available to pay for all of the fixed costs of the business.
[latex]{\color{blue}{TR}}\text{ is Total Revenue:}[/latex] This is the total amount of money that the company has received from the sale of the product.
[latex]{\color{chocolate}{TVC}}\text{ is Total Variable Costs:}[/latex] This is the total cost associated with the level of output. When total variable costs are subtracted from the total revenue, the remainder represents the portion of money left over to pay the fixed costs.
[latex]{\color{purple}{\times 100}}\text{ is Percent Conversion:}[/latex] The contribution rate is always expressed as a percentage.
HOW TO
Calculate a contribution rate
Step 1: Identify the required variables and calculate the margin, if needed.
- If unit information is known, this requires you to calculate the unit contribution margin. Otherwise, calculate the unit contribution margin by applying Formula 4.6c[latex]CM=S-VC[/latex]. You must identify the unit selling price.
- If aggregate information is known, you need to identify total revenue and total variable costs.
Step 2: Calculate the contribution rate.
- If unit information is known, apply Formula 4.6e[latex]\begin{align*}CR=\frac{CM}{S}\times 100\end{align*}[/latex].
- If only aggregate information is known, apply Formula 4.6f[latex]\begin{align*}CR=\frac{TR-TVC}{TR}\times100\end{align*}[/latex].
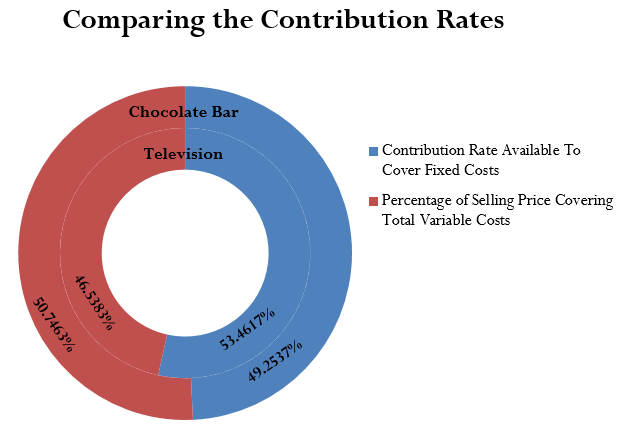
As an example of these steps, recall earlier that you wanted to compare the relative contributions of the big screen television and the chocolate bar. The television sells for [latex]\$2,599.99[/latex] and has a unit contribution margin of [latex]\$1,390[/latex]. The chocolate bar sells for [latex]\$0.67[/latex] and has a unit contribution margin of [latex]\$0.33[/latex]. Notice that the information being provided is on a per-unit basis. Calculate the contribution rate of each product.
Step 1: The contribution margins are known. For the television, [latex]CM = \$1,390[/latex], and for the chocolate bar, [latex]CM = \$0.33[/latex].
Step 2: Applying Formula 4.6e[latex]\begin{align*}CR=\frac{CM}{S}\times 100\end{align*}[/latex], the television:
[latex]CR = \$1,390.00 \div $2,599.99 \times 100 = 53.4617\%[/latex]
while the chocolate bar
[latex]CR = $0.33 \div $0.67 \times 100 = 49.2537\%[/latex]
It is now evident from the contribution rate that [latex]4.208\%[/latex] more of the television’s selling price is available to pay for fixed costs as compared to the chocolate bar’s price.
Now change the facts. This time, assume there is no unit information. Instead, the television’s total revenue is [latex]\$129,999.50[/latex] and associated total variable costs are [latex]\$60,499.50[/latex]. The chocolate bar has total revenue of [latex]\$3,886.00[/latex] with total variable costs of [latex]\$1,972.00[/latex]. Based on this information, you are to determine the product with the higher contribution rate.
Step 1: The aggregate numbers are known for both products. For the television, [latex]TR = \$129,999.50[/latex] and [latex]TVC = \$60,499.50[/latex]. For the chocolate bar, [latex]TR = \$3,886.00[/latex] and [latex]TVC = \$1,972.00[/latex].
Step 2: Applying Formula 4.6f[latex]\begin{align*}CR=\frac{TR-TVC}{TR}\times100\end{align*}[/latex], the television:
[latex]\begin{eqnarray*}CR&=&\frac{\$129,999.50-\$60,499.50}{\$129,999.50}\times100\\[1ex]CR&=&53.4617\%\end{eqnarray*}[/latex]
while the chocolate bar
[latex]\begin{eqnarray*}CR&=&\frac{\$3,886-\$1,972}{\$3,886}\times100\\[1ex]CR&=&49.2537\%\end{eqnarray*}[/latex]
You have reached the same conclusion as above.
Try It
2) In each of the following situations, what would happen to the contribution rate and why?
- The selling price is raised.
- The hourly wages of production workers are increased to match the increase in the consumer price index.
- The level of output decreases.
- Your insurance company lowers your insurance premiums because your company has had no claims in the past year.
Solution
- The contribution rate increases, since raising the price increases the unit contribution margin.
- The contribution rate decreases, since total variable costs rise, eroding some of the unit contribution margin.
- There is no effect on the contribution rate.The level of output is not a factor in calculating the contribution rate.
- There is no effect on the contribution rate since the insurance premiums are a fixed cost.Fixed costs are not a factor in calculating contribution rates.
Example 4.6.4
Continuing with your ongoing Internet business from the three previous examples, calculate the contribution rate using both the unit and aggregate methods and show how they arrive at the same number. Remember that you are selling products for [latex]\$10[/latex] each, your unit contribution margin is [latex]\$3.57[/latex], total revenue is projected at [latex]\$4,300[/latex], and total variable costs are [latex]\$2,764.90[/latex].
Solution
Step 1: Write what you know from the question.
Prices, margins, revenue, and costs are known:
[latex]\begin{eqnarray*}S&=&\$10\;\\CM&=&\$3.57\;\;\\TR&=&\$4,300\\TVC&=&\$2,764.90\end{eqnarray*}[/latex]
Step 2: Using the unit method, apply Formula 4.6e[latex]\begin{align*}CR=\frac{CM}{S}\times 100\end{align*}[/latex]
[latex]\begin{eqnarray*}CR&=&\frac{\$3.57}{\$10.00}\times100\\[1ex]CR&=&35.7\%\end{eqnarray*}[/latex]
Step 3: Using the aggregate method, apply Formula 4.6f[latex]\begin{align*}CR=\frac{TR-TVC}{TR}\times100\end{align*}[/latex]
[latex]\begin{eqnarray*}CR&=&\frac{\$4,300.00-\$2,764.90}{\$4,300.00}\times100\\[1ex]CR&=&35.7\%\end{eqnarray*}[/latex]
Step 4: Write a statement.
Under both the unit and aggregate method, your contribution rate equals [latex]35.7\%[/latex]. This means that every time you sell a [latex]\$10[/latex] product, [latex]35.7\%[/latex] of the revenue remains after recovering the cost of the product.
Putting It All Together
You have studied costs, volume, and net income in this section. So far, you have considered each of these concepts separately while you worked through the various applications. It is time to put the types of costs, unit variable cost, net income, sales, contribution margin, and contribution rate together so that you can see all of these concepts in a single scenario. Look at the following example.
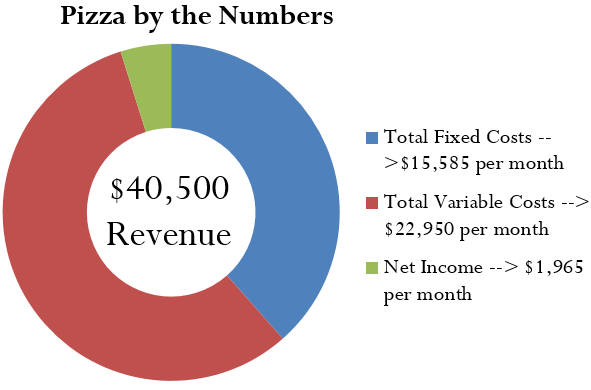
Example 4.6.5
In the commercial section of the newspaper you come across an ad for a pizza delivery business for sale. Upon inquiry, you discover that the owner, who wants to sell the business and then retire, has four salaried employees and owns two delivery vehicles. He invites you to look through his books, where you acquire the following information:
| Employees | |
|---|---|
| Owner’s salary | $5,000 per month |
| Employee salaries and premiums | $2,000 per month each |
| Business | |
| Phone | $85 per month |
| Business insurance | $3,600 per year |
| Building lease | $2,000 per month |
| Delivery Vehicles | |
| Car insurance | $1,200 per year per vehicle |
| Fuel | $1,125 per month per vehicle |
| Oil changes | $225 per month per vehicle |
| Vehicle maintenance and repairs | $562.50 per month per vehicle |
| Operations | |
| Pizza ingredients, materials, and packaging | $19,125 per month |
| Selling price of pizza | $9 per pizza |
| Average number of pizzas sold | 4,500 per month |
Assume that this is all of the key information. You need to understand this business and therefore want to determine:
a. A unit variable cost
b. A typical monthly net income for the business
c. The contribution margin per pizza
d. The contribution rate
Solution
Step 1: Write what you know from the question.
You have unit information on costs, volume, and revenue, as listed above.
a. Unit variable cost:
Step 1: Sort the costs into fixed and variable categories. Total the monthly fixed costs.
|
Fixed Costs per Month |
Variable Costs per Month |
||
|---|---|---|---|
|
Owner’s salary |
$5,000 |
Fuel |
$1,125 × 2 vehicles = $2,250 |
|
Employee salaries and premiums |
$2,000 × 4 = $8,000 |
Oil changes |
$225 × 2 vehicles =$450 |
|
Car insurance |
$1,200 × 2 cars ÷ 12 months = $200 |
Vehicle maintenance and repairs |
$562.50 × 2 vehicles = $1,125 |
|
Phone |
$85 |
Pizza ingredients, materials, and packaging |
$19,125 |
|
Business insurance |
$3,600 ÷ 12 months = $300 |
TOTAL VARIABLE COSTS |
TVC = $22,950 per month |
|
Building lease |
$2,000 |
|
|
|
TOTAL FIXED COSTS |
TFC = $15,585 per month |
|
|
Step 2: Calculate the unit variable cost by applying Formula 4.6a.[latex]\begin{align*}VC=\frac{TVC}{n}\end{align*}[/latex]
[latex]\begin{eqnarray*}VC&=&\frac{\$2,250+\$450+\$1,125+\$19,125}{4,500\;\text{pizzas }}\\[1ex]VC&=&\$5.10\;\text{per pizza}\end{eqnarray*}[/latex]
b. Net income:
Step 1: Calculate total revenue at the level of output.
[latex]\begin{eqnarray*}\text{Total Revenue}\;&=&\;4,500(\$9\operatorname{) }\\\text{Total Revenue}&=&\;\$40,500\end{eqnarray*}[/latex]
Step 2: Calculate total costs at the level of output.
[latex]\begin{eqnarray*}TFC&=&\$15,585\\\\TVC&=&4,500(\$5.10)\\TVC&=&\$22,950\end{eqnarray*}[/latex]

Step 3: Calculate monthly net income by applying Formula 4.6b.[latex]NI=n\left(S\right)-\left(TFC+n\left(VC\right)\right)[/latex]
[latex]\begin{eqnarray*}NI&=&\$40,500-(\$15,585+\$22,950)\\NI&=&\$40,500-\$38,535\;\\NI&=&\$1,965\end{eqnarray*}[/latex]
c. and d. Contribution margin and rate:
Step 1: Calculate the contribution margin by applying Formula 4.6c[latex]CM=S-VC[/latex].
[latex]\begin{eqnarray*}CM&=&\$9.00-\$5.10\;\\CM&=&\$3.90\end{eqnarray*}[/latex]
Step 2: Calculate the contribution rate by applying Formula 4.6e[latex]\begin{align*}CR=\frac{CM}{S}\times 100\end{align*}[/latex].
[latex]\begin{eqnarray*}CR&=&\frac{\$3.90}{\$9.00}\times100\\[1ex]CR&=&43.\overline3\%\end{eqnarray*}[/latex]
Step 2: Write as a statement.
This is a profitable business. For an average month, the business incurs [latex]\$15,585[/latex] in fixed costs along with [latex]\$22,950[/latex] in variable costs, which works out to a unit variable cost of [latex]\$5.10[/latex] for each of the [latex]4,500[/latex] pizzas sold. With total revenue of [latex]\$40,500[/latex], after removing both fixed and variable costs, net income is [latex]\$1,965[/latex] per month. Every pizza, after paying for the unit variable costs, has [latex]\$3.90[/latex], or [latex]43.\overline3\%[/latex], left over.
Section 4.6 Exercises
In each of the following questions, round all of the money and percentages to two decimals.
Mechanics
- Classify each of the following costs as fixed costs, variable costs, or blended costs. If a cost is blended, separate it into its fixed and variable components.
a. Natural gas bill for [latex]\$15[/latex] per month plus [latex]\$0.33/m^2[/latex].
b. A chief executive officer salary of [latex]\$240,000[/latex] per year.
c. An author earning a royalty of [latex]5\%[/latex] of sales.
d. Placing a commercial on television for [latex]\$300,000[/latex].
e. A cellphone bill for [latex]\$40[/latex] per month plus [latex]\$0.25\text{/minute for long distance}[/latex].
f. Hourly production worker wages of [latex]\$18/hr[/latex].
g. Sales staff who are compensated at a salary of [latex]\$1,000[/latex] per month plus [latex]15\%[/latex] of sales.
For questions 2–7, solve for the unknown variables (identified with a ?) based on the information provided.
|
|
Total Fixed Costs |
Total Variable Costs |
Unit Variable Cost |
Selling Price |
Total Revenue |
Level of Output |
Net Income |
Contribution Rate |
Unit Contribution Margin |
|
2. |
$5,000 |
$6,600 |
? |
$13 |
? |
? |
$4,000 |
? |
$7.50 |
|
3. |
$2,000 |
? |
$5 |
$10 |
$10,000 |
? |
? |
? |
? |
|
4. |
? |
? |
? |
$75 |
$60,000 |
? |
$14,500 |
35% |
? |
|
5. |
$18,000 |
$45,000 |
? |
? |
$84,600 |
1,800 |
? |
? |
? |
|
6. |
? |
? |
? |
? |
$78,000 |
3,000 |
$18,000 |
? |
$13 |
|
7. |
? |
$94,050 |
$75.24 |
? |
? |
? |
−$19,500 |
38% |
? |
Solutions
- a. Blended; [latex]FC = \$15[/latex], [latex]VC = \$0.33[/latex];
b. Fixed cost;
c. Variable cost;
d. Fixed cost;
e. Blended; [latex]FC = \$40[/latex]; [latex]VC = \$0.25[/latex];
f. Variable cost;
g. Blended, [latex]FC = \$1,000[/latex]; [latex]VC = 15\%[/latex] of sales - [latex]TR=\$16,000[/latex]; [latex]VC=\$5.50[/latex]; [latex]n=1,200[/latex]; [latex]CR=57.69\%[/latex]
- [latex]n=1,000[/latex]; [latex]TVC=\$5,000[/latex]; [latex]NI=\$3,000[/latex]; [latex]CR=50\%[/latex]; [latex]CM=\$5[/latex]
- [latex]n=800[/latex]; [latex]CM=\$26.25[/latex]; [latex]VC=\$48.75[/latex]; [latex]TVC=\$39,000[/latex]; [latex]TFC=\$6,500[/latex]
- [latex]VC=\$25[/latex]; [latex]S=\$47[/latex]; [latex]NI=\$21,600[/latex]; [latex]CR=46.81\%[/latex]; [latex]CM=\$22[/latex]
- [latex]S=\$26[/latex]; [latex]CR=50\%[/latex]; [latex]VC=\$13[/latex]; [latex]TVC=\$39,000[/latex]; [latex]TFC=\$21,000[/latex]
- [latex]n=1,250[/latex]; [latex]S=\$121.35[/latex]; [latex]TR=\$151,687.50[/latex]; [latex]CM=\$46.11[/latex]; [latex]TFC=\$77,137.50[/latex]
Applications
- In the current period, Blue Mountain Packers in Salmon Arm, British Columbia, had fixed costs of [latex]\$228,000[/latex] and a total cost of [latex]\$900,000[/latex] while maintaining a level of output of [latex]6,720[/latex] units. Next period sales are projected to rise by [latex]20\%[/latex]. What total cost should Blue Mountain Packers project?
- Fred runs a designer candle-making business out of his basement. He sells the candles for [latex]\$15[/latex] each, and every candle costs him [latex]\$6[/latex] to manufacture. If his fixed costs are [latex]\$2,300[/latex] per month, what is his projected net income or loss next month, for which he forecasts sales of [latex]225[/latex] units?
- A college print shop leases an industrial Xerox photo copier for [latex]\$1,500[/latex] per month plus [latex]1.5¢[/latex] for every page. Additional printing costs are estimated at [latex]2¢[/latex] per page, which covers toner, paper, labour, and all other incurred costs. If copies are made for students at [latex]10¢[/latex] each, determine the following:
- How does net income change with every [latex]100[/latex] copies sold?
- What is the monthly net income if, on average, the shop makes [latex]25,000[/latex] copies for students each month?
- Gayle is thinking of starting her own business. Total fixed costs are [latex]\$19,000[/latex] per month and unit variable costs are estimated at [latex]\$37.50[/latex]. From some preliminary studies that she completed, she forecasts sales of [latex]1,400[/latex] units at [latex]\$50[/latex] each, [latex]1,850[/latex] units at [latex]\$48[/latex] each, [latex]2,500[/latex] units at [latex]\$46[/latex] each, and [latex]2,750[/latex] units at [latex]\$44[/latex] each. What price would you recommend Gayle set for her products?
- Last year, A Child’s Place franchise had total sales of [latex]\$743,000[/latex]. If its total fixed costs were [latex]\$322,000[/latex] and net income was [latex]\$81,000[/latex], what was its contribution rate?
- What level of output would generate a net income of [latex]\$15,000[/latex] if a product sells for [latex]\$24.99[/latex], has unit variable costs of [latex]\$9.99[/latex], and total fixed costs of [latex]\$55,005[/latex]?
- In the current year, a small Holiday Inn franchise had sales of [latex]\$1,800,000[/latex], fixed costs of [latex]\$550,000[/latex], and total variable costs of [latex]\$750,000[/latex]. Next year, sales are forecast to increase by [latex]25\%[/latex] but costs will remain the same. How much will net income change (in dollars)?
Solutions
- [latex]\$1,034,400[/latex]
- [latex]−\$275[/latex]
- a. [latex]\$6.50[/latex] increase; b. [latex]\$125[/latex]
- [latex]S=\$46[/latex] (maximizes NI)
- [latex]CR=54.24\%[/latex]
- [latex]4,667[/latex]
- [latex]\$262,000[/latex] increase
Challenge, Critical Thinking, & Other Applications
- Monsanto Canada reported the following on its income statement for one of its divisions:
[latex]\begin{eqnarray*}\text{Sales}&=&\$6,000,000\;\;\\\text{Total Fixed Costs}&=&\$2,000,000\;\;\\\text{Total Variable Costs}&=&\$3,200,000\;\;\\\text{Total Costs}&=&\$5,200,000\;\;\\\text{Net Income}&=&\$800,000\end{eqnarray*}[/latex]
Calculate the total contribution margin in dollars and the contribution rate for this division.
- Procter and Gamble is budgeting for next year. For one of its brands, P&G projects it will operate at [latex]80\%[/latex] production capacity next year and forecasts the following:
[latex]\begin{eqnarray*}\text{Sales}&=&\$80,000,000\;\;\\\text{Total Fixed Costs}&=&\$20,000,000\;\;\\\text{Total Variable Costs}&=&\$50,000,000\;\;\\\text{Total Costs}&=&\$70,000,000\;\;\\\text{Net Income}&=&\$10,000,000\end{eqnarray*}[/latex]
Determine the net income if sales are higher than expected and P&G realizes [latex]90\%[/latex] production capacity.
- Through market research, a marketing manager determines that consumers are willing to pay [latex]5\%[/latex] more for the company’s product. However, some of their customers would not like this price increase, so the level of output would drop by [latex]5\%[/latex]. Should the marketing manager leave things as they are or increase the price by 5%? Justify your solution.
- Francesca is a departmental manager in the women’s wear department for The Bay. She believes that if she places her line of $100 dresses on sale at 20% off, she would see her sales rise by 75%. The contribution rate on her dresses is 50%. On a strictly financial basis, should she place the dresses on sale?
Use the following information for questions 19 and 20:
[latex]\begin{eqnarray*}TFC&=&\$3,200,000.00\;\;\\S&=&\$99.97\;\;\\TVC&=&\$5,009,440.00\;\;\\n&=&131,000\end{eqnarray*}[/latex]
- Calculate the following information: unit variable cost, total revenue, net income, unit contribution margin, total contribution margin, and contribution rate.
- Determine a new value for net income if the following situations occur:
- Fixed costs rise by [latex]10\%[/latex].
- The selling price is lowered by [latex]25\%[/latex] during a sale, resulting in [latex]50\%[/latex] more volume.
- Fixed costs are lowered by [latex]5\%[/latex], total variable costs rise by [latex]3\%[/latex], the price is lowered by [latex]5\%[/latex], and the level of output rises [latex]10\%[/latex].
Solutions
- [latex]Total CM = \$2,800,000[/latex]; [latex]CR=46.67\%[/latex]
- [latex]\$13,750,000[/latex]
- Increase price since [latex]NI[/latex] rises
- Put dresses on sale since [latex]NI[/latex] rises
- [latex]VC = \$38.24[/latex]; [latex]TR = \$13,096,070[/latex]; [latex]NI = \$4,886,630[/latex]; [latex]CM = \$61.73[/latex]; [latex]Total CM = \$8,086,630[/latex]; [latex]CR = 61.75\%[/latex]
- a. [latex]\$4,556,630[/latex]; b. [latex]\$4,019,410[/latex]; c. [latex]\$4,969,078[/latex]
THE FOLLOWING LATEX CODE IS FOR FORMULA TOOLTIP ACCESSIBILITY. NEITHER THE CODE NOR THIS MESSAGE WILL DISPLAY IN BROWSER.[latex]NI=n\left(S\right)-\left(TFC+n\left(VC\right)\right)[/latex][latex]\begin{align*}\text{SAvg}=\frac{\sum x}{n}\end{align*}[/latex][latex]NI=n\left(CM\right)-TFC[/latex][latex]\begin{align*}\%C=\frac{V_\textrm{f}-V_\textrm{i}}{V_\textrm{i}}\times 100\end{align*}[/latex][latex]\begin{align*}VC=\frac{TVC}{n}\end{align*}[/latex][latex]\begin{align*}\text{VC}=\frac{\text{TVC}}{n}\end{align*}[/latex][latex]CM=S-VC[/latex][latex]\begin{align*}CR=\frac{CM}{S}\times 100\end{align*}[/latex][latex]\begin{align*}CR=\frac{TR-TVC}{TR}\times100\end{align*}[/latex]
Attribution
“5.1: Cost-Revenue-Net-Income Analysis” from Business Math: A Step-by-Step Handbook (2021B) by J. Olivier and Lyryx Learning Inc. through a Creative Commons Attribution-NonCommercial-ShareAlike 4.0 International License unless otherwise noted.
