18.2: Researching and Supporting Your Speech
Learning Objectives
- Identify appropriate methods for conducting college-level research.
- Distinguish among various types of sources.
- Evaluate the credibility of sources.
- Identify various types of supporting material.
- Employ visual aids that enhance a speaker’s message.
Finding Supporting Material
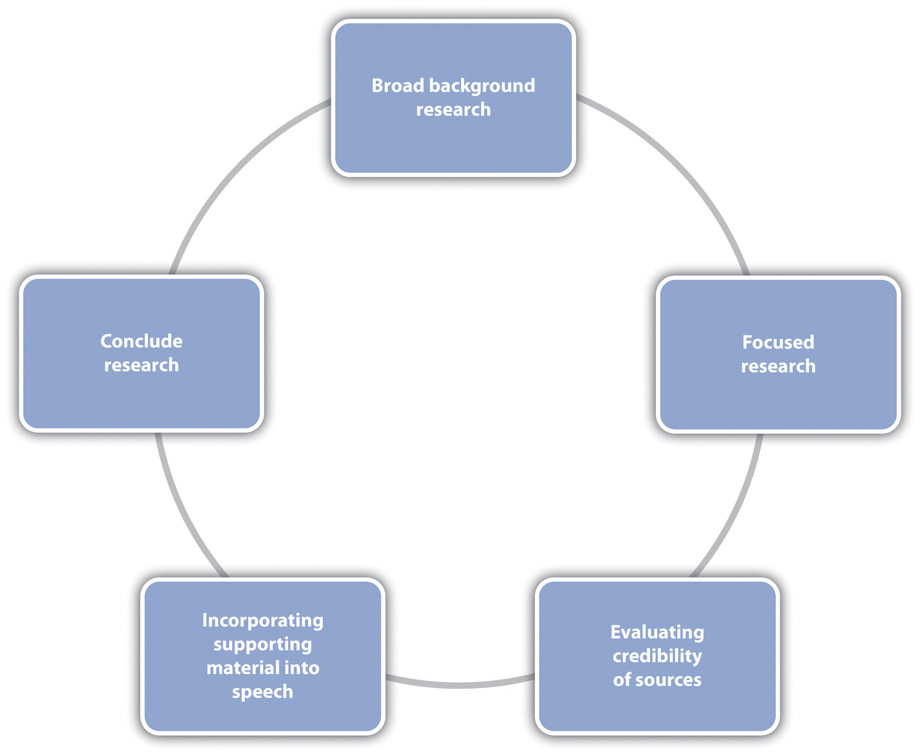
As was noted in Section 18.1 “Selecting and Narrowing a Topic”, it’s good to speak about something you are already familiar with. So existing knowledge forms the first step of your research process. Depending on how familiar you are with a topic, you will need to do more or less background research before you actually start incorporating sources to support your speech. Background research is just a review of summaries available for your topic that helps refresh or create your knowledge about the subject. It is not the more focused and academic research that you will actually use to support and verbally cite in your speech. Figure 18.2.1 “Research Process” illustrates the research process. Note that you may go through some of these steps more than once.
As discussed in previous chapters, your first step for research in college should be library resources, not Google or Bing or other general search engines. In most cases, you can still do your library research from the comfort of a computer, which makes it as accessible as Google but gives you much better results. Excellent and underutilized resources at college and university libraries are reference librarians. Reference librarians are not like the people who likely staffed your high school library. They are information-retrieval experts. At most colleges and universities, you can find a reference librarian who has at least a master’s degree in library and information sciences, and at some larger or specialized schools, reference librarians have doctoral degrees. In most cases, students who meet with reference librarians report that they came away with more information than they needed. This is great because you can then narrow that down to the best information. If you can’t meet with a reference librarian face-to-face, many schools now offer the option to do a live chat with a reference librarian, and you can also contact them by e-mail or phone.

Aside from the human resources available in the library, you can also use electronic resources such as library databases. Finally, a trip to the library to browse is especially useful for books. Since most university libraries use the Library of Congress classification system, books are organized by topic. That means if you find a good book using the online catalog and go to the library to get it, you should take a moment to look around that book, because the other books in that area will be topically related.
Carefully review the information on identifying good sources provided in previous chapters (especially in Chapters 10-12) for more information on finding and working with research sources. Also, remember that in Chapter 14 we covered the use of visuals such as graphs in research documents — a very important component to include on presentation slides for any speech or presentation.
In the following, we cover some types of material from sources that are especially useful for speeches and presentations, although they can support your argumentation in any type of research or persuasive written document, as well.
Especially Useful Materials for Presentations
The types of sources that may be relevant for your speech topic include periodicals, newspapers, books, reference tools, interviews, and websites. It is important that you evaluate the credibility of each type of source material, as discussed in previous chapters.
There are several types of supporting material that you can pull from the sources you find during the research process to add to your speech. They include examples, explanations, statistics, analogies, testimony, and visual aids. Try to have a balance of information and to include material that is most relevant to your audience and is most likely to engage them. When determining relevance, utilize some of the strategies mentioned in Section 18.1 “Selecting and Narrowing a Topic”. Consider who your audience is and what they know and would like to know as you tailor your information. Also try to incorporate proxemic information, meaning information that is geographically relevant to your audience. For example, if delivering a speech grocery store supply chain issues to a group of professionals in Ontario, citing statistics about Texas would not be as proxemic as citing information directly related to Ontario. The closer you can get the information to the audience, the better.
Examples
An example is a cited case that is representative of a larger whole. Examples are especially beneficial when presenting information that an audience may not be familiar with. They are also useful for repackaging or reviewing information that has already been presented. Examples can be used in many ways, so you should let your audience, purpose and thesis, and research materials guide your use. You may pull examples directly from your research materials, making sure to cite the source. The following is an example used in a speech about the negative effects of standardized testing: “Standardized testing makes many students anxious, and even ill. On March 14, 2002, the Sacramento Bee reported that some standardized tests now come with instructions indicating what teachers should do with a test booklet if a student throws up on it.” You may also cite examples from your personal experience, but only in more informal environments (not if a formal speech/ presentation is expected).
You may also use hypothetical examples, which can be useful when you need to provide an example that is extraordinary or goes beyond most people’s direct experience. Capitalize on this opportunity by incorporating vivid description into the example that appeals to the audience’s senses. Always make sure to indicate when you are using a hypothetical example, as it would be unethical to present an example as real when it is not. Including the word imagine or something similar in the first sentence of the example can easily do this.
Whether real or hypothetical, examples used as supporting material can be brief or extended. Brief examples are usually one or two sentences, whereas extended examples, sometimes called illustrations, are several sentences long and can be effective in introductions or conclusions to get the audience’s attention or leave a lasting impression. It is important to think about relevance and time limits when considering using an extended illustration. Since most speeches are given within time constraints, make sure the extended illustration is relevant to your speech purpose and thesis and that it doesn’t take up a disproportionate amount of the speech. If a brief example or series of brief examples would convey the same content and create the same tone as the extended example, opt for brevity.
Explanations
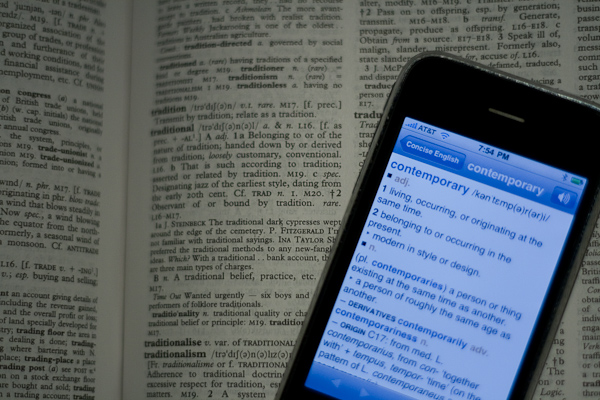
Explanations clarify ideas by providing information about what something is, why something is the way it is, or how something works or came to be. One of the most common types of explanation is a definition. Definitions do not have to come from the dictionary. Many times, authors define their concepts as they use them in their writing, which is a good alternative to a dictionary definition.
You do not need to provide definitions when information is common knowledge. Anticipate audience confusion and define legal, medical, or other forms of jargon as well as slang and foreign words. Keep in mind that repeating a definition verbatim from a dictionary often leads to fluency hiccups, because definitions are not written to be read aloud. It’s a good idea to put the definition into your own words (still remembering to cite the original source) to make it easier for you to deliver.
Other explanations focus on the “why” and “how” of a concept. We use explanations as verbal clarifications to support our claims in daily conversations, perhaps without even noticing it. Consciously incorporating clear explanations into your speech/ presentation can help you achieve your goals.
Statistics
Statistics are numerical representations of information. Most audiences find them highly credible and relevant, as evidenced by their frequent use by news agencies, government offices, politicians, and academics. Unfortunately, statistics are often misused by speakers who intentionally or unintentionally misconstrue the numbers to support their argument without examining the context from which the statistic emerged. All statistics are contextual, so plucking a number out of a news article or a research study and including it in your speech/ presentation without taking the time to understand the statistic is unethical.
Although statistics are popular as supporting evidence, they can also be boring. There will inevitably be people in your audience who are not good at processing numbers. Even people who are good with numbers have difficulty processing through a series of statistics presented orally. Remember that we have to adapt our information to listeners who don’t have the luxury of pressing a pause or rewind button. For these reasons, it’s a good idea to avoid using too many statistics and to use startling examples when you do use them. Startling statistics should defy our expectations. When you give the audience a large number that they would expect to be smaller, or vice versa, you will be more likely to engage them, as the following example shows: “Did you know that, until a decade ago, 1.3 billion people in the world did not have access to electricity? That’s about 20 percent of the world’s population according to a 2009 study on the International Energy Agency’s official website. More recent statistics show a significant improvement. For instance, …”
You should also repeat key statistics at least once for emphasis. In the previous example, the first time we hear the statistic 1.3 billion, we don’t have any context for the number. Translating that number into a percentage in the next sentence repeats the key statistic, which the audience now has context for, and repackages the information into a percentage, which some people may better understand. You should also round long numbers up or down to make them easier to speak. Make sure that rounding the number doesn’t distort its significance. Rounding 1,298,791,943 to 1.3 billion, for example, makes the statistic more manageable and doesn’t alter the basic meaning. It is also beneficial to translate numbers into something more concrete for visual or experiential learners by saying, for example, “That’s four times the population of the Unites States.” While it may seem easy to throw some numbers in your speech to add to your credibility, it takes work to make them impactful, memorable, and effective.
- Make sure you understand the context from which a statistic emerges.
- Don’t overuse statistics.
- Use startling statistics that defy the audience’s expectations.
- Repeat key statistics at least once for emphasis.
- Use a variety of numerical representations (whole numbers, percentages, ratios) to convey information.
- Round long numbers to make them easier to speak.
- Translate numbers into concrete ideas for more impact.
Analogies
Analogies involve a comparison of ideas, items, or circumstances. When you compare two things that actually exist, you are using a literal analogy—for example, “Germany and Sweden are both European countries that have had nationalized health care for decades.” Another type of literal comparison is a historical analogy. In a famous 1992 speech to the Republican National Convention, Mary Fisher compared the silence of many US political leaders regarding the HIV/AIDS crisis to that of many European leaders in the years before the Holocaust:
A figurative analogy compares things that are not normally related, often relying on metaphor, simile, or other figurative language devices. In the following example, wind and revolution are compared: “Just as the wind brings changes in the weather, so does revolution bring change to countries.”
When you compare differences, you are highlighting contrast—for example, “Although the United States is often thought of as the most medically advanced country in the world, other Western countries with nationalized health care have lower infant mortality rates and higher life expectancies.” To use analogies effectively and ethically, you must choose ideas, items, or circumstances to compare that are similar enough to warrant the analogy. The more similar the two things you’re comparing, the stronger your support. If an entire speech on nationalized health care was based on comparing the United States and Sweden, then the analogy isn’t too strong, since Sweden has approximately the same population as the state of North Carolina. Using the analogy without noting this large difference would be misrepresenting your supporting material. You could disclose the discrepancy and use other forms of supporting evidence to show that despite the population difference the two countries are similar in other areas to strengthen your speech.
Testimony
Testimony is quoted information from people with direct knowledge about a subject or situation. Expert testimony is from people who are credentialed or recognized experts in a given subject. Lay testimony is often a recounting of a person’s experiences, which is more subjective. Both types of testimony are valuable as supporting material. We can see this in the testimonies of people in courtrooms and other types of hearings. Lawyers know that juries want to hear testimony from experts, eyewitnesses, and friends and family.
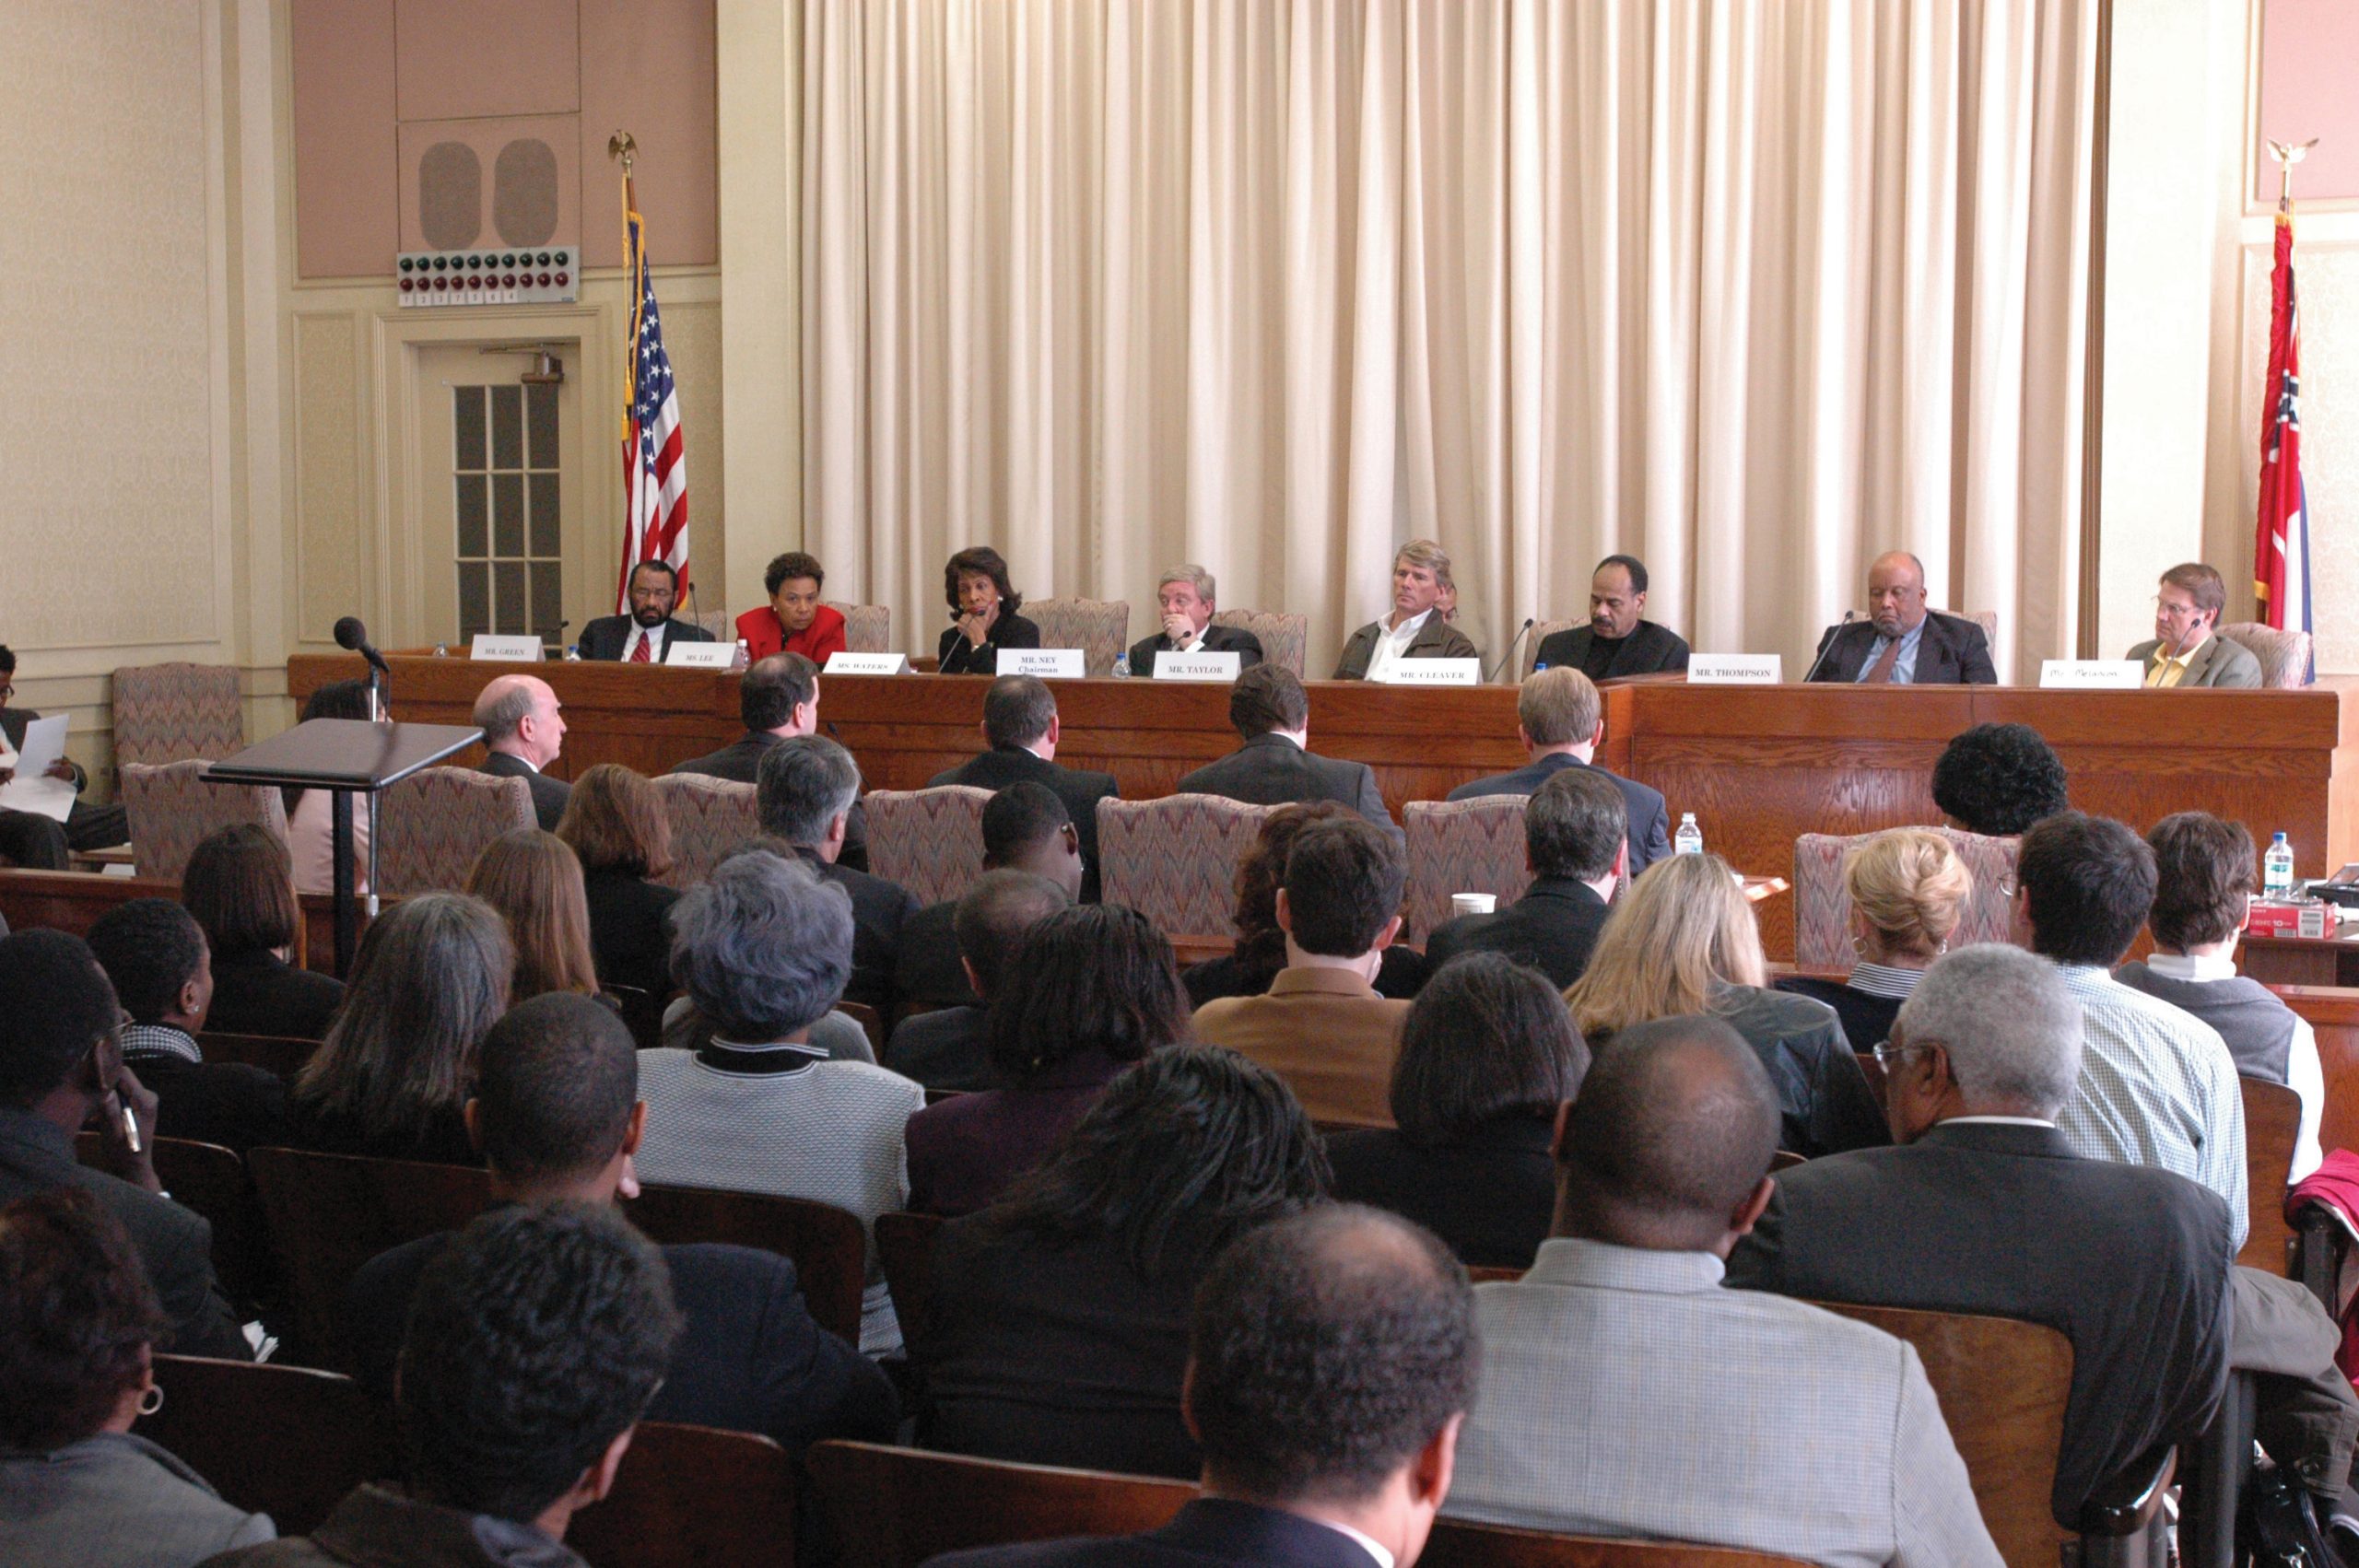
When Toyota cars were malfunctioning and being recalled in 2010, mechanics and engineers were called to testify about the technical specifications of the car (expert testimony), and car drivers like the soccer mom who recounted the brakes on her Prius suddenly failing while she was driving her kids to practice were also called (lay testimony) (see Cole, 2011 for additional details on this scandal). When using testimony, make sure you indicate whether it is expert or lay by sharing with the audience the context of the quote. Share the credentials of experts (education background, job title, years of experience, etc.) to add to your credibility or give some personal context for the lay testimony (eyewitness, personal knowledge, etc.). Include lay testimony only if fully relevant to your topic.
Visual Aids
Visual aids help a speaker reinforce speech content visually, which helps amplify the speaker’s message. They can be used to present any of the types of supporting materials discussed previously. Speakers rely heavily on an audience’s ability to learn by listening, which may not always be successful if audience members are visual or experiential learners. Even if audience members are good listeners, information overload or external or internal noise can be barriers to a speaker achieving his or her speech goals. Therefore, skillfully incorporating visual aids into a speech has many potential benefits:
- Helping your audience remember information because it is presented orally and visually
- Helping your audience understand information because it is made more digestible through diagrams, charts, and so on
- Helping your audience see something in action by demonstrating with an object, showing a video, and so on
- Engaging your audience by making your delivery more dynamic through demonstration, gesturing, and so on
There are several types of visual aids, and each has its strengths in terms of the type of information it lends itself to presenting. The types of visual aids we will discuss are objects; chalkboards, whiteboards, and flip charts; posters and handouts; pictures; diagrams; charts; graphs; videos; and presentation software. It’s important to remember that supporting materials presented on visual aids should be properly cited. We will discuss proper incorporation of supporting materials into a speech in Section 18.3 “Organizing”. While visual aids can help bring your supporting material to life, they can also add more opportunities for things to go wrong during your speech. Therefore we’ll discuss some tips for effective creation and delivery as we discuss the various types of visual aids.
 Spotlight: “Getting Competent”
Choosing the Right Supporting Material
As you sift through your research materials to find supporting material to incorporate into your speech, you should include a variety of information types. Choosing supporting material that is relevant to your audience will help make your speech more engaging. As was noted earlier, a speaker should consider the audience throughout the speech-making process. Imagine you were asked to deliver a speech about your college or university. To get some practice adapting supporting material to various audiences, provide an example of each type of supporting material that is tailored to the following specific audiences. Include an example, an explanation, a statistic, an analogy, some testimony, and a visual aid.
- Incoming first-year students
- Parents of incoming first-year students
- Alumni of the college or university
- Community members who live close to the school
Objects
Three-dimensional objects that represent an idea can be useful as a visual aid for a speech. They offer the audience a direct, concrete way to understand what you are saying. For instance, a stethoscope or another object that is defining for a profession can be used to illustrate career goals. An older and a newer phone can be used to illustrate technological development. Models also fall into this category, as they are scaled versions of objects that may be too big (the International Space Station) or too small (a molecule) to actually show to your audience.
![]() Tips for Using Objects Effectively
Tips for Using Objects Effectively
- Make sure your objects are large enough for the audience to see.
- Do not pass objects around, as it will be distracting.
- Hold your objects up long enough for the audience to see them.
- Do not talk to your object, wiggle or wave it around, tap on it, or obstruct the audience’s view of your face with it.
- Practice with your objects so your delivery will be fluent and there won’t be any surprises.
Chalkboards, Whiteboards, and Flip Charts
Chalkboards, whiteboards, and flip charts can be useful for interactive speeches. If you are polling the audience or brainstorming, you can write down audience responses easily for everyone to see and for later reference. They can also be helpful for unexpected clarification. If audience members look confused, you can take a moment to expand on a point or concept using the board or flip chart. Since many people are uncomfortable writing on these things due to handwriting or spelling issues, it’s good to anticipate things that you may have to expand on and have extra visual aids or slides that you can use if needed. You can also have audience members write things on boards or flip charts themselves, which helps get them engaged and takes some of the pressure off you as a speaker.
Posters and Handouts

Posters generally include text and graphics and often summarize an entire presentation or select main points. Posters are frequently used to present original research, as they can be broken down into the various steps to show how a process worked. Posters can be useful if you are going to have audience members circulating around the room before or after your presentation, so they can take the time to review the poster and ask questions. Posters are not often good visual aids during a speech, because it’s difficult to make the text and graphics large enough for a room full of people to adequately see. The best posters are those created using computer software and professionally printed on large laminated paper.
Handouts can be a useful alternative to posters. Think of them as miniposters that audience members can reference and take with them. Audience members will likely appreciate a handout that is limited to one page, is neatly laid out, and includes the speaker’s contact information. It can be appropriate to give handouts to an audience before a long presentation where note taking is expected, complicated information is presented, or the audience will be tested on or have to respond to the information presented. In most regular speeches less than fifteen minutes long, it would not be wise to distribute handouts ahead of time, as they will distract the audience from the speaker. It’s better to distribute the handouts after your speech or at the end of the program if there are others speaking after you.
Pictures
Photographs, paintings, drawings, and sketches fall into the pictures category of visual aids. Pictures can be useful when you need to show an exact replication of what you’re speaking about. Pictures can also connect to your audience on a personal level, especially if they evoke audience emotions. Think about the use of pictures in television commercials asking for donations or sponsorships. Organizations like Save the Children and the American Society for the Prevention of Cruelty to Animals successfully use pictures of malnourished children or abused animals to induce an emotional state in their viewers. A series of well-chosen and themed pictures can have a meaningful impact on an audience. Although some pictures can be effectively presented when printed out on standard 8 1/2″ x 11″ printer paper using a black and white printer, others will need to be enlarged and/or printed in color, which will cost some money. You can avoid this by incorporating a picture into a PowerPoint presentation, as the picture will be projected large enough for people to see. We will discuss PowerPoint in more detail later.
Diagrams and Drawings
Diagrams are good for showing the inner workings of an object or pointing out the most important or relevant parts of something. Think about diagrams as blueprints that show the inside of something—for example, key bones in the human body in a speech about common skateboarding injuries. Diagrams are good alternatives to pictures when you only need to point out certain things that may be difficult to see in a photograph.
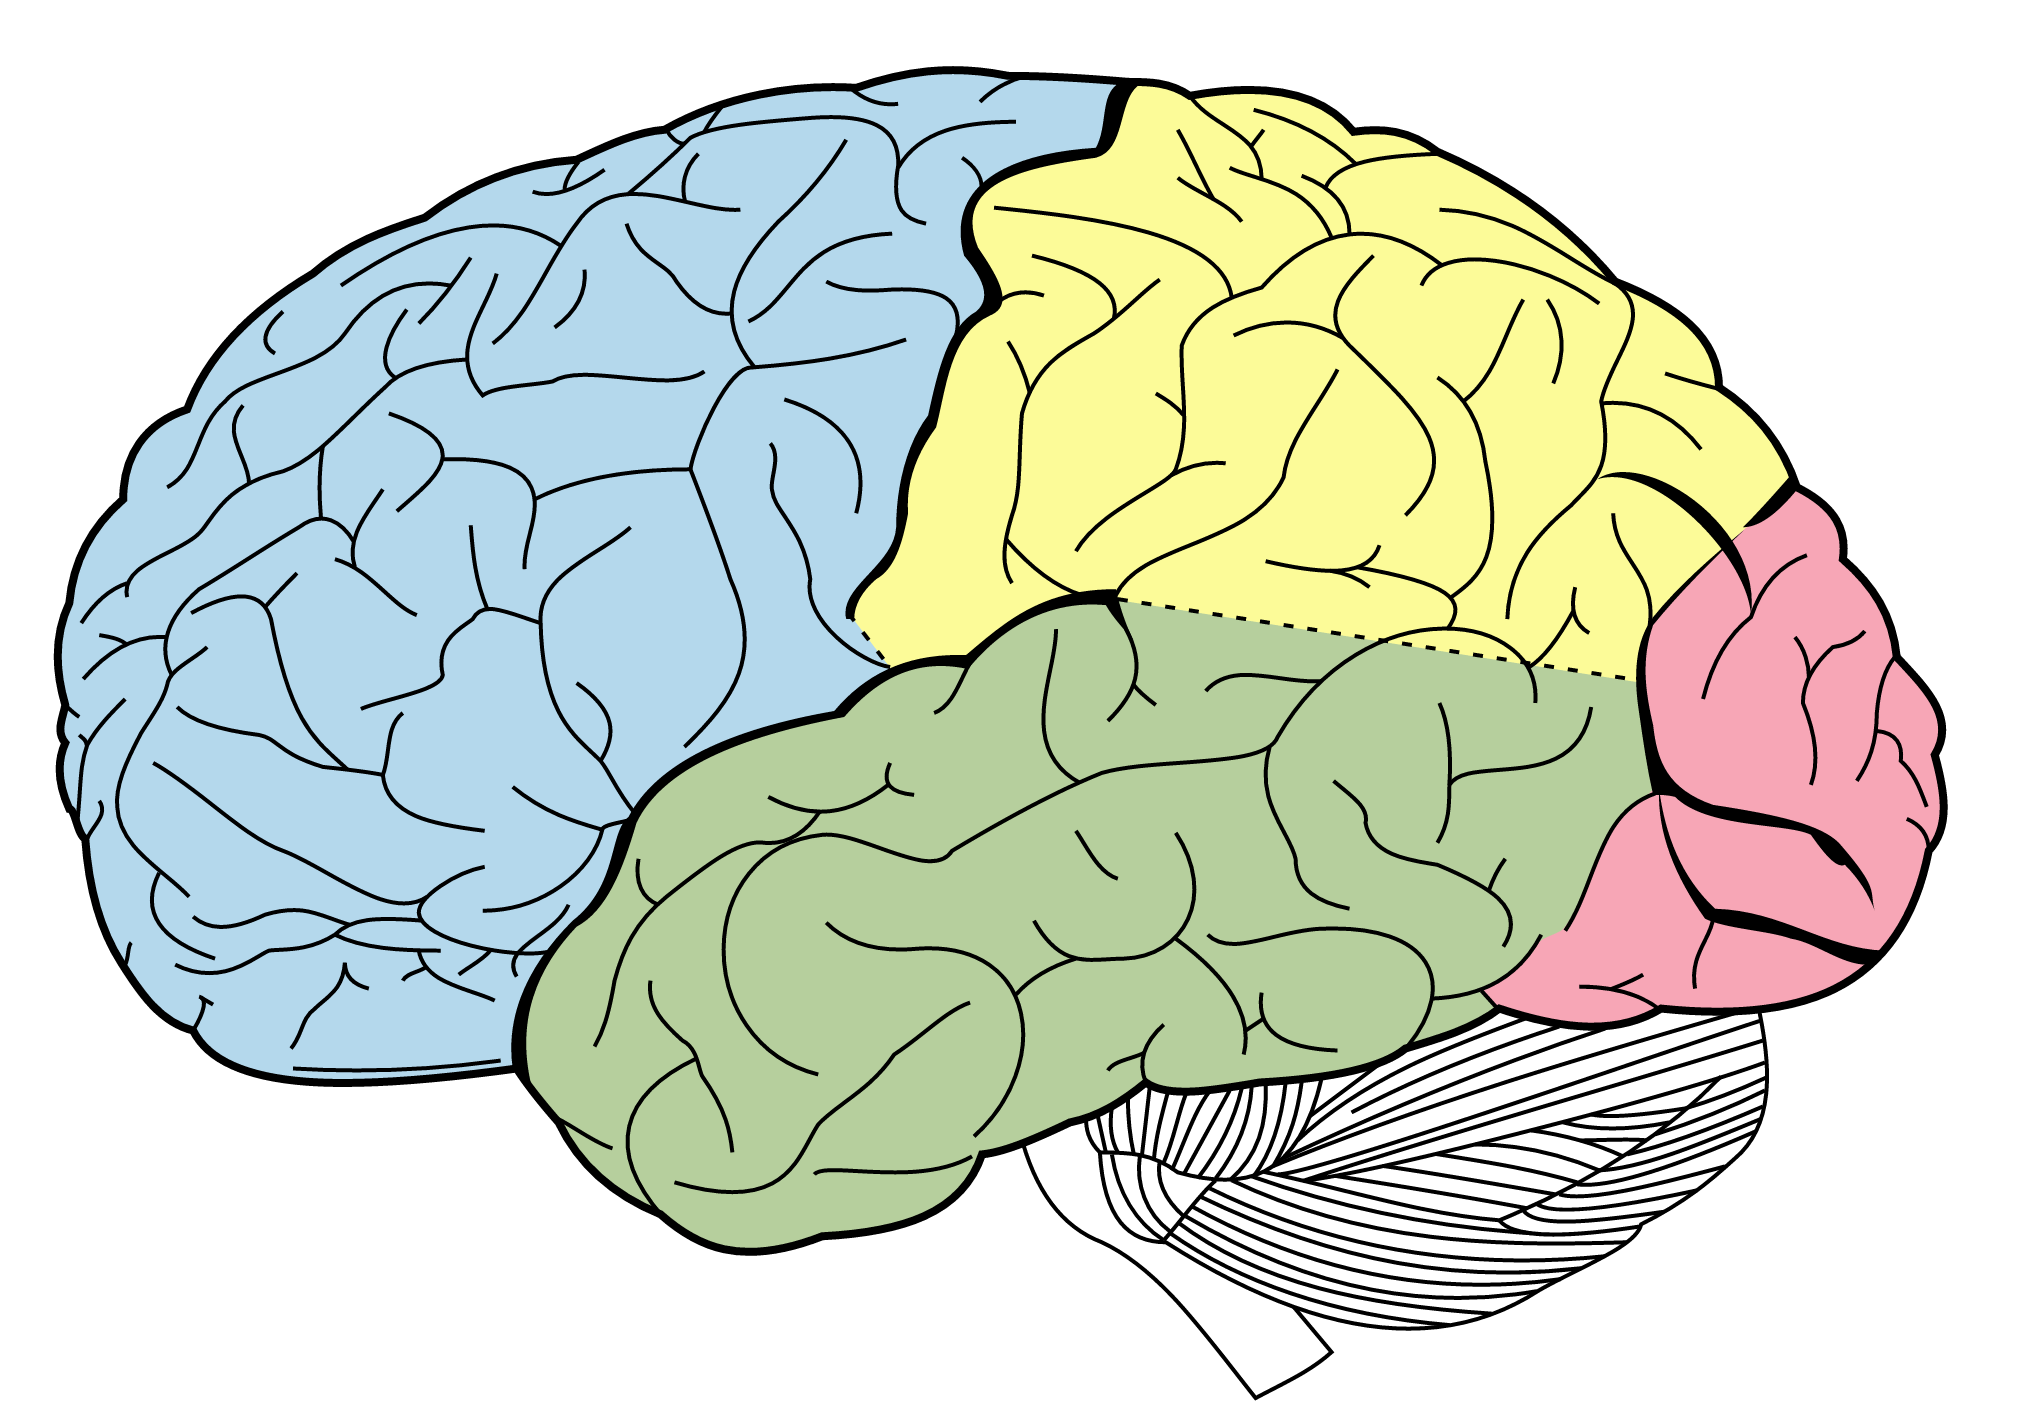
You may even be able to draw a simple diagram yourself if you find it would be useful during your speech, but it is always better to anticipate what you might need and have professionally-designed diagrams available in case certain explanations are necessary.
Charts and Tables
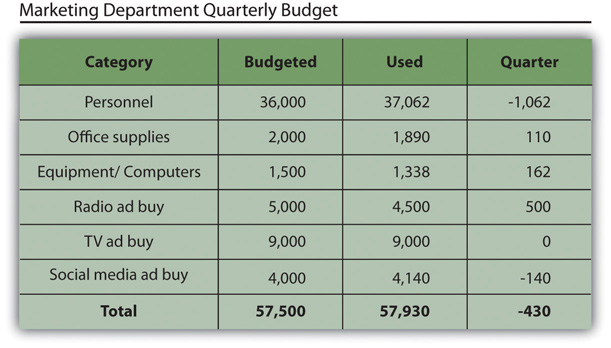
Charts and tables are useful for compiling and cross-referencing larger amounts of information. The combination of rows and columns allows you to create headers and then divide them up into units, categories, dates, and so on. Medical information is put into charts so that periods of recorded information, such as vital signs, can be updated and scanned by doctors and nurses. Charts and tables are also good for combining text and numbers, and they are easy to make with word processing software like Microsoft Word or spreadsheet software like Excel. Think of presenting your department’s budget and spending at the end of a business quarter. You could have headers in the columns with the various categories and itemized deductions in the rows ending with a final total for each column.
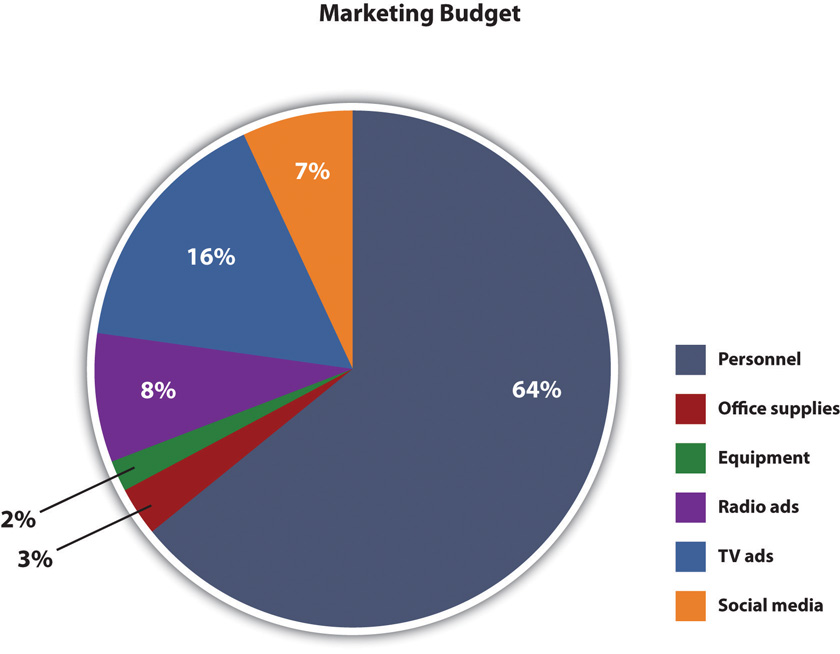
A pie chart is an alternative representation of textual and numerical data that offers audience members a visual representation of the relative proportions of a whole. In a pie chart, each piece of the pie corresponds to a percentage of the whole, and the size of the pie varies with the size of the percentage. As with other charts and tables, most office software programs now easily make pie charts.
Graphs
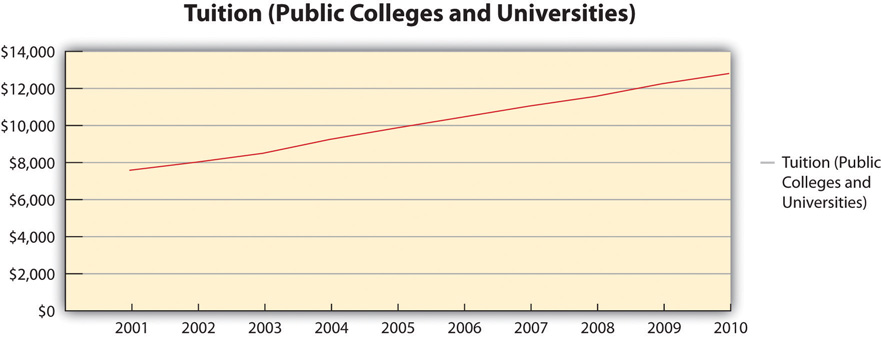
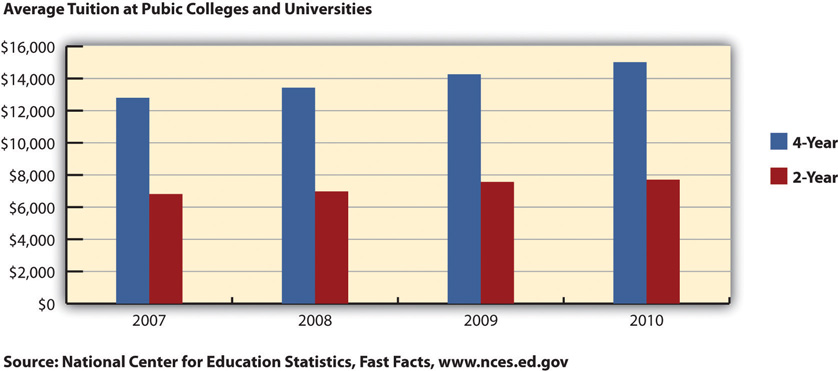
Graphs are representations that point out numerical relationships or trends and include line graphs and bar graphs. Line graphs are useful for showing trends over time. For example, you could track the rising cost of tuition for colleges and universities in a persuasive speech about the need for more merit-based financial aid.
Bar graphs are good for comparing amounts. In the same speech, you could compare the tuition of two-year institutions to that of four-year institutions. Graphs help make numerical data more digestible for your audience and allow you to convey an important numerical trend visually and quickly without having to go into lengthy explanations. Remember to always clearly label your x-axis and y-axis and to explain the basics of your graph to your audience before you go into the specific data. If you use a graph that was created by someone else, make sure it is large and clear enough for the audience to read and that you cite the original source.
Video
Video clips as visual aids can be powerful and engaging for an audience, but they can also be troublesome for speakers. Whether embedded in a PowerPoint presentation, accessed through YouTube, or played from a laptop or DVD player, video clips are notorious for tripping up speakers. They require more than one piece of electronics when they are hooked to a projector and speaker and sometimes also require an Internet connection. The more electronic connection points, the more chances for something to go wrong. Therefore, it is very important to test your technology before your speech, have a backup method of delivery if possible, and be prepared to go on without the video if all else fails. Although sometimes tempting, you should not let the video take over your speech (do not have more than 10 percent of your speech filled with video). Make sure your video is relevant and that it is cued to where it needs to be. One useful strategy for incorporating video is to play a video without audio and speak along with the video, acting as a narrator. This allows the speaker to have more control over the visual aid and to adapt it and make it more relevant to a specific topic and audience. Additionally, video editing software like Final Cut and iMovie are readily available to college students and relatively easy to use. Some simple editing to cut together various clips that are meaningful or adding an introductory title or transitions can make your video look more professional.
Presentation Software
PowerPoint is the most commonly used presentation software and has functionality ranging from the most simple text-based slide to complicated transitions, timing features, video/sound embedding, and even functionality with audience response systems like Turning Point that allow data to be collected live from audience members and incorporated quickly into the slideshow. Despite the fact that most college students have viewed and created numerous PowerPoint presentations, many are poorly executed and detract from the speaker’s message. PowerPoint should be viewed as a speech amplifier — it should support but not take over the role of the speaker.
In longer presentations like college lectures or professional conference presentations, PowerPoint slides are more content-heavy — they include many key points and include more visual aids such as pictures and graphs. The constant running of the slideshow facilitates audience note taking, which is also common during presentations. Short presentations and speeches (up to 10 minutes), on the other hand, have more repetition and redundancy built in and carry less expectation that the audience will take detailed notes. In this case, your PowerPoint should be simpler and amplify particular components of the speech rather than run along with the speaker throughout the speech and include all the details.
![]() Tips for Using PowerPoint as a Visual Aid for Short Presentations/ Speeches
Tips for Using PowerPoint as a Visual Aid for Short Presentations/ Speeches
- Do not have more than two slides per main point.
- Use a consistent theme with limited variation in font style and font size.
- Incorporate text and relevant graphics into each slide.
- Limit content to no more than six lines of text or six bullet points per slide.
- Do not use complete sentences; be concise.
- Avoid unnecessary animation or distracting slide transitions.
- Have a slide displayed only when it is relevant to what you’re discussing. Insert completely black slides to display when you are not explicitly referencing content in the speech so the audience doesn’t get distracted.
 Spotlight: “Getting Plugged In”
Alternatives to PowerPoint
Although PowerPoint is the most frequently used presentation software, there are alternatives that can also be engaging and effective if the speaker is willing to invest the time in learning something new. Keynote is Apple’s alternative to Microsoft’s PowerPoint and offers some themes and style choices that can set your presentation apart from the familiar look of PowerPoint. Keep in mind that you will need to make sure you have access to Mac-compatible presentation tools, since Keynote won’t run or open on most PCs. Prezi is a web-based presentation tool that uses Flash animation, zooming, and motion to make a very different-looking computer-generated visual aid. If you have the time to play with Prezi and create a visual aid for your presentation, you will stand out. You can see Prezi in action in Video Clip 18.2.1. You can also see sample presentations on Prezi’s website: http://prezi.com/explore.
- What are some positives and negatives of using PowerPoint as a visual aid?
- What are some other alternatives to using PowerPoint as a visual aid? Why?
Video Clip 18.2.1
Video: “James Geary, metaphorically speaking” by TED [10:45] is licensed under the Standard YouTube License.Transcript and closed captions available on YouTube.
In this video, James Geary presents on metaphor using Prezi as his visual aid.
Key Takeaways
- Library resources like databases and reference librarians are more suitable for college-level research than general search engines.
- Research sources include periodicals, newspapers and books, reference tools, interviews, and websites. The credibility of each type of supporting material should be evaluated.
- Speakers should include a variety of supporting material from their research sources in their speeches. The types of supporting material include examples, explanations, statistics, analogies, testimony, and visual aids.
- Visual aids help a speaker reinforce their content visually and have many potential benefits. Visual aids can also detract from a speech if not used properly. Visual aids include objects; chalkboards, whiteboards, and flip charts; posters and handouts; pictures; diagrams; charts; graphs; video; and presentation software.
Exercises
- Getting integrated: Identify some ways that research skills are helpful in each of the following contexts: academic, professional, personal, and civic.
- Go to the library webpage for your school. What are some resources that will be helpful for your research? Identify at least two library databases and at least one reference librarian. If you need help with research, what resources are available?
- What are some websites that you think are credible for doing graduate certificate-level research? Why? What are some website that are not credible? Why?
References
Cole, R.E. (2011, May 1). Who was really at fault for the Toyota recalls? The Atlantic, https://www.theatlantic.com/business/archive/2011/05/who-was-really-at-fault-for-the-toyota-recalls/238076/
Fisher, Mary. (1992). 1992 Republican National Convention Address. https://www.americanrhetoric.com/speeches/maryfisher1992rnc.html

