37 Life Expectancy vs. Lifespan
Lifespan or Maximum Lifespan is referred to as the greatest age reached by any member of a given population (or species). For humans, the lifespan is currently between 120 and 125. Life Expectancy is defined as the average number of years that members of a population (or species) live. According to the World Health Organization (WHO; 2016) global life expectancy at birth in 2015 was 71.4 years, with females reaching 73.8 years and males reaching 69.1 years. Women live longer than men around the world, and the gap between the sexes has remained the same since 1990. Overall life expectancy ranged from 60.0 years in the WHO African Region to 76.8 years in the WHO European Region. Global life expectancy increased by 5 years between 2000 and 2015, and the largest increase was in the WHO African Region where life expectancy increased by 9.4 years. This was due primarily to improvements in child survival and access to antiretroviral medication for the treatment of HIV. The OECD (2017) reported that in 2017 life expectancy at birth was 82.0 years in Canada and 78.6 years in the United States.
World Healthy Life Expectancy

A better way to appreciate the diversity of older people is to go beyond chronological age and examine how well the person is aging. Many older people enjoy better health and social well-being than average and would be aging at an optimal level. In contrast, others experience poor health and dependence to a greater extent than would be considered normal. When looking at large populations, the WHO (2016) measures how many equivalent years of full health on average a newborn baby is expected to have. This age takes into account current age-specific mortality, morbidity, and disability risks and is referred to as The Healthy Life Expectancy. In 2015, the global Healthy Life Expectancy was 63.1 years up from 58.5 years in 2000. The WHO African Region had the lowest Healthy Life Expectancy at 52.3 years, while the WHO Western Pacific Region had the highest at 68.7 years.
Clicking on Image 6.37.1 or the following link will bring you to an interactive map depicting life expectancy around the world. Click on countries of interest to see changes in life expectancy over time: https://ourworldindata.org/grapher/life-expectancy?tab=map
Life expectancy changes
Striking differences in life expectancy across and within different OECD nations again reveal how powerfully societies or cultures shape life for the members of those societies at any age, including when people become old. These statistics tell us more about societal differences and resources and disease over the lifetime rather than the biology of being an old person in isolation or genetic influences. OECD (2017) has analyzed the specific influences on life expectancy. This organization reported that across nations on average these factors have significant separate effects: health spending per capita, at least a minimum sufficeient income per capita, primary education, and a healthy lifestyle.
In public and private two worries often are expressed about the growing number of us who are older. One is that the larger proportion of older people to younger people will cast an outsize burden on the economy. The second is that living longer for most people will mean living longer with disabilities and activity limitations.
However, some thinkers believe that societal advances could mean that neither worry becomes a reality. In a special issue of the Institute of Medicine have proposed 5 general strategies (Rowe, 2015) as follows.
- First, we should evaluate society as a whole—not just the older parts of society and look instead at all cohorts and relationships among cohorts.
- Second, as much as possible we should set our sights on societal changes needed for the more distant future—not just the future immediately in front of us. A well-known gerontologist, Matilda Riley, noted some time ago that populations change before institutions or processes in society (the ways education, transportation, housing, health care, city design, work, and retirement are handled). She called this structural lag.
- Third, the activities of adulthood, including leisure, work, and retirement, need to be re-allocated into individual life courses, and we need to recognize that interventions designed to facilitate more satisfying or healthier journeys through adulthood will differ in effectiveness for those of different demographic backgrounds.
- Fourth, policymakers and policy students should balance attention between the “benefits and risks to an aging society” (p. 7). Substantial attention should be paid to the new bank of talent and experience offered by older people for investment in formal work and in non-paid engagement in good for the society. For example, as we discussed earlier, from experience and personal growth adults may postformal thought, which includes ability to deal with real-life problems, such as the need to forge bonds and programs that serve multiple generations.
- Fifth, policy-makers should focus on building human capitol. Meg Jay in her Ted Talk “30 is not the new 20’ talked about the importance of building identity capitol in the 20s. This strategy seeks to allow society to use as much human talent as possible no matter what the age of the person possessing the talent. Investing in human capital without regard to current social norms means providing opportunities for lifelong education.
Secondly, there also is hope and a real chance that longer life can almost be equaled by longer life quality. Ideally, as we get old, with better community support, we are able to stay relatively independent longer so that the final illness and disability resulting in death is limited to a short period. This goal is sometimes called compressed morbidity or healthy life expectancy, the term introduced above. There is mixed evidence of modest increased healthy life expectancy as well as longer life in Canada and the U.S.(Bushnik, Tjepkema, & Martel (2018), especially for males, but here and across the world, such changes so far have not resulted in general in equally compressed morbidity.
In the Blue Zones of longevity around the world this in fact is what happens. People not only live longer but they live longer with good quality of life for a long time (Buettner & Skemp, 2017). Buettner & Skemp have led attempts to implement societal changes in select U.S. cities, such as eliminating snack foods in school halls and building walking paths in prominent parts of town. In a Minnesota town, such changes were followed by increased life expectancy, decreased health care expenses, and marked weight lost.
Although writers often express concern about the changing quality of life for older Japanese, who are among the longest-lived in the world, Jenkins & Germaine (2019) recently wrote about a number of ways in which Japanese society is adapting old strategies or creating new ones that seem to be helpful for older citizens’ healthy life expectancy. They note that in the UK people spend an average of 16 to 19 years in poor health at the end of life while the estimate is 5 to 6 years in Japan. One strategy is encouraging older people to work for pay or not.
In addition to increasing healthy behaviors and thereby improving healthy life expectancy, a very active line of research (Vaiserman & Lushchak, 2017) centers on the possibility of pharmaceutical supplements that could be given to whole populations. In fact some question whether biological aging has to occur at all.
If both these worries nonetheless are fully realized, then it is still our responsibility to treat people of all ages as equal and worthy of full inclusion. Although improvements have occurred in overall life expectancy, children born in the United States today may be the first generation to have a shorter life span than their parents. Much of this decline has been attributed to the increase in sedentary lifestyle and obesity. According to the American Heart Association (2014), currently one in three American children is overweight or obese. The rate of childhood obesity tripled from 1971 to 2011, and obesity in children is associated with a range of health problems, including high blood pressure, type 2 diabetes, elevated blood cholesterol levels, and psychological concerns including low self-esteem, negative body image and depression. Excess weight is associated with an earlier risk of obesity-related diseases and death. In 2007 former Surgeon General Richard Carmona stated, “Because of the increasing rates of obesity, unhealthy eating habits and physical inactivity, we may see the first generation that will be less healthy and have a shorter life expectancy than their parents” (p. 1).
Gender Differences in Life Expectancy
Biological Explanations
Biological differences in sex chromosomes and a different pattern of gene expression is theorized as one reason why females live longer (Chmielewski, Boryslawski, & Strzelec, 2016). Males are heterogametic (XY), whereas females are homogametic (XX) with respect to the sex chromosomes. Males can only express their X chromosome genes that come from the mother, while females have an advantage by selecting the “better” X chromosome from their mother or father, while inactivating the “worse” X chromosome. This process of selection for “better” genes is impossible in males and results in the greater genetic and developmental stability of females. In terms of developmental biology, women are the “default” sex, which means that the creation of a male individual requires a sequence of events at a molecular level. According to Chmilewski et al. (2016):
These events are initiated by the activity of the SRY gene located on the Y chromosome. This activity and change in the direction of development results in a greater number of disturbances and developmental disorders, because the normal course of development requires many different factors and mechanisms, each of which must work properly and at a specific stage of the development. (p. 134)
Men are more likely to contract viral and bacterial infections, and their immunity at the cellular level decreases significantly faster with age. Although women are slightly more prone to autoimmune and inflammatory diseases, such as rheumatoid arthritis, the gradual deterioration of the immune system is slower in women (Caruso, Accardi, Virruso, & Candore, 2013; Hirokawa et al., 2013).
Looking at the influence of hormones, estrogen levels in women appear to have a protective effect on their heart and circulatory systems (Viña, Borrás, Gambini, Sastre, & Pallardó, 2005). Estrogens also have antioxidant properties that protect against harmful effects of free radicals, which damage cell components, cause mutations, and are in part responsible for the aging process. Testosterone levels are higher in men than in women, and are related to more frequent cardiovascular and immune disorders. The level of testosterone is also responsible, in part, for male behavioral patterns, including increased level of aggression and violence (Martin, Poon, & Hagberg, 2011; Borysławski & Chmielewski, 2012). Another factor responsible for risky behavior is the frontal lobe of the brain. The frontal lobe, which controls judgment and consideration of an action’s consequences, develops more slowly in boys and young men. This lack of judgment affects lifestyle choices, and consequently many more boys and men die by smoking, excessive drinking, accidents, drunk driving, and violence (Shmerling, 2016).
Lifestyle Factors
Certainly not all the reasons women live longer than men are biological. As previously mentioned, male behavioral patterns and lifestyle play a significant role in the shorter lifespans for males. One significant factor is that males work in more dangerous jobs, including police, fire fighters, and construction, and they are more exposed to violence. According to the Federal Bureau of Investigation (2014) there were 11,961 homicides in the U.S. in 2014 (last year for full data) and of those 77% were males. Males are also more than three times as likely to commit suicide (CDC, 2016a). Further, males serve in the military in much larger numbers than females. According to the Department of Defense (2015), in 2014 83% of all officers in the Services(Navy, Army, Marine Corps and Air Force) were male, while 85% of all enlisted service members were male.
Additionally, men are less likely than women to have health insurance if in the US, to develop a regular relationship with a doctor, or to seek treatment for a medical condition (Scott, 2015). As mentioned in the middle adulthood chapter, women are more religious than men, which is associated with healthier behaviors (Greenfield, Vaillant & Marks, 2009). Lastly, social contact is also important as loneliness is considered a health hazard. Nearly 20% of men over 50 have contact with their friends less than once a month, compared to only 12% of women who see friends that infrequently (Scott, 2015). Overall, men’s lower life expectancy appears to be due to both biological and lifestyle factors.
Age Categories for Older People
There have been many ways to categorize those who are older. In this chapter, we will be dividing the stage into three categories: Young–old (65-84), oldest-old (85-99), and centenarians (100+) for comparison. These categories are based on the conceptions of aging including, biological, psychological, social, and chronological differences. They also reflect the increase in longevity of those living to this latter stage, but nonetheless the use of these categories in and of itself may perpetuate ageism, as categorization disrupts our perception of the continuity of development.
Young-old
When we’re between the ages of 65 and 84 we fall in the young-old category (Ortman et al., 2014). This time-period has also been identified by Laslett (1989) as the “third age” because it follows childhood (the first age) and work and parenting (the second age). According to Barnes (2011a), this age category spans the post-employment years for many people until approximately 80-85 years when age-related limitations typically begin to occur for current and recent cohorts in the areas of physical, emotional, and cognitive development. Generally, this age span includes many positive aspects and is considered the “golden years” of adulthood. Why so positive?
Individuals at this age often have fewer responsibilities than in previous stages, and when combined with adequate finances and good health, they can pursue leisure and self-fulfillment opportunities. It is also an unusual age in that people are considered both in old age and not in old age (Rubinstein, 2002).
When compared to those above 85 (known as the fourth age), the young-old experience relatively good health and social engagement (Smith, 2000), knowledge and expertise (Singer, Verhaeghen, Ghisletta, Lindenberger, & Baltes, 2003), and adaptive flexibility in daily living (Riediger, Freund, & Baltes, 2005). The young-old also show strong performance in attention, memory, and crystallized intelligence. In fact, those identified as young-old are more similar to those in midlife than those who are 85 and older. This group is less likely to require long-term care, to be dependent or poor, and more likely to be married, working for pleasure rather than income, and living independently. Chronic diseases, such as cardiovascular disease, hypertension, and cancer, are among the most common (especially later in this period), but because they are linked to lifestyle choices, they typically can be can prevented, lessened, or managed (Barnes, 2011b). Overall, those in this age period feel a sense of happiness and emotional well-being that is better than at any other period of adulthood (Carstensen, Fung, & Charles, 2003; George, 2009; Robins & Trzesniewski, 2005).
Oldest-old
This age group is sometimes called the “fourth-age” and often includes people who have more serious chronic ailments among the older adult population. In the U.S., the oldest-old represented 14% of the older adult population in 2015 (He, Goodkind, & Kowal, 2016). This age group is one of the fastest growing worldwide and is projected to increase more than 300% over its current levels (NIA, 2015b). The oldest-old are projected to be nearly 18 million by 2050, or about 4.5% of the U. S. population, compared with less than 2% of the population today. Females comprise more than 60% of those 85 and older, but they also suffer from more chronic illnesses and disabilities than older males (Gatz et al., 2016).
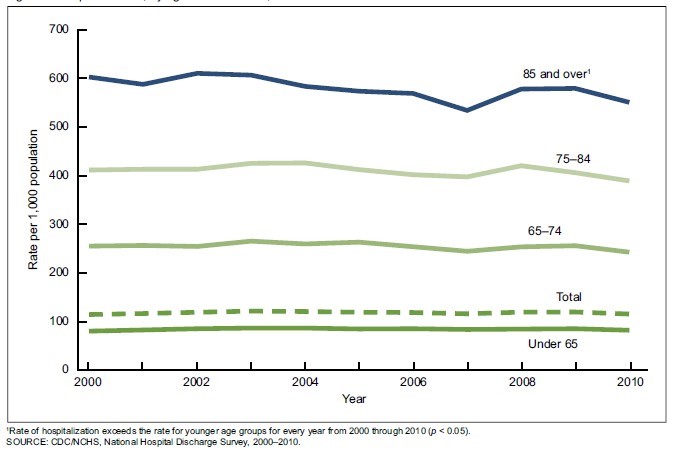
While this age group accounts for only 2% of the U. S. population, it accounts for 9% of all hospitalizations (Levant, Chari & DeFrances, 2015). Those 85 and up are less likely to be discharged and more likely to die in hospital. The most common reasons for hospitalization for the oldest-old were congestive heart failure, pneumonia, urinary tract infections, septicemia, stroke, and hip fractures. In recent years, hospitalizations for many of these medical problems have been reduced. However, hospitalization for urinary tract infections and septicemia has increased for those 85 and older.
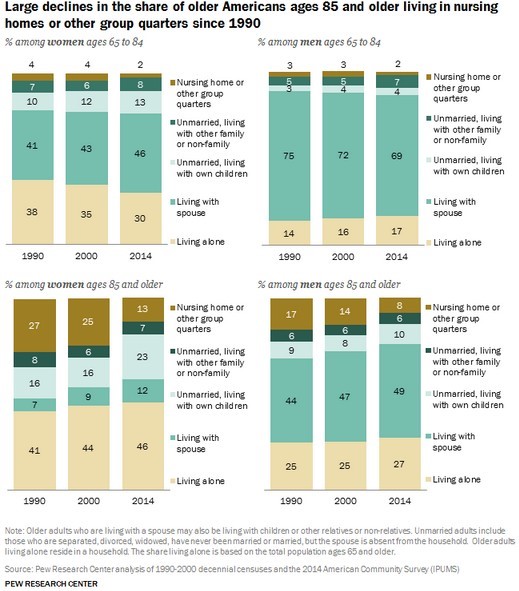
Those 85 and older are more likely to require long-term care and to be in nursing homes than the youngest-old. Almost 50% of the oldest-old require some assistance with daily living activities (APA, 2016). However, most still live in the community rather than a nursing home, as shown in Image 6.37.4 (Stepler, 2016b). The oldest-old are less likely to be married and living with a spouse compared with the majority of the young-old (APA, 2016; Stepler, 2016c). As can be seen, in Image 6.37.4, gender is also an important factor in the likelihood of being married or living with one’s spouse.

Centenarians: A segment of the oldest-old are centenarians, that is, 100 and older, and some are also referred to as supercentarians, those 110 and older (Wilcox, Wilcox & Ferrucci, 2008). In 2015 there were nearly half a million centenarians worldwide, and it is estimated that this age group will grow to almost 3.7 million by 2050. The U. S. has the most centenarians, but Japan and Italy have the most per capita (Stepler, 2016e). Most centenarians tended to be healthier than many of their peers as they were growing older, and often there was a delay in the onset of any serious disease or disability until their 90s. Additionally, 25% reached 100 with no serious chronic illnesses, such as depression, osteoporosis, heart disease, respiratory illness, or dementia (Ash et al. 2015). Centenarians are more likely to experience a rapid terminal decline in later life, meaning that for most of their adulthood, and even older adult years, they are relatively healthy in comparison to many other older adults (Ash et al., 2015; Wilcox et al., 2008). According to Guinness World Records (2016), Jeanne Louise Calment has been documented to be the longest living person at 122 years and 164 days old (See Image 6.37.5).
Media Attributions
- 086-LifeExpectancyWorldwide
- 99-OlderAsianMen(httpswww.piqsels.comenpublic-domain-photo-otiox) is licensed under a CC0 (Creative Commons Zero) license
- 087-Hospitalizations
- 088-NursingHomeLiving
- 089-JeanneLouiseCalment122yo is licensed under a All Rights Reserved license
