10 Lab 5 – Spectroscopy
liyuchon
Acknowledgment
This project is made possible with funding by the Government of Ontario and through eCampusOntario’s support of the Virtual Learning Strategy. To learn more about the Virtual Learning Strategy visit: https://vls.ecampusontario.ca.
PHY137 Stay-At-home Experiment 5
Spectroscopy
What you will do
Use a prism and a diffraction grating to observe the spectra of various light sources
What you will need
- A prism
- A diffraction grating
- A green LED, a red LED, and an incandescent light bulb
- A lens with a focal length shorter than 10cm
- Battery pack and alligator wires
- A non-transparent cardboard box with at least one dimension between 10~20 cm
- A lamp or some other bright object that is not the sun
- Some tape
Demonstration Video: https://youtu.be/pZLZn6rVJgA
Procedures
1- Hold the prism close to (but not immediately next to) the camera of your phone. Point your camera to a light source. Adjust the orientation of the prism so that in the same photo, you can see the same light source twice: once directly by the camera, another one indirectly through the refractions of the prism. (An example is attached below. If you have difficulty finding the orientation, recall how light is refracted by a prism.)
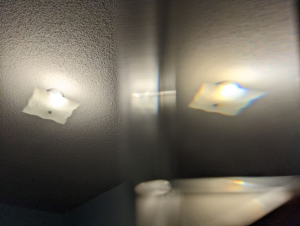
2- Notice that in your photo, the object seen through the prism has two colored edges, one red and one blue (i.e., “dispersion”). Draw a light ray diagram and determine which color has the higher refractive index through the prism. Note that our eyes were seeing a virtual image of the object through the prism.
3- Hold the diffraction grating directly next to the camera of your phone. Point your phone to the same light source that you looked at in Step 1. Take a photo of the same light source through the grating. You should see the diffracted spectral bands on both sides of the light source. (If not, try rotating the grating or finding a smaller light source.)
Part I – Prism-based Spectroscope
4- Pick two opposing surfaces on your box that are between 10~20 cm apart. Use a knife or a pair of scissors to cut open a small 3cm x 3cm window near the bottom edge on one of the surfaces. Then on the opposite surface at approximately the same location, cut open a 3mm x 4cm narrow vertical slit. (You can simply reuse the box from the previous lab.)
5- Tape the lens to the window of the box (if you bought the experimental kit, you should tape the thicker lens to the box). Try not to let the tape cover too much area of the lens. Place a prism in front of the lens so that the light from the slit will be first focused by the lens then refracted twice by the prism. Now you have a prism-based spectroscope.
6- Fix a green LED, a red LED, and an incandescent light bulb together into the slit of the box. Tape them if they are not secure. Connect the three lights to the batteries in parallel. (Tip: you can use the batteries as a power switch. Install them to turn lights on, then take out one to turn lights off.) Important note: the long leg of an LED must be connected to the positive end of the batteries (or the red wire of the battery pack), otherwise, the LED will not light up.
7- Turn on all three lights. Place a white paper behind the prism. Notice that the images of the green LED and the red LED appear at different lateral positions. Also notice that the image of the incandescent bulb is showing a full thermal spectrum. Take a photo of the images that you see on the white paper. (You may turn off the lights or close the curtain to improve visibility.)
8- Take measurements of the angles of incidence and the angles of refraction for the light rays through the prism, and calculate the refractive indices of the prism for green light and for red light. (You can use a pen and another piece of paper under the prism to help you trace the light rays. On the paper, you will need to trace the outline of the prism and the incoming and outgoing light rays for each color of light.)
Part II – Diffraction Grating-based Spectroscope
9- Temporarily disconnect the lights from the battery (keep them in the slit). Remove the prism.
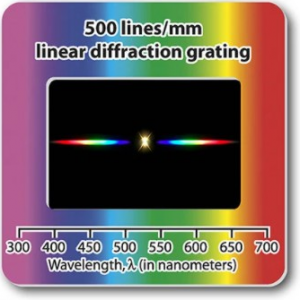
10- The diffraction grating in the lab kit has 500 lines per millimeter. Tape the diffraction grating to the lens so that the lines in the grating are parallel to the slit. (As an example, if the grating is placed like the figure below, its lines are vertical.) Now you have a grating-based spectroscope.
11- Reconnect all the lights. Place a piece of white paper in front of the grating and perpendicular to the central light ray. You should see the spectra of the three lights resolved by the grating as images on the two sides of the central image. Take a photo of the images on the paper.
12- Measure the distance from the grating to the white paper. For the images of the LEDs, measure the distance from the central image to one of the images on the sides (i.e., the distance between the zeroth order and the first order). Use your measurements to calculate the diffraction angles of the first order images of the red and the green LEDs.
13- The grating equation for the first order image is d sin =, where d is the distance between two adjacent lines on the grating (this information can be read on the grating), is the diffraction angle of the first order, and is the wavelength of light. Given that the wavelength of the light emitted by the red LED is 633 nm, estimate the wavelength of the light emitted by the green LED. (no need for error analysis)
14- Disconnect and remove the lights from the slit. Remove the lens from the box and tape the grating directly onto the window. (Keep the grating lines parallel with the slit on the box). Now you can use the spectroscope to analyze parallel rays from light sources.
15- Let your computer screen display white light. Hold the slit next to the screen. Observe the slit through the grating, and you should see three separate color bands on each side of the slit. The color bands are blue, green, and red (from innermost to outermost). Explain why you are seeing these three bands.
Tips for data analysis:
- Complete all measurements and calculations that are required in the procedures above. Show sample calculations in the appendix.
- Attach all photos that are required in the procedures above.
- Answer all questions in the procedures above.
- Attach graphs or diagrams when necessary.
Suggested topics for discussion:
- What other quantities can be determined with the spectroscope that you made?
- How can you improve the resolution of your spectroscope?
We value your feedback!
Did you enjoy this experiment? What are the aspects that you dislike the most about this experiment? – Let me know in the “Student Feedback Survey for Lab 5” on the discussion board on Quercus! We may award the most helpful inputs with +1 bonus mark for the lab report!
This work is licensed under a Creative Commons Attribution-NonCommercial 4.0 International License.
