18 Lab 3: Calorie Burn of Exercise
liyuchon
Acknowledgment
This project is made possible with funding by the Government of Ontario and through eCampusOntario’s support of the Virtual Learning Strategy. To learn more about the Virtual Learning Strategy visit: https://vls.ecampusontario.ca.
PHY255 Stay-At-home Experiment 3
Measuring the Calorie Burn of Aerobic Exercise
What you will do
Use the built-in accelerometer of the phone to monitor the breath rate and heart rate before and after vigorous exercise. Then estimate the calories burn during the exercise.
What you will need
- A smart phone installed with the Phyphox app
Theoretical Background
Most of the energy consumed by a person comes from the oxidation of carbohydrates during aerobic respiration. When oxidized, 1 mole of glucose molecule will react with 6 moles of oxygen, yielding [latex]670kcal[/latex] of energy. This also means that aerobic respiration can produce [latex]4.83kcal[/latex] of energy per liter of pure oxygen (assuming that carbohydrates are the sole source of energy).
When breathing at the resting rate, the lung of a human inhales/exhales about [latex]0.3~0.5L[/latex] of air (depending on the body height and the fitness level). When breathing at the maximal effort, the lung of a human inhales/exhales about [latex]3~5L[/latex] of air (also known as the “lung capacity”). Since the oxygen content in the inhaled air is about 20%, and the oxygen content in the exhaled air is about 15%, we can estimate the volume of oxygen consumed per breath.
In the experiment, the respiratory rate (i.e., the rate of breathing) will be measured using the Phyphox app. The volume of air exchange of the lung per breath will be estimated using subjective judgment. The total volume of oxygen consumed will then be calculated. Combining with the estimations of energy per liter of oxygen and volume of oxygen per breath, we will reach an estimation of the calorie burn during the exercise.
Procedures
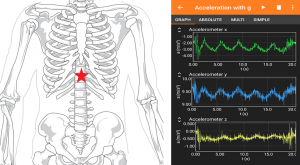
- (Preparation 1/2) In the Phyphox app, choose the “acceleration with g” sensor. Lie down on a flat surface. Place the phone vertically below the sternum bone, on the thoracic diaphragm (as shown in the left panel of the figure below at the location of the star).
- (Preparation 2/2) Start a measurement. Normally breath for a while, then stop the measurement. (When you start/stop measurements, try to keep your motion as gentle as possible, so as not to create spikes of acceleration.) If there are no strong spikes at the beginning or the end, at least one of the panels should show a prominent feature corresponding to the movement of the diaphragm during breathing. (In the right panel of the figure below, five breaths were captured. Both x and y accelerometers showed the movement). The total time it takes for the breaths can be more accurately read after saving the data as a csv file. This will be the way we measure our respiratory rate.
- Use the method above, lie down and record about 10 breaths when you are resting. Take a screenshot of the accelerometer reading and save the data as a csv file.
- Clear the breathing data. Stay lying and place the phone directly on the sternum bone. Start a new measurement. Stop the measurement after about 10 seconds. You should be able to see your resting heart rate picked up by the accelerometer. Take a screenshot. (No need to save data for this step.)
- Clear the heart rate data. Start a new measurement. While holding the phone in one hand, try to do 100 squats. (Warning: stop the exercise immediately if you are feeling unwell. Contact the instructor about alternative activities if necessary.) Some tips: Pay attention to breathing during the exercise. It is OK to not count because the accelerometer will also count the repetitions for you. If you cannot finish 100 squats in 5 minutes, feel free to stop after the 5-minute mark.
- After the exercise, take a screenshot of the data and save the data.
- Clear the exercise data and immediately lie down to record 10 breaths. Stop the measurement, make another screenshot and save the data.
- Clear the breathing data. Stay lying and place the phone directly on the sternum bone. Start a new measurement. Stop the measurement after about 10 seconds. You should be able to see your recovery heart rate picked up by the accelerometer. Take a screenshot. (No need to save data for this step.)
Data Analysis & Discussions
- Calculate the resting respiratory rate using the data saved from Step 3 above. Express your answer in the number of breaths per second (should be less than 1).
- Calculate the active respiratory rate using the data saved from Step 7 above. Express your answer in the number of breaths per second.
- If you know your lung capacity (i.e., the maximal volume of air inhaled/exhaled per breath), use it for your calculations. If you do not know your lung capacity, assume a value based on your height and your fitness level. For a typical adult, the lung capacity is between [latex]3~5L[/latex]. (See also: https://en.wikipedia.org/wiki/Lung_volumes)
- Using the lung capacity value and your subjective experience during the exercise, make an estimation of the volume of air exchange per breath during the squat exercise.
- Use the active respiratory rate, the duration of the exercise, and the volume of air exchange per breath, estimate the total oxygen consumption during your exercise.
- Calculate the calorie burn per squat. Express your result in [latex]kcal/squat[/latex]. Compare your result with information that you can find online.
- Use the resting respiratory rate and the estimation of the volume of air exchange per breath at the resting state, calculate your total oxygen consumption during a day (assuming you were at the resting state for the entire day).
- Calculate your basal metabolic rate. Express your result in[latex]kcal/day[/latex] . Compare your result with information that you can find online.
- Attach the screenshots of the heart rate before and after the exercise next to each other. Did your heart rate increase after the exercise?
Requirements of the experimental report:
- Font size: 12
- Line spacing: 1.5
- Only write these sections: Results, Discussions, and Suggestions of improvement.
- Total marks: 20/20
- Results (12/20):
- Complete all the calculations that are required in the procedures and data analysis sections above.
- Show sample calculations.
- Attach graphs or tables when necessary.
- If you write a program for calculations, attach the code in the appendix.
- Discussions (8/20):
- Find or estimate the uncertainty of your calculation results.
- Identify the sources of error in your experiment.
- Feel free to do more tests to verify your claims if possible.
- Make a reasonable conclusion based on your results.
- Compare your results with literature values (and add citations).
- Suggestions of improvement (+2 bonus; total marks capped at 20/20):
- What other quantities can be determined with the same experimental design?
- What can be done to reduce the uncertainties at no or minimal cost while staying at home?
- Did you enjoy this experiment? What are the aspects that you dislike the most about this experiment?
