15 Lab 5: Spectroscope
liyuchon
Acknowledgment
This project is made possible with funding by the Government of Ontario and through eCampusOntario’s support of the Virtual Learning Strategy. To learn more about the Virtual Learning Strategy visit: https://vls.ecampusontario.ca.
PHY100 Stay-At-home Experiment 5
Grating-based Spectroscope
What you will do
Observe the spectra of various light sources using a diffraction grating
What you will need
- A diffraction grating
- Two different-colored light sources (such as LED indicator lights)
- A large piece of cardboard
Procedures
- Hold the grating to your eye, and look though the grating. Pay attention to the rainbow-colored patterns that are at an angle away from bright objects. These patterns are the spectra of the objects, displayed at the “diffraction maxima” of the grating.
- The spectra that you saw with your eye through the grating are probably smeared. It is usually very difficult to see the fine structure of the spectra because of the large size of the light source. We will make a slit to improve the resolution.
- Cut a thin slit (less than 3mm) at the center of the cardboard. Now if we hold this cardboard in front of the light source, then hold the grating to your eye and look at the slit. The spectrum can be better resolved.
- You can also attach the grating to the camera of your phone, and take photos of these light sources through the slit.
- To improve the quality of the spectrum, try the following tips:
- You can close the curtain of the room and turn off most of the room light, leaving only the light source.
- You can try taking the photo using night sight mode. Note that in the night sight mode, you will need to hold the phone steadily for a few seconds.
Reporting and Discussions
- (1/5 points) Find two monochromatic light sources at home. For each light source, take a photo of the spectrum by attaching the grating to the camera of your phone. Use the slit to improve resolution if necessary. Attach the two photos in your report, then determine whether the light sources in the photos are indeed monochromatic.
- (1/5 point) Find a source of white light at home, take a photo of its spectrum. Can you see dark or dim bands in the spectrum? If you see prominent dark bands, your light is likely a fluorescent lamp. Attach the photo in your report, then determine whether your light is a fluorescent lamp or not. Use the slit to improve resolution if necessary. (If you are curious about the exact type, this figure may help: https://www.researchgate.net/figure/Fig-2-Spectra-of-the-different-indoor-light-sources-a-Xenon-lamp-b-incandescent_fig1_330372622)
- (2/5 point) Turn up the brightness of your computer screen. Make part of your screen display white color (such as the empty part of this document). Through the slit, take a photo of the spectrum of the screen. Attach the photo in your report. Does the spectrum of the computer screen contain the full visible spectrum (i.e. contain a full set of rainbow color)? Does this observation make sense to you? Briefly explain. (Feel free to research how computer monitor works.)
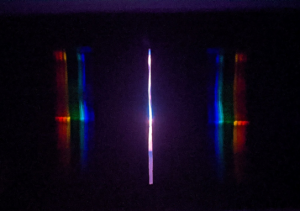
- (1/5 point) Below is a photo of the spectrum of a “plasma globe”. Research online, and briefly explain how we can figure out the composition of the gasses inside the globe without breaking into the globe.

NOTE: the word limit for all questions is 100.

