EXPERIMENT 5: RESIDENCE TIME IN A MIXED REACTOR
Introduction:
A continuous stirred tank reactor (CSTR) is a system where a liquid flows continuously into a tank which is agitated thoroughly. The following conditions prevail:
- The inlet flow rate is constant.
- The tank is always filled up to an overflow point near the top; any addition of liquid results in an outflow, so that the total volume of liquid in the tank remains constant.
- The volumetric flow rate out must therefore equal the volumetric flow rate in.
- The stirring is assumed to be good enough that the concentration of liquid throughout the tank is uniform. Thus, if a small amount of a dissolved component enters the tank, this is assumed to be distributed instantaneously and evenly through the whole volume of the tank.
- The composition of the liquid leaving the tank is, therefore, the same as the liquid in the bulk of the tank. The concentration of a dissolved component in the tank at any one time may be found by sampling the liquid leaving.
- The concentration of any substance in the tank can change as a result of a reaction (hence, the name continuous stirred tank reactor) or dilution/strengthening through the concentration of the incoming solution.
A schematic of a single “continuous stirred tank reactor” (CSTR) is shown below:
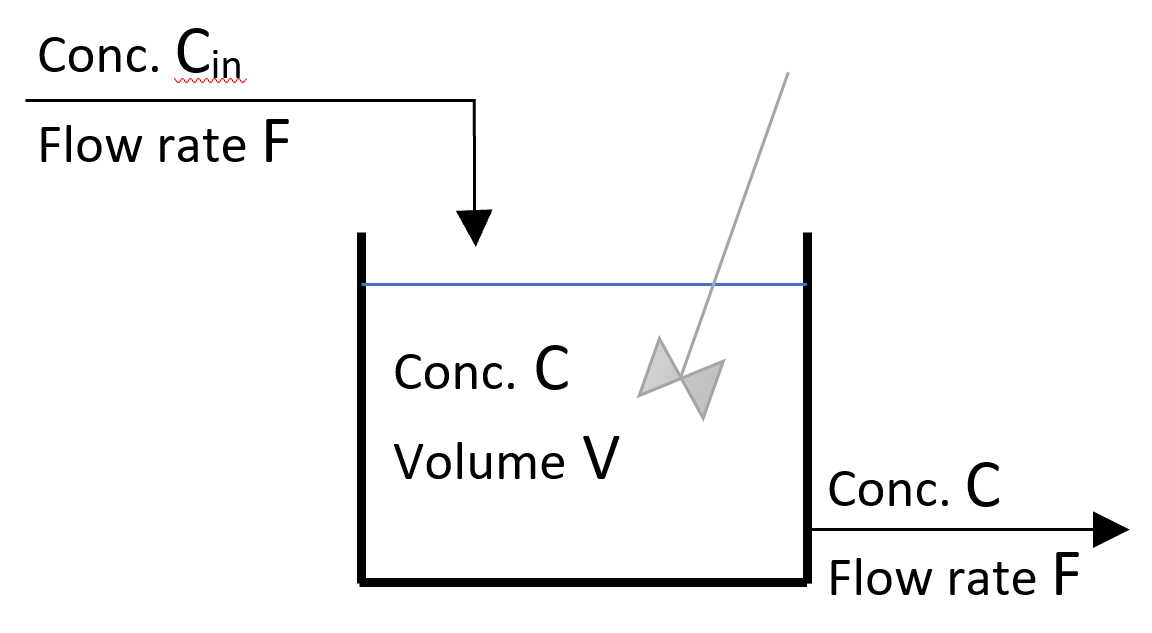
Figure 1: Schematic of a single CSTR
When a stirred tank starts off filled with a solution, and a solution of a different composition is added continuously, the entering solution mixes with what is in the tank, so that the solution leaving is a different composition from the solution entering. The composition of a dissolved component in the tank gradually changes as the dissolved component either accumulates (if the entering solution is of higher concentration) or dwindles (if the entering solution is of lower concentration). Because of this change in the composition of liquid in the tank, this system is referred to as an “unsteady-state system”.
Considered a stirred tank with a dissolved component with initial concentration C0. If the inlet flow rate to the tank contains none of the dissolved component (Cin = 0), the concentration of the dissolved component in the tank at any time “t” can be calculated through the formula:
(1) 
where
| Ct | Concentration at time t, in mol/L |
| C0 | Concentration at time 0, in mol/L |
| F | Flow rate through the tank, in mL/min |
| t | time, in min |
| V | volume of the stirred tank, in mL |
This equation is an “exponential decay”. The concentration of the dissolved component in the tank will slowly dwindle to eventually zero after, in theory, infinite time.
In the industry, it is very common to have multiple reactors in series. In this case, the flow rate through all reactors is the same, to ensure steady state, but the concentration of components might change from one reactor to the other. A schematic of a system with two reactors in series is shown in Figure 2 below:
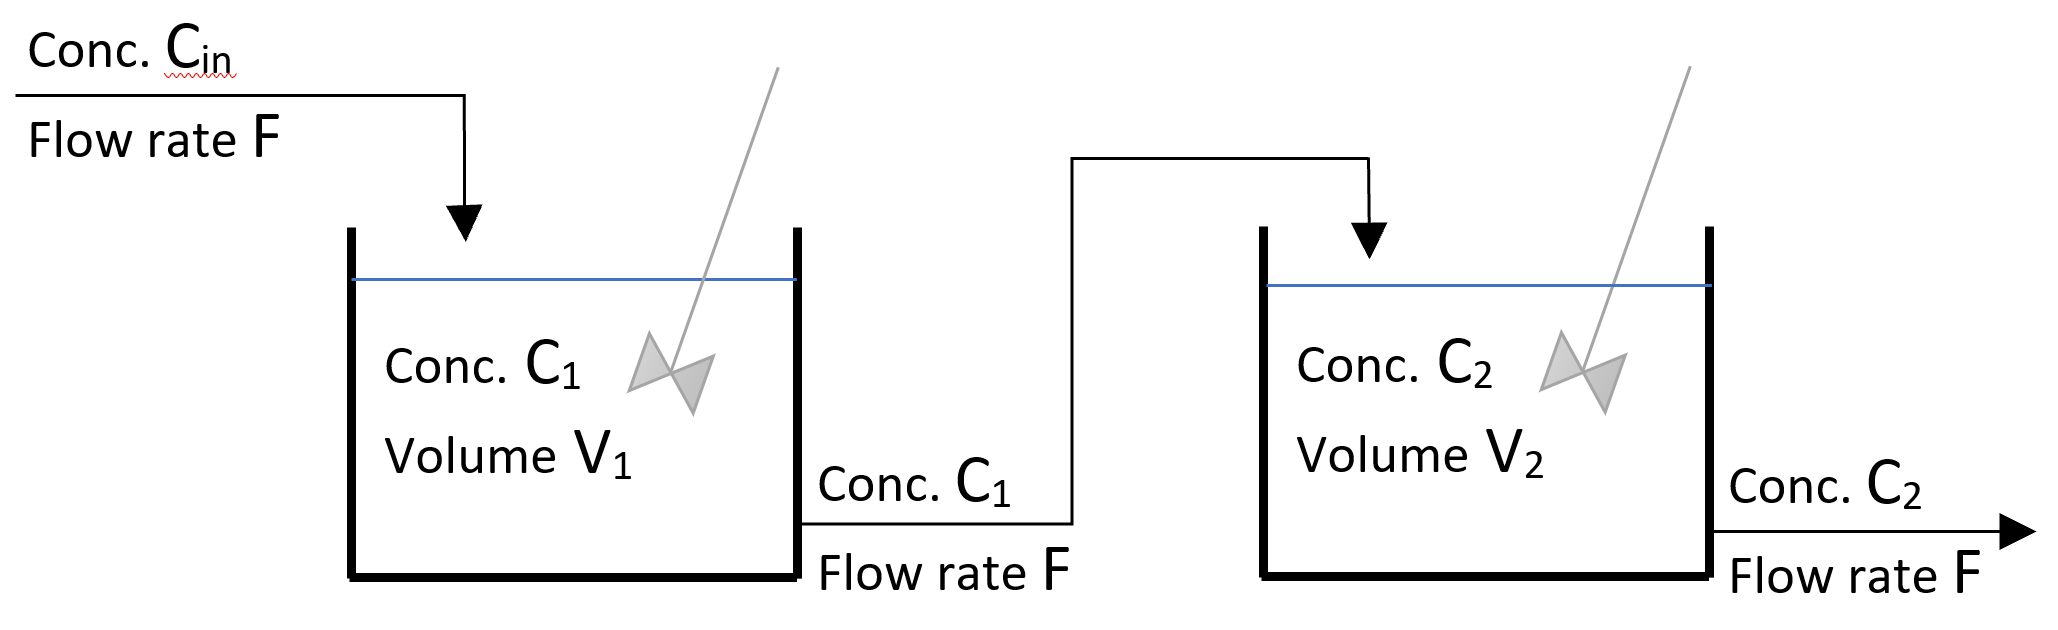
Figure 1: Schematic of a two CSTRs in series
Considered two stirred tanks of similar volume in series with a dissolved component with initial concentrations C1,0 and C2,0, respectively. If the inlet flow rate to the first tank contains none of the dissolved component (Cin = 0), the concentration of the dissolved component in the second tank at any time “t” can be calculated through the formula:
(2) 
where, similar to equation (1):
| C2,t | Concentration in second tank at time t, in mol/L |
| C1,0 | Concentration in first tank at time 0, in mol/L |
| C2,0 | Concentration in second tank at time 0, in mol/L |
| F | Flow rate through the tanks, in mL/min |
| t | time, in min |
| V | volume of each of the stirred tanks, in mL |
In the E030 lab, the stirred tanks system consists of two ChemGlass reactors, each equipped with an agitator. Either a single reactor can be used, or both reactors in series. A pump is connected to the system to supply the feed liquid. Photos of the system with most important components highlighted are provided in Figures 3 and 4.
Figure 3: Front view of reactors set-up with major components highlighted.
Figure 4: Side view of reactors set-up with major components highlighted.
Purpose
The purpose of this experiment is to compare the experimental observation of methylene blue concentrations exiting a single and a two-stirred tank(s) (reactors) system with the theoretical expectations.
Procedure
In this lab, you will be working with two different set-ups. First a single tank (reactor) and then two tanks in series.
Single Reactor
- The “stirred tank” in this experiment is a Chemglass glass reactor. Fill it with plain (tap) water manually and turn on the stirrer to a high speed (approximately 300 rpm) without excessive splashing at water’s surface . Turn on the pump and with water being added to the reactor, you will soon observe water being drained from the vessel. Stop the pump and close the bottom valve on the reactor. Prepare the graduated cylinder, reopen the bottom valve and drain the water into the cylinder. Measure the working volume of the reactor, which will be used in the theoretical calculations.
- Turn on the reactor’s agitator and set it to 300 rpm. Use the tachometer to measure the actual rpm of the motor and readjust the motor. Make sure that the bottom drain valve on the CSTR is closed.
- Add 20ml of the supplied 500ppm methylene blue solution to the CSTR reactor.
- Turn on the peristaltic pump and set the flow rate to 250 ml/min making sure that the suction tube is sitting in the water tank filled with water. The flow rate calibration graph is posted on the wall beside the unit and is also provided in Figure 5, below.
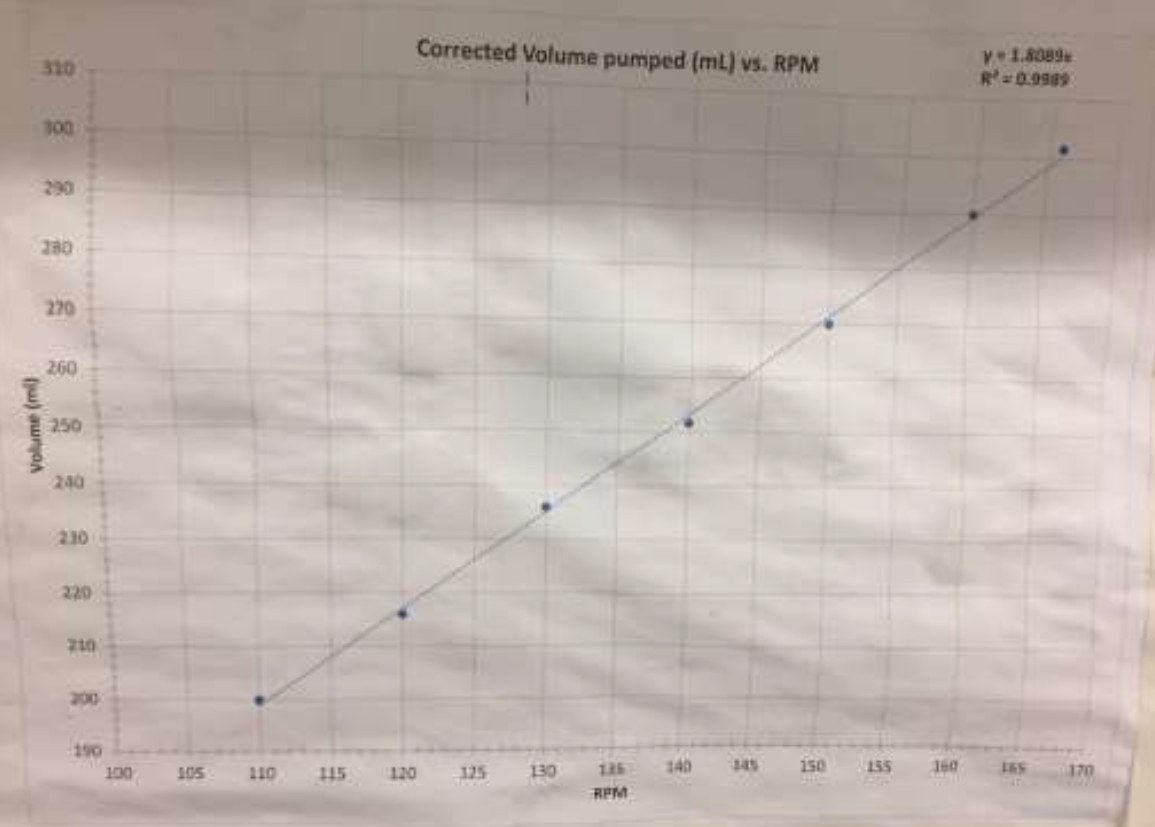
Figure 5: Relationship between RPM and flow rate for peristaltic pump. On the graph, volume refers to ml/min.
The pump’s RPM can be adjusted using the touch-buttons while the rpm is displayed on the screen, as shown on Figure 6.
Figure 6: Peristaltic pump. - Once the reactor is filled with water/Methylene blue solution, there will be a continuous flow of the product (Methylene blue solution being gradually diluted by fresh water fed into the reactor) from the bottom valve of the single CSTR. Make sure that there is a vigorous mixing in the reactor. Wait 10 seconds until residual water from the previous run, trapped in the discharge tube is being drained from the bottom valve. (This will prevent low concentration readings of methylene blue at time 0).
- Take a small sample of the outflow every 2 minutes for 20 min., noting the time at which each was taken. Find the absorbance of the sample using the HACH spectrophotometer at 610 nm. Absorbance measurements will be done once the run is completed.
- Meantime prepare a set of standards 5 and 10 ppm of methylene blue using the provided stock solution. The Absorbance measurement of the standards will be used to generate a calibration line. The calibration line will be generated by plotting Absorbance vs. Concentration.
- Analyze the samples using the HACH spectrophotometer set to measure Absorbance at 610 nm wavelength. Remember to also measure the Absorbance of each standard. The HACH spectrophotometer operating manual can be found near the instrument.
Two Reactors in Series
- Measure the effective volumes of both tanks, if not done previously.
- Ensure that the feed line is connected to the top reactor.
- You will be taking data from two runs. The parameters needed for both runs are given in the Table below:
Run 1 Run 2 Starting composition Both tanks: 20 ml of 500 ppm methylene blue and the rest water Top tank: 20 ml of 500 ppm methylene blue and the rest water Bottom tank: just water
Flow rate through system 250 ml/min 250 ml/min Sampling schedule Every 3 minutes until 21 minutes (do not forget the time zero sample) At times: 0, 2, 3, 4, 5, 6, 7, 9, 12, 15, 18, and 21 minutes For each run, collect your sample from the exit of the system (exit of the second reactor) and measure the absorbance of all at the end of the experiment. The absorbance of the standards has already been measured in the single-reactor experiment.
Report
- Use the absorbance measurements for the standard solution and create a “calibration curve” for the spectrophotometer.
- Plot absorbance versus ppm for the standards.
- linear trendline through the data points and get its equation. Make sure the trendline goes through the origin (0,0) point of the plot, its equation should be in the form y = a x. This equation will be used to convert all the absorbance measurements to concentration. See the video below for some help (not, though, that in the video, three standard solutions are used), but make sure your plot is complete with axes titles and units.
- Use the “calibration curve” to convert all the absorbance measurements to concentration.
- For each of the three runs, calculate the theoretical starting methylene blue concentration (based on dilution of the 500 ppm solution on the reactor volume) and compare with the experimental measurement at time zero. To calculate the theoretical methylene blue concentration, recall that during dilution
 , where C is concentration and V is volume. If there are differences between the experimental and the theoretical values, comment on why that happens.
 - For each of the three runs (one for the single reactor and two for the two reactors in series), create a plot of methylene blue concentration versus time. Each plot must include your experimental data and the theoretical predictions using the equation provided at the introductory part of this manual. For calculating the theoretical curves, use the experimentally-calculated initial concentration as your C0. An example of such a plot for a single reactor is provided in Figure 7 (note, that during this experiment used for this plot, samples were collected every 3 minutes, not 2).
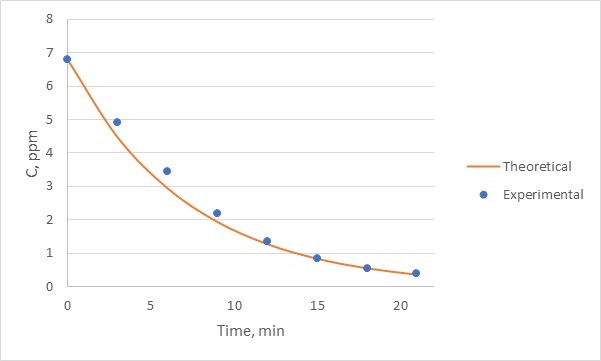
Figure 7: Experimental to theoretical comparison for a single reactor. Experimental data, being discrete measurements are noted by points. The theoretical curve, being continuous, is noted by a continuous line. - For the single reactor run, also generate a plot of
 vs time. Include both the experimental measurements and the theoretical predictions on that plot.
 - Discuss the plots. Why does the methylene blue concentration follow the observed curves?
- Comment on the results. How close (be reasonably specific!) are the experimental results to the theoretical predictions?