EXPERIMENT 3: ABSORPTION – FLOODING
Introduction
Absorption is a method for separating a specific gas component from a gas mixture. This separation happens by bringing the gas mixture in contact with a liquid so that soluble components of the gas mixture dissolve into the liquid. Careful selection of the liquid solvent enables separating specific, soluble to the solvent, components from the gas. This process occurs in an absorption column where liquid flowing down the column comes in contact with the gas mixture rising up the column. To maximize the mass transfer of the targeted components from the gas to the liquid phase, the contact area between the gas and the liquid must be maximized. This is achieved through different types of absorption columns: packed bed, spray, falling film, bubble, tray. An overview of the different types is provided in the Visual Encyclopedia of Chemical Engineering: http://encyclopedia.che.engin.umich.edu/Pages/SeparationsChemical/Absorbers/Absorbers.html. Absorption columns can run continuously and are often used to remove contaminants from the gas phase.
The absorption column in the lab is a vertical glass pipe about 10 cm in diameter packed with a 140 cm. depth of 8 mm glass Raschig rings to provide good contact between the gas and the liquid. A figure of the column with most major features pointed-out is provided in Figure 1. Gas enters the bottom of the column and leaves at the top through a duct connected to the laboratory fume hood. Water enters the top of the column and leaves at the bottom passing through a tube that remains full of water to prevent gas leaving by this route. Flows of gas and liquid are measured by rotameters. Tappings are available for measuring pressure changes in the system and for taking samples of gas for analysis. A schematic of the flow through the column is provided in Figure 2.
Raschig rings, similar to the ones provided by this supplier: MilliporeSigma, are just small glass rings added to increase the surface of contact between the gas and the liquid. This is essential, as mass transfer of the dissolving gas component occurs at this interface between the liquid and the gas. In the absence of these rings, the gas would probably rise up the column as a jet, providing little interfacial area and limited absorption. If the gas and liquid flows are too high, gas and liquid compete for the space in the column; rising gas prevents liquid flowing down and vice-versa. In extreme conditions, the liquid begins to fill the upper part of the column and the gas may build-up enough pressure to force its way out through the U tube blowing the water out of the “seal” there. This condition is known as “flooding” and is avoided in industrial situations, as it limits absorption. Investigation of the gas and liquid flow rates that cause flooding is part of this experiment.
Figure 1: Absorption Column with basic functions highlighted
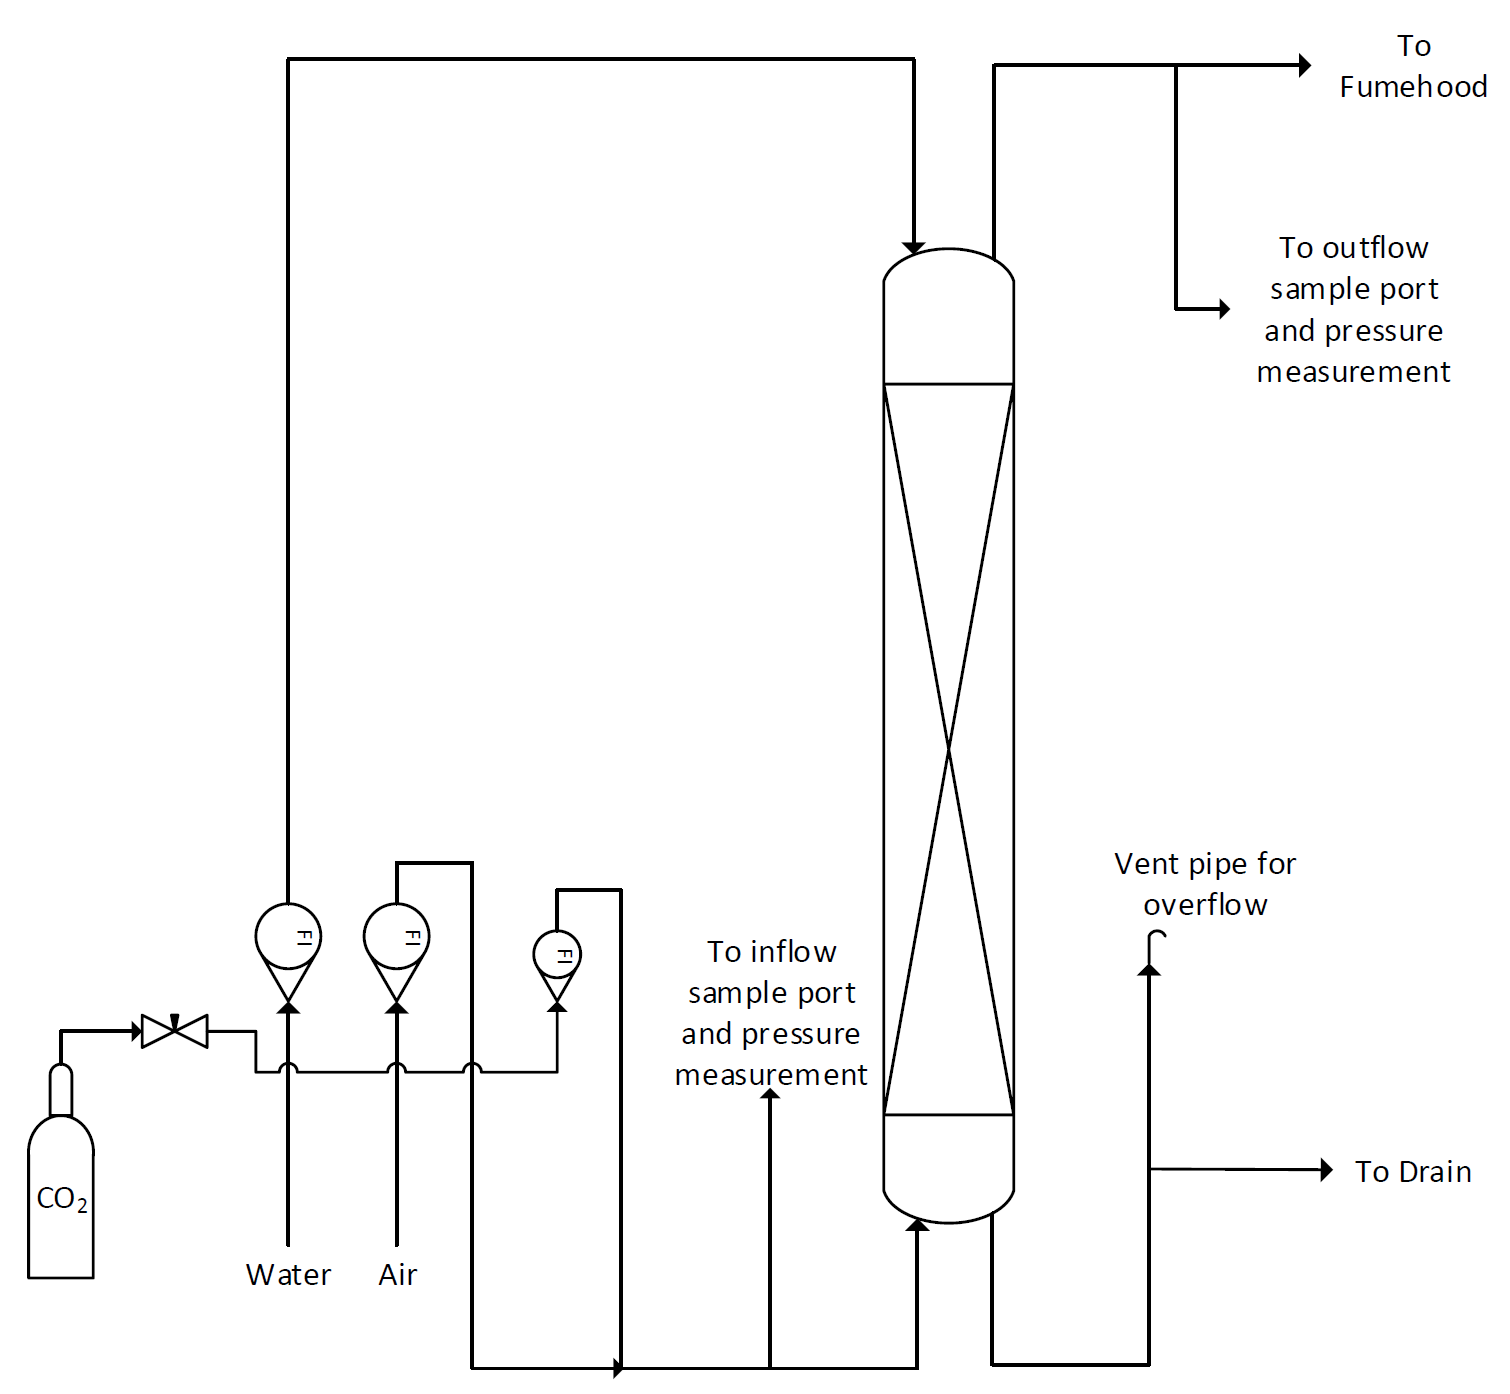
Figure 2: Absorption column P&ID
At the back of the absorption column, simple tubing with clamps is used to divert the gas coming from the inlet and outlet sampling ports to the differential pressure reader and/or the CO2 analyzer. Figure 3 shows the rear side of the column with all the clamping. The main reason for the piping on the back and the clamps is that any instant in time, only one sample can be fed to the analyzer for CO2% calculation. Hence, there must be a way for the operator to simply exchange between the inflow and the outflow sample for analysis.
Figure 3: Rear side of Absorption Column with basic functions highlighted
Purpose
The purpose of the experiment is to investigate:
- the pressure changes in the column at different gas and liquid flow rates.
- the conditions under which the column floods.
No absorption is done in this experiment.
Procedure
Pressure drop measurements in dry column
- Turn on the air flow at a low rate. DO NOT turn on the water. Read from the digital manometer the pressure drop through the column.
- Repeat for six other air flow rates. Ensure that the seven flow rates you selected cover the entire range of possible air flow rates.
Pressure drop measurements in a wet column
- Turn on the water to the column. When water flows from the bottom of the packing, turn off the water. The packing will now be wet and there will be less space in the column for air.
- Measure the pressure difference across the column for the seven different air flows you used in step 1.
Pressure drop measurements during column operation & flooding
- Turn on the water flow and set it at a low rate (low, but enough to have continuous water flow through the column).
- Turn on the air flow at a low rate and start a timer.
- Record the pressure difference across the column. You need to wait for a constant pressure difference before taking the reading. If flooding occurs (common at high air flow rates) turn off the air immediately and record on your notes the time that flooding occurred (Time is measure from the point you adjusted the air flow). You will probably not have a pressure difference reading for that set of flow rates, as the pressure difference must be continuously rising until flooding.
- Repeat steps 2 and 3 above for five different air flows, but ensure that the six flow rates you selected cover the entire range of possible air flow rates. If flooding occurs for multiple air flow rates, make measurements at additional air flow rates to ensure that you have at least five air flow rates without flooding.
- Repeat steps 2 to 4 for at least four more water flow rates.
In the end, you should have at least 25 data points without flooding and some extra ones with flooding, for which you must have noted the time it took for flooding to occur.
Repeat this part of the experiment (pressure drop measurement during column operation and flooding). For this second run, the values of water and air flow rate do not have to be exactly the same as in the first run.
Leave the air running at 200 SCFH when you complete your measurements
Report
- On a single graph, plot ΔP versus air flow for all the cases considered during the data collection. The graph must have multiple lines:
- One for a dry column
- One for a wet column
- One for each of the five (or more, if used different ones in the experiment repeat) water flow rates used in the experiment .
Comment on the shape of the lines and the relationship between them. What do they reveal? If there are any differences between the two lines, please explain the source(s) of these?
- Use all the data from the last part of the experiment (Pressure drop measurements during column operation & flooding). Plot water flow vs. air flow for all your data points. Use a different marker symbol for non-flooding point and for flooding point. Draw the “flooding curve” – a line separating the flooding points from non flooding points. The curve should close to points with long flooding times, far from points with short flooding times. This is an important curve as it highlights the column’s “operating window” (i.e. the set of flow rates on which the column can be operated). Comment on the shape of the curve, and the operating window.
- Comment on the flooding times for the conditions that resulted to flooding. How does the time for flooding depends on the water and air flow rates relative to the operating window?