EXPERIMENT 2: TWO COMPONENT SYSTEM PHASE DIAGRAM
Introduction
When two pure substances are mixed, the melting point of the mixture will be lower than that of the more abundant pure substance in the mixture, a phenomenon know as “melting point depression”. A simplified “phase diagram” is shown below in Figure 1, where the phase(s) of the system is plotted against temperature (y-axis) and composition (x-axis). The melting points of the two pure components (Tm,A for A and Tm,B for B) are also noted. From this phase diagram, it also becomes clear that a mixture of the two components changes phase (melts or solidifies) over a range of temperatures, not at a single temperature as a pure substance.
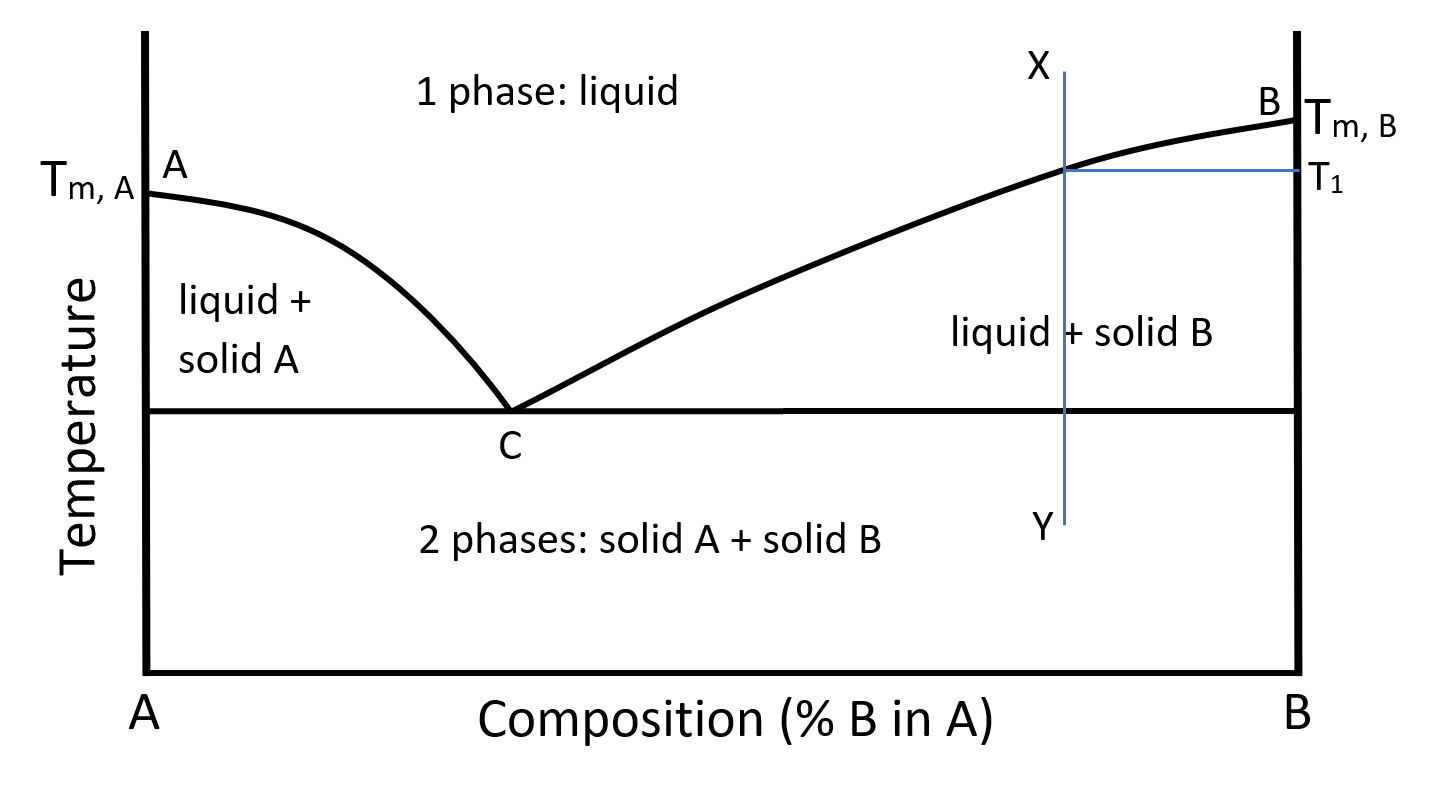
Figure 1: Two-component phase diagram with eutectic point
At a composition represented by the line XY and at a temperature at point X the system is a single-phase liquid. The Gibb`s phase rule at this condition yields:
F = C – P – 2 = 2 – 1 + 2 = 3
where C is the number of components (2 here), P the number of phases (1 here), and F the degrees of freedom. So, the system at point X has 3 degrees of freedom (temperature, pressure, composition). Since experiments are usually carried out at atmospheric pressure, one degree of freedom is fixed and only temperature and composition could change while the system exists as a single phase.
If the temperature is lowered until it reaches the line BC, the 2-phase region is entered. Then a second phase appears and Gibbs phase rule yields
F = C – P – 2 = 2 – 2 + 2 = 2
meaning that with pressure fixed, either temperature or composition may be changed but not both. In other words at the composition of the XY line, the temperature at which 2 phases will appear, during cooling, will always be T1. As solid first begins to appear it will be pure B and, if cooling continues along the line XY, pure B will continue to crystallize out of the melt and the composition of the remaining liquid will follow the line BC until point C is reached. Point C is called the eutectic point. The system will stay at this composition until all of it solidifies. Notice that regardless of the initial composition of the system between A and B, any liquid which is allowed to cool slowly will approach the point C in composition while either pure A or pure B crystallizes out of the melt.
Phase diagrams such as the one just described are extremely useful in predicting the behaviour of a two-component system as melting and freezing occur. To construct such a diagram, a number of different mixtures of the two components are prepared, heated until they are completely melted and then allowed to cool slowly noting the changes in temperature with time. The first trace of solid will be the pure component and the temperature that happens represents the melting point of the mixture. Further cooling will gradually crystallize more and more solid until the liquid is completely gone. The temperature where this last liquid droplet solidifies is the temperature of the eutectic point (point C on the diagram). These transitions during cooling of a melt of lead and tin is described in detail in this article contributed by Jim Clark on May 18, 2020 at the LibreText Libraries,
If the process is reversed and a solid system is slowly heated rather than cooled, the first trace of liquid appearing will be at the temperature of the eutectic point while the last trace of solid will occur at the temperature of the melting point for the given mixture. This is represented in the sketch of Figure 2 of the temperature evolution during heating-up of a solid mixture. If the solid mixture happens to be at the composition of the eutectic point, the mixture will melt at a single temperature, as at point C the phase lines meet to a single point.
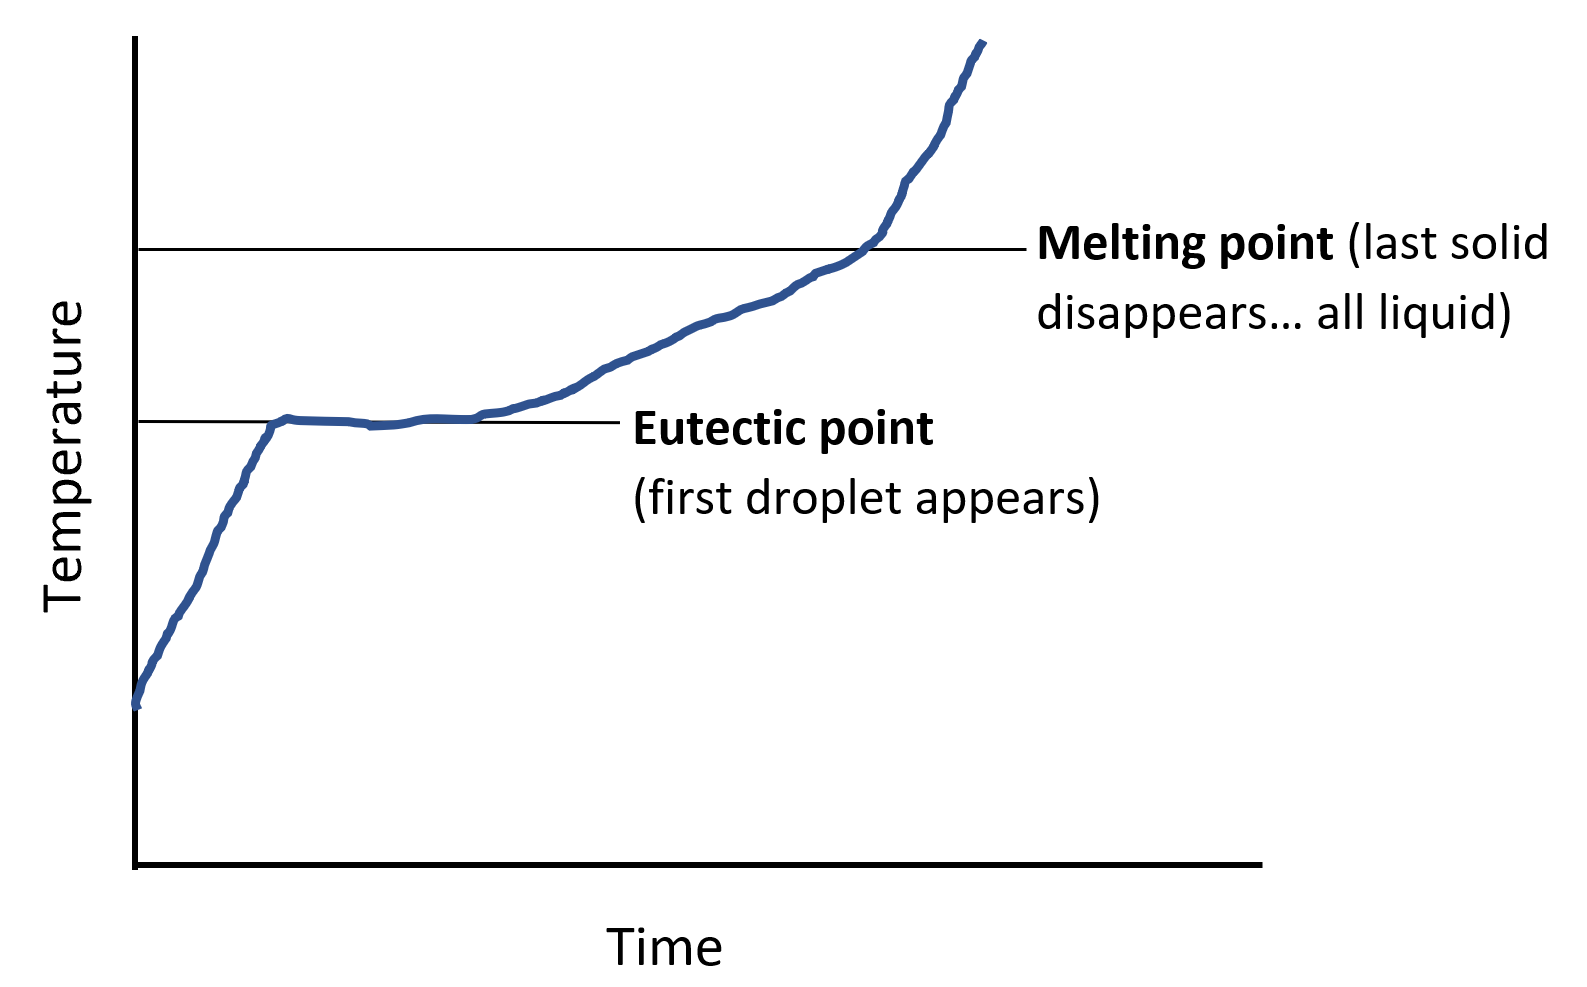
Figure 2: Sketch of temperature of evolution during heat-up of a two-component solid mixture.
Before moving on to the experimental procedure, check your knowledge with these 5 questions.
Procedure
The phase diagram will be generated for mixtures of naphthalene and p-nitrotoluene.
- Remove a small amount of the solid from each of the provided mixtures and grind to a powder in a mortar and pestle in the fume hood, or where specified by your instructor. (Please, use gloves while doing this).
- Prepare “melting point tubes” of each mixture sample and of the two pure substances. To accomplish that, fill a capillary tube with crystals about 3 mm high by placing the capillary tube (open end down) into the sample powder and tapping it to get the crystals into the tube. Force the crystals to slide to the bottom of the tube using one of the following methods: tap the tube (open end up) on the lab bench or drop the capillary tube through a 2-3 foot piece of glass tubing;
- Take one of the melting point tubes and place it in the melting point apparatus.

Figure 3: Melting point apparatus - Connect the thermocouple of the apparatus to a temperature reading device.
- Turn the voltage control knob to heat the apparatus slowly (about 2°C per minute because if you go beyond any melting points, it takes a long time to cool the melting point apparatus. It is much better to increase the temperature slowly than to try and cool the system down) while looking through the magnifying glass of the apparatus. Take notes of:
- the temperature at which each sample just begins to melt.
- the temperature when each substance melts completely.
- Repeat steps 3 and 5 for all samples and the two pure substances.
Report
- Make a table with the melting point and the eutectic temperature of each sample.
- Calculate the mole fraction of each mixture. Tabulate your results and show the detailed calculation for one of the mixtures.
- Plot the melting points vs mole fraction, and eutectic points vs mole fraction, on the same graph. Include the pure substance data points. Label the sections of the graph as “1 phase”, “2 phase, solid x + liquid y” etc., as in Figure 1. This graph is difficult to draw. You will have to compromise fitting of points to the overall goal of producing a set of four smooth curves that meet at a single point, the eutectic point. A schematic of the graph is shown below
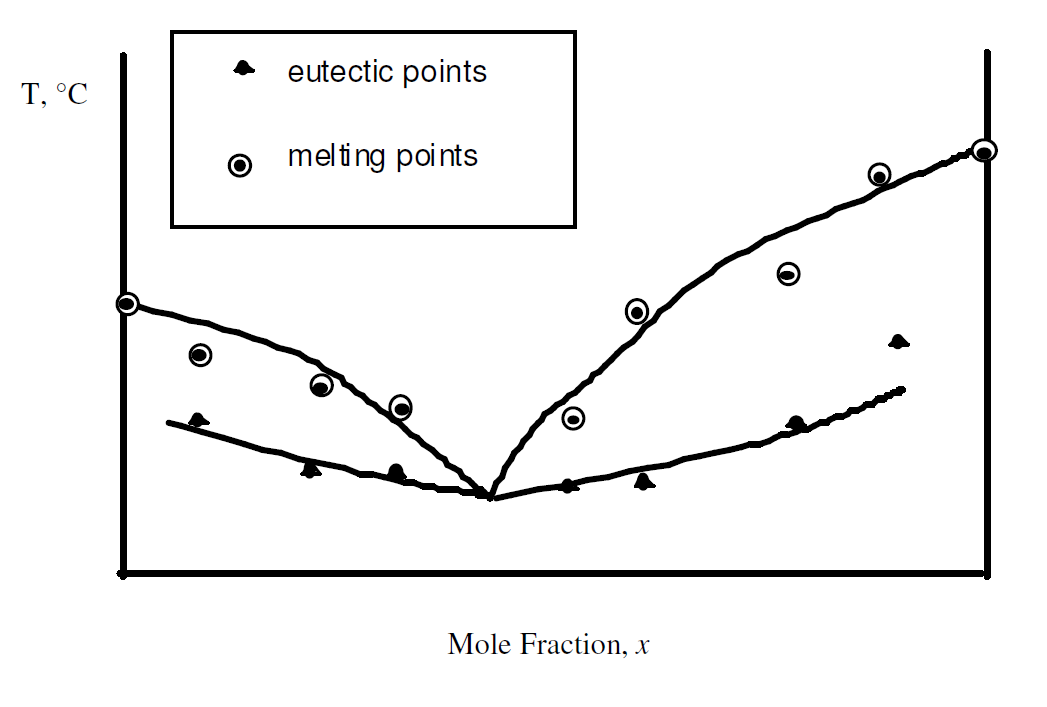
Figure 4: Sketch of phase diagram created with lab data - Use your graph to predict the melting point range for a mixture with (XX+50)/2 % by mole Naphthalene, where XX are the last two digits of your Student ID.