9.1: Schedule Compression
Notes
Video 9.2: Fast Tracking
Video 9.3: Laddering
Fill in the missing task names below after watching the video on Laddering.
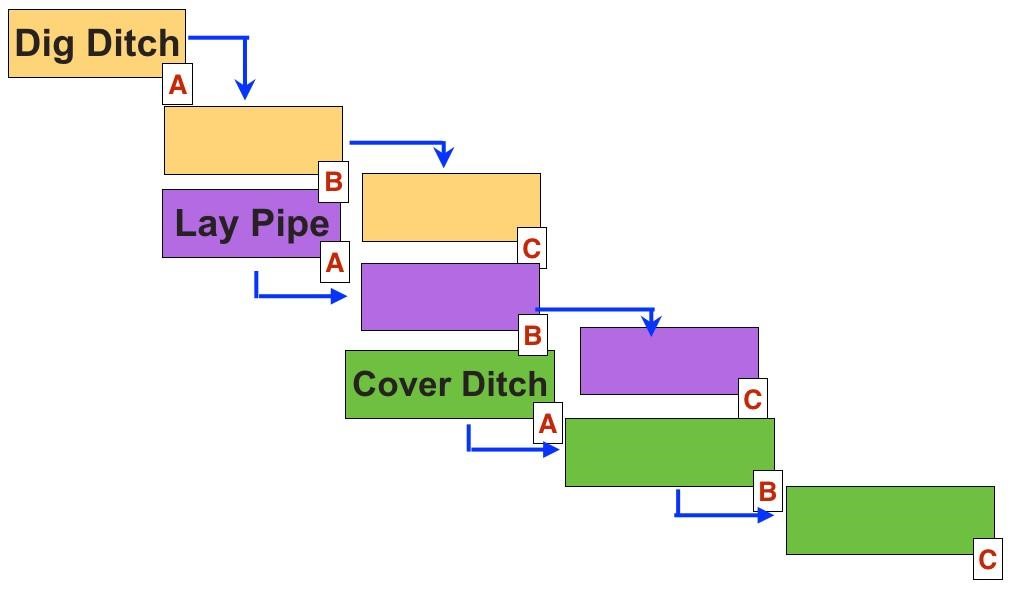
Assuming the time for all tasks are 1 week (Dig Ditch A, Dig Ditch B, Cover Ditch A, etc) and if laddering was not used, the project would take 9 weeks. With laddering, how long would it take?
Video 9.4: Crashing a Project
Check Your Knowledge
Questions: Reducing Project Duration
Exercise 1
You are given the following data about project tasks, network, and crash times/costs. Calculate the cost of the project at all time durations until you can no longer crash the project. All times are in days.
| ID | Direct Costs | Slope | Maximum Crash Time | |||
| Normal | Crash | |||||
| Time | Cost | Time | Cost | |||
| A | 5 | $500 | 4 | $600 | $100 | 1 |
| B | 10 | $1,200 | 6 | $2,000 | $200 | 4 |
| C | 13 | $3,600 | 11 | $4,800 | $600 | 2 |
| D | 13 | $300 | 11 | $600 | $150 | 2 |
| E | 5 | $1,000 | 4 | $1,400 | $400 | 1 |
| F | 10 | $2,400 | 8 | $5,400 | $1,500 | 2 |
| G | 5 | $700 | 5 | $700 | $0 | 0 |
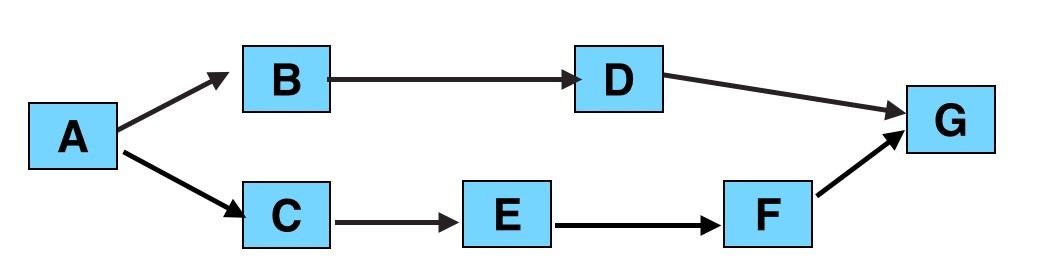
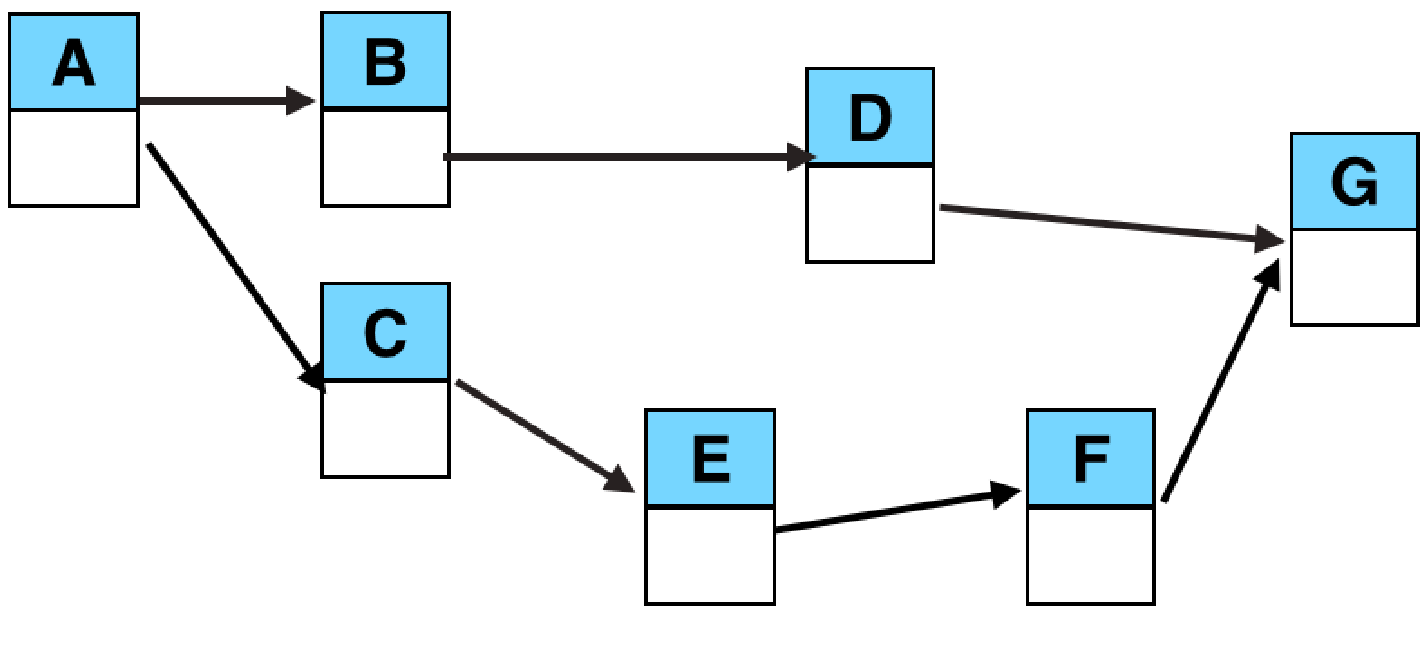
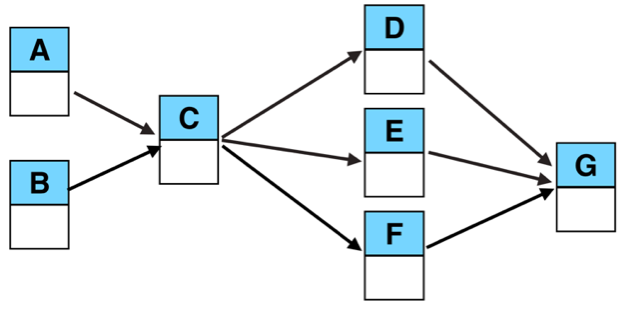
Exercise 1.B: Initial Network
Calculate the critical path(s) and the direct costs of this project:
Duration:
Critical Path 2:
Duration:
Project Duration:
Total Direct Costs:
Exercise 1.C: Crashing
If possible, calculate the critical path(s) and the costs of crashing this project by 1 day:
Duration:
Critical Path 2:
Duration:
Project Duration:
Normal Duration Direct Costs:
Additional Costs of Crashing:
Total Cost at this time period:
Repeat these calculations until the project can no longer be crashed.
Exercise 1.D: Total Costs
Record the direct costs that you calculated at each duration in the table below. Calculate the total project costs (figuring in the $500 per day incentive to finish early) at the various time periods.
| Initial Dur | -1 | -2 | -3 | -4 | -5 | -6 | -7 | |
| Project Duration | ||||||||
| Total Direct Costs | ||||||||
| Incentives ($500 per day that project is delivered early) | – | |||||||
| TOTAL COSTS |
What is the optimum time period in terms of total cost?
Exercise 2
You are given the following data about the project tasks, network, and crash times/costs.
Calculate the cost of the project at all time durations until you can no longer crash the project.
| ID | Direct costs | Slope | Maximum Crash Time | |||
| Normal | Crash | |||||
| Time | Cost | Time | Cost | |||
| A | 10 | $5,000 | 10 | $5,000 | $0 | 0 |
| B | 12 | $1,200 | 11 | $1,300 | $100 | 1 |
| C | 11 | $3,600 | 9 | $4,800 | $600 | 2 |
| D | 5 | $300 | 4 | $600 | $300 | 1 |
| E | 8 | $1,000 | 6 | $2,000 | $500 | 2 |
| F | 9 | $2,400 | 7 | $5,400 | $1,500 | 2 |
| G | 8 | $700 | 7 | $1,000 | $300 | 1 |
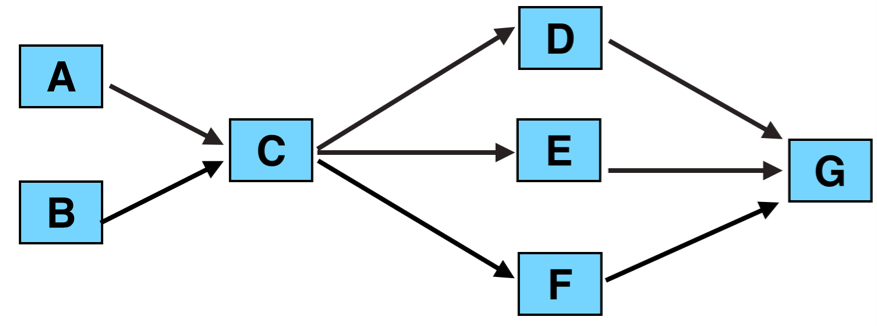
Exercise 2.B: Initial Network
Calculate the critical path(s) and the direct costs of this project:
Project Duration:
Total Direct Costs:
Exercise 2.C: Crashing
If possible, calculate the critical path(s) and the costs of crashing this project by 1 day:
Project Duration:
Normal Duration Direct Costs:
Additional Costs of Crashing:
Total Cost at this time period:
Repeat these calculations until the project can no longer be crashed.
Exercise 2.D: Total Costs
Record the direct costs that you calculated at each duration in the table below. Calculate the total project costs (figuring in indirect costs) at the various time periods.
| Initial Dur | -1 | -2 | -3 | -4 | -5 | -6 | -7 | |
| Project Duration | ||||||||
| Total Direct Costs | ||||||||
| Indirect Costs | $3,000 | $2,500 | $2,000 | $1,500 | $1,000 | $500 | $250 | $0 |
| TOTAL COSTS |
What is the optimum time period in terms of total cost?
