Chapter 5 Answer Key
5.1: Choosing a Project
Matching: Choosing a Project
K – Projects that allow us to create something new and innovative
B – Projects that improve our current operations
J – Projects that must be done in order to comply with an industry or governmental regulation or standard
C – Direct costs, such as materials, labor, and equipment; Indirect costs, such as insurance and Project manager labor; Contingency funds and budgetary reserves
H – The loss of potential gain from other alternatives when one alternative is chosen
E – The estimated resale value of an asset at the end of its useful life
D – A cost that has already been incurred and cannot be recovered
F – A financial estimate of the project and operating costs over the lifetime of a product
G – A project considered (perhaps unreasonably) immune from question or criticism
I – A group of experts review a project proposal by pointing out its flaws and weaknesses
A – Mathematically intensive means of analyzing a series of projects and are not easily generalized
5.3: Economic Scoring Models
Economic Model Comparison Tables
Payback
| Formula for Calculating | 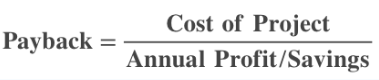 |
| How is result of formula expressed? |
|
| Advantages |
|
| Disadvantages |
|
| Notes |
|
Net Present Value
| Formula for Calculating | 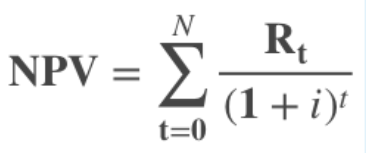 |
| How is result of formula expressed? |
|
| Advantages |
|
| Disadvantages |
|
| Notes |
|
Internal Rate of Return
| Formula for Calculating | Can vary by organization, but can use the following for a basic calculation: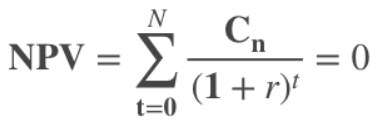 |
| How is result of formula expressed? |
|
| Advantages |
|
| Disadvantages |
|
| Notes |
|
Benefit to Cost Ratio
| Formula for Calculating | 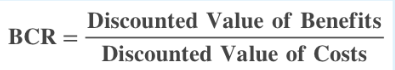 |
| How is result of formula expressed? |
|
| Advantages? |
|
| Disadvantages? |
|
| Notes |
|
Questions: Economic Scoring Models
1. 8 years, seven months
2. Project D
3. Not enough data to answer
4. Project D with a BCR of 1.99
5. Discount Rate, Capital Costs, Annual Cash inflows
6. Project D with an IRR of 8%
7. As percentage representing a Rate of Return
8. As an amount of dollars that the project will generate in terms of present day value
9. As the number of years until the project makes as much as it costs
10. As a ratio of Benefits to Costs
11. Project Vitamin E (NPV calculations are as follows:)
| Vitamin D Project | ||||
| Discount Rate | 9% | |||
| Year | Capital Costs | Annual Savings (non discounted) | Annual Savings (discounted) | Return on Investment |
| 0 | -$45,000.00 | -$45,000.00 | -$45,000.00 | |
| 1 | $23,500.00 | $21,559.63 | -$23,440.37 | |
| 2 | $23,500.00 | $19,779.48 | -$3,660.89 | |
| 3 | $23,500.00 | $18,146.31 | $14,485.42 | |
| 4 | $23,500.00 | $16,647.99 | $31,133.42 | |
| 5 | $23,500.00 | $15,273.39 | $46,406.80 | |
| Vitamin C Project | ||||
| Discount Rate | 9% | |||
| Year | Capital Costs | Annual Savings (non discounted) | Annual Savings (discounted) | Return on Investment |
| 0 | -$37,500.00 | -$37,500.00 | -$37,500.00 | |
| 1 | $15,000.00 | $13,761.47 | -$23,738.53 | |
| 2 | $15,000.00 | $12,625.20 | -$11,113.33 | |
| 3 | $15,000.00 | $11,582.75 | $469.42 | |
| 4 | $15,000.00 | $10,626.38 | $11,095.80 | |
| 5 | $15,000.00 | $9,748.97 | $20,844.77 | |
| Vitamin A Project | ||||
| Discount Rate | 9% | |||
| Year | Capital Costs | Annual Savings (non discounted) | Annual Savings (discounted) | Return on Investment |
| 0 | -$23,000.00 | -$23,000.00 | -$23,000.00 | |
| 1 | $11,000.00 | $10,091.74 | -$12,908.26 | |
| 2 | $11,000.00 | $9,258.48 | -$3,649.78 | |
| 3 | $11,000.00 | $8,494.02 | $4,844.24 | |
| 4 | $11,000.00 | $7,792.68 | $12,636.92 | |
| 5 | $11,000.00 | $7,149.25 | $19,786.16 | |
| Vitamin E Project | ||||
| Discount Rate | 9% | |||
| Year | Capital Costs | Annual Savings (non discounted) | Annual Savings (discounted) | Return on Investment |
| 0 | -$51,500.00 | -$51,500.00 | -$51,500.00 | |
| 1 | $27,600.00 | $25,321.10 | -$26,178.90 | |
| 2 | $27,600.00 | $23,230.37 | -$2,948.53 | |
| 3 | $27,600.00 | $21,312.26 | $18,363.73 | |
| 4 | $27,600.00 | $19,552.54 | $37,916.27 | |
| 5 | $27,600.00 | $17,938.11 | $55,854.37 | |
