Chapter 7 Answer Key
7.1: Resource Estimation
Questions: Resource Estimation
1. A 20,000 square foot hospital addition will cost $4.2 million based on an industry average of $210 per square foot for this type of facility
2. False
3. False
4. False
5. False
6. False
7A. Answers will vary
7B. Answers will vary
7C. $375.00 + Shipping & Handling (Physical)
Matching: Time and Resource Estimation
E – Made at initiation of project, +/- 50 percent from the actual or final costs
G – The result of workers improving the processes they are using to complete their tasks
J – Deliberately padding your estimate so that you look good when the activity or project gets done sooner than estimated
B – Uses information from a previous project to estimate the cost of completing a similar project in the future
C – Used in project planning, -10 to +25 percent from the actual or final costs
I – What a project manager can use to solicit estimates from multiple estimators and then try to get those estimators to come to a consensus
B – Works well when “comparing apples to apples.”
F – Made by multiplying the size of a project by an established cost per unit
G – Can be calculated each time production doubles
H – -5 to +10 percent from the actual or final cost
A – A measure of the functionality that is programmed into an information system
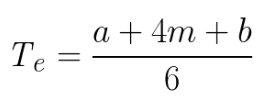
D – A weighted average that weights the most likely estimate more heavily
7.2: PERT Analysis
Questions: PERT
1A. An optimistic time estimate (if all goes well, what is the shortest time period one could realistically expect for the completion of this activity?). This will be designated in calculations as a.
1B. The most likely time estimate (if all goes normally, what is the average time one would expect it would take for an activity to be completed?). This will be designated in calculations as m.
1C. A pessimistic time time estimate (if work goes poorly, what is the longest time period one could realistically expect for the completion of this activity). This will be designated in calculations as b.
2. 
3. The probability that a project will be completed within a given time period.
Exercise: PERT Analysis
1. 158 days
2. 52.40 percent
3. 167 days
4. 9-10 days

