Vol. 1, No. 2 (December 2023)
Statistical Process Control at Hi-Tech Surfactants
Ravi Sharma; Fatih Yegul; and Jane Gravill
All figures in U.S. dollars and Indian Rupees unless otherwise noted.
Harsh Bhardwaj, Managing Director of Hi-Tech Surfactants Pvt Ltd. (HTS) in India, met in person with a team of three professors, Ravi Sharma, Fatih Yegul, and Jane Gravill, at Conestoga College in Canada on October 17, 2022. Professor Sharma, who was also a management consultant, had been invited by Bhardwaj to review HTS’s processes, visit the plant in India, and suggest improvements. HTS manufactured Wheel brand laundry detergent powder as an outsource partner of Hindustan Unilever Limited (HUL), a subsidiary of Unilever.
At this final meeting, Sharma presented these findings on behalf of the team:
Based on the data provided by your quality team your packaging process is not capable of meeting the tolerances specified by HUL. The bags are being overfilled to overcome this issue and to prevent bag weights from falling below lower specification limits. For 1 kg bags, the average weight is 1.53% more than that mentioned on the bags. For budgeted output of 55,000 tons, this means an excess usage of 841,500 kg of materials (Rs 33,660,000[1] per year at Rs 40/kg).
Professor Yegul then described the concept of statistical process control (SPC) and suggested to Bhardwaj that, “implementation of SPC will help in better control on the process variations and timely reviews of process capability and will minimize excess usage of material.”
Professor Gravill also highlighted the importance of reducing material usage to support sustainability. Bhardwaj recalled that his executives were very satisfied with the process controls and quality systems and that the allowance for material wastage set by HUL was not exceeded. Any more savings on material usage would benefit HUL but bring no financial benefit to HTS.
Bhardwaj had to decide. He could discuss the matter with HUL — even seek their help in implementing SPC — support the sustainability initiatives and negotiate to share the financial benefits. The other option was to maintain the status quo and operate within the allowed level of wastage. He could also ask for more analyses over longer periods and postpone the decision.
Industry Background
The laundry detergent industry was dominated globally by two multinational giants Unilever PLC — with popular brands Sunlight and Surf — and Proctor & Gamble Co. — with popular brands Tide and Gain. Unilever PLC was a British multinational consumer goods company headquartered in London, United Kingdom, with an annual sale of €52 billion, operating in 190 countries, employing 149,000 people, and with a mission to make sustainable living commonplace. Unilever was committed to making a continuous impact in the management of the environment and to a longer-term goal of developing a sustainable business. As Unilever’s website stated: “We strive to do more good for our planet and our society – not just less harm.”[2]
In India, per capita detergent consumption was 2.7 kg, as compared to around 10 kg in the United States. According to a report from Bonafide Research, due to the increase in population, urbanization, education, and the rising level of income and consumption, the overall detergent demand growth in India was 10% annually.[3] This growing demand was being serviced by HUL with Surf for high-end markets and Wheel for the lower-end. Proctor & Gamble in India has brands like Tide and Ariel. There were a few other popular brands competing with them — Nirma, Ghadi, and Ezee.
According to it’s 2023 annual report, HUL was the largest fast-moving consumer goods company in India and nine out of 10 Indian households were using HUL products.[4] The company had a wide range of products and brands including food (Horlicks, Boost, Knorr), homecare (Surf, Vim, Sunlight, Wheel), personal care (Dove, Ponds, Lakme), and refreshments (Lipton Tea, BRU coffee). “HUL is committed to establishing mutually beneficial relations with our suppliers, customers and business partners. We want to work with third parties who have values similar to our own and work to the same standards.,” stated the HUL website.[5] HUL had 21,000 employees and annual sales of Rs. 453,110,000,000 (approx. $5.48 billion).
Hi-Tech Surfactants Pvt Ltd. (HTS) was established in 1990 with a manufacturing facility in Sikandrabad, Uttar Pradesh, India (about 65 Km from Delhi), as an outsource supply-chain partner (a contract manufacturer) for HUL. HTS manufactured Active Wheel 2-in-1 brand detergent powder (Wheel) which, according to the HUL website, “is trusted by over 160 million Indian households for domestic clothes washing. Active Wheel comes packed with the power of real lemons and flowers; it removes visible dirt and kills invisible bacteria and leaves behind a trail of floral freshness. It is a dominant player in the mass fabric wash segment.”[6]
HTS employed approximately two hundred people and operated three shifts per day, six days a week. Maintenance was scheduled on Sundays. The investments in the large facility in a 10,000 square metre area and the high-end equipment gave HTS a design capacity of 65,000 tonnes per year. A brief prepared by HTS for presentation to visiting managers for HUL stated:
HTS is committed to winning the trust and confidence of HUL. We continuously change our pace with [the] changing environment. We ensure that these values percolate to all levels of our organization. We are proud to convey that employee turnover at HTS is almost nil in [the] last two decades. The congenial atmosphere and the rapport between the workforce and the management are attributable to this achievement.[7]
Stakeholders and Differing Perspectives
Wing Commander Bhardwaj, holder of a VSM (Vishisht Seva Medal — awarded by the president of India for distinguished service of high order in the armed forces), took a premature release from the Indian Airforce. He took pride in acquiring Hi-Tech Surfactants (HTS), an unprofitable business, and turning it into a profitable enterprise. When Sharma asked him during one of their previous meetings about the secret of his success, Bhardwaj replied:
Whatever challenge or task I begin, I aim to achieve the best. I keep the goal in mind and take the workers along. I believe more in leading than in managing. I care for the well-being of all the workers, and my door is always open. I adhere to rigorous discipline, inculcated during my air force days. I aim for the best and always see room for continuous improvement.
Bhardwaj’s son, Gaurav Bhardwaj (Bhardwaj Jr.) had completed a degree in hotel management and was further trained in management at ITC Hotels — a premier five-star hotel group. After a few years in the United States, he returned home to India and joined HTS. When Sharma started his consultation, Bhardwaj explained that “Bhardwaj Jr. is the executive director, and his knowledge of IT, finance, budgeting, operations, and quality is an asset to HTS.” See Exhibit 1 – HTS Organization Chart.
When Sharma visited HTS in late 2021, he was given a guided tour of the plant. Bhardwaj introduced him to the executive team:
Gentlemen, I have invited Professor Sharma to review our systems with a fresh pair of eyes, an independent consultant’s perspective, and suggest improvements to our quality and productivity.
Bhardwaj Jr. explained to Sharma:
We have the support of our principals, HUL. We implement systems and procedures under their guidance. We have an exhaustive quality control (QC) manual that we follow. There is a plethora of checks ranging from online checks, 24 hours in three shifts, every hour, to offline checks every shift, daily and weekly.
Shukla, the director, added:
HUL has umda[8] systems, and we follow them rigorously. Quality and process audits are done annually by British Retail Consortium (BRC) auditors — SGS, on behalf of HUL. Last year we received an AA rating in the audit. (See Exhibit 2 – BRC Certificate from SGS – AA Grade).
Bhardwaj then commented:
HUL has elaborate KPI[9] measures to monitor our efficiency, productivity, quality, and delivery [Exhibit 3 – KPI Report for April to June 2021]. HUL often raises the bar and demands better performance. To strengthen our relationship with HUL and have an edge over our competition, we need to innovate and improve continuously.
HUL had specified tight tolerances on the weights of each package (see Exhibit 4 – Product SKUs Specifications). During his visit to the facility, Sharma asked if all the packaging lines could meet the specifications. Bhardwaj Jr. replied that customer complaints were not an issue and added that they checked quality at every stage of the process. Sharma then asked if they had done any studies to assess the process capabilities statistically. Bhardwaj replied,
We have not, but if you can guide us, we would like to assess the capability of all our lines. It will help us in decisions of major overhaul or replacement of the lines.
Sharma explained statistical process control (SPC) to the team at HTS and suggested that they could implement it to ensure that the weights of detergent packs were at target levels and that variations were minimal. SPC could prevent excess material usage over the specified and help avoid related cost allowances (Exhibit 5 – Loss Allowances). Sharma also mentioned total quality management (TQM) and Six Sigma concepts, as well as target-oriented quality. He explained that these concepts were designed to not only improve quality but also minimize the “loss to society” and support sustainability. Bhardwaj agreed that the SPC and TQM concepts made sense, especially considering that Unilever’s and HUL’s missions valued sustainability, and these approaches were aligned with HTS’s efforts to minimize resource usage and support the environment.
HTS’s Manufacturing Process and the Challenge
HTS had a continuous process to manufacture, fill, seal, package, and ship four assorted sizes of SKUs[10] of Wheel packages to the HUL depots and its wholesale partners (re-distribution stockists). HUL drop-shipped raw materials and packaging materials at HTS. HUL also extended systems and procedures support for all aspects of the management, including the process, planning, and quality. A HUL representative was on-site full-time to support the success of the partnership.
Pre-printed PVC (polyvinyl chloride) film for packaging was received in rolls. Based on the production schedules, inkjet printing was done on these to show the SKU, the maximum retail price, and traceability information of the date and machine (see Video 1).
Video 1: HTS Pre-Printing of Packaging Film
Source: Sharma, R. (2022, April 7). HTS pre-printing of packaging film.[Video]. Youtube. https://www.youtube.com/watch?v=pq_7HsCdtqQ
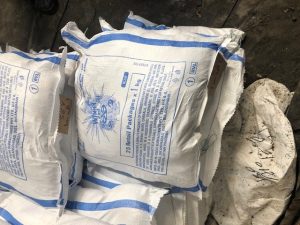
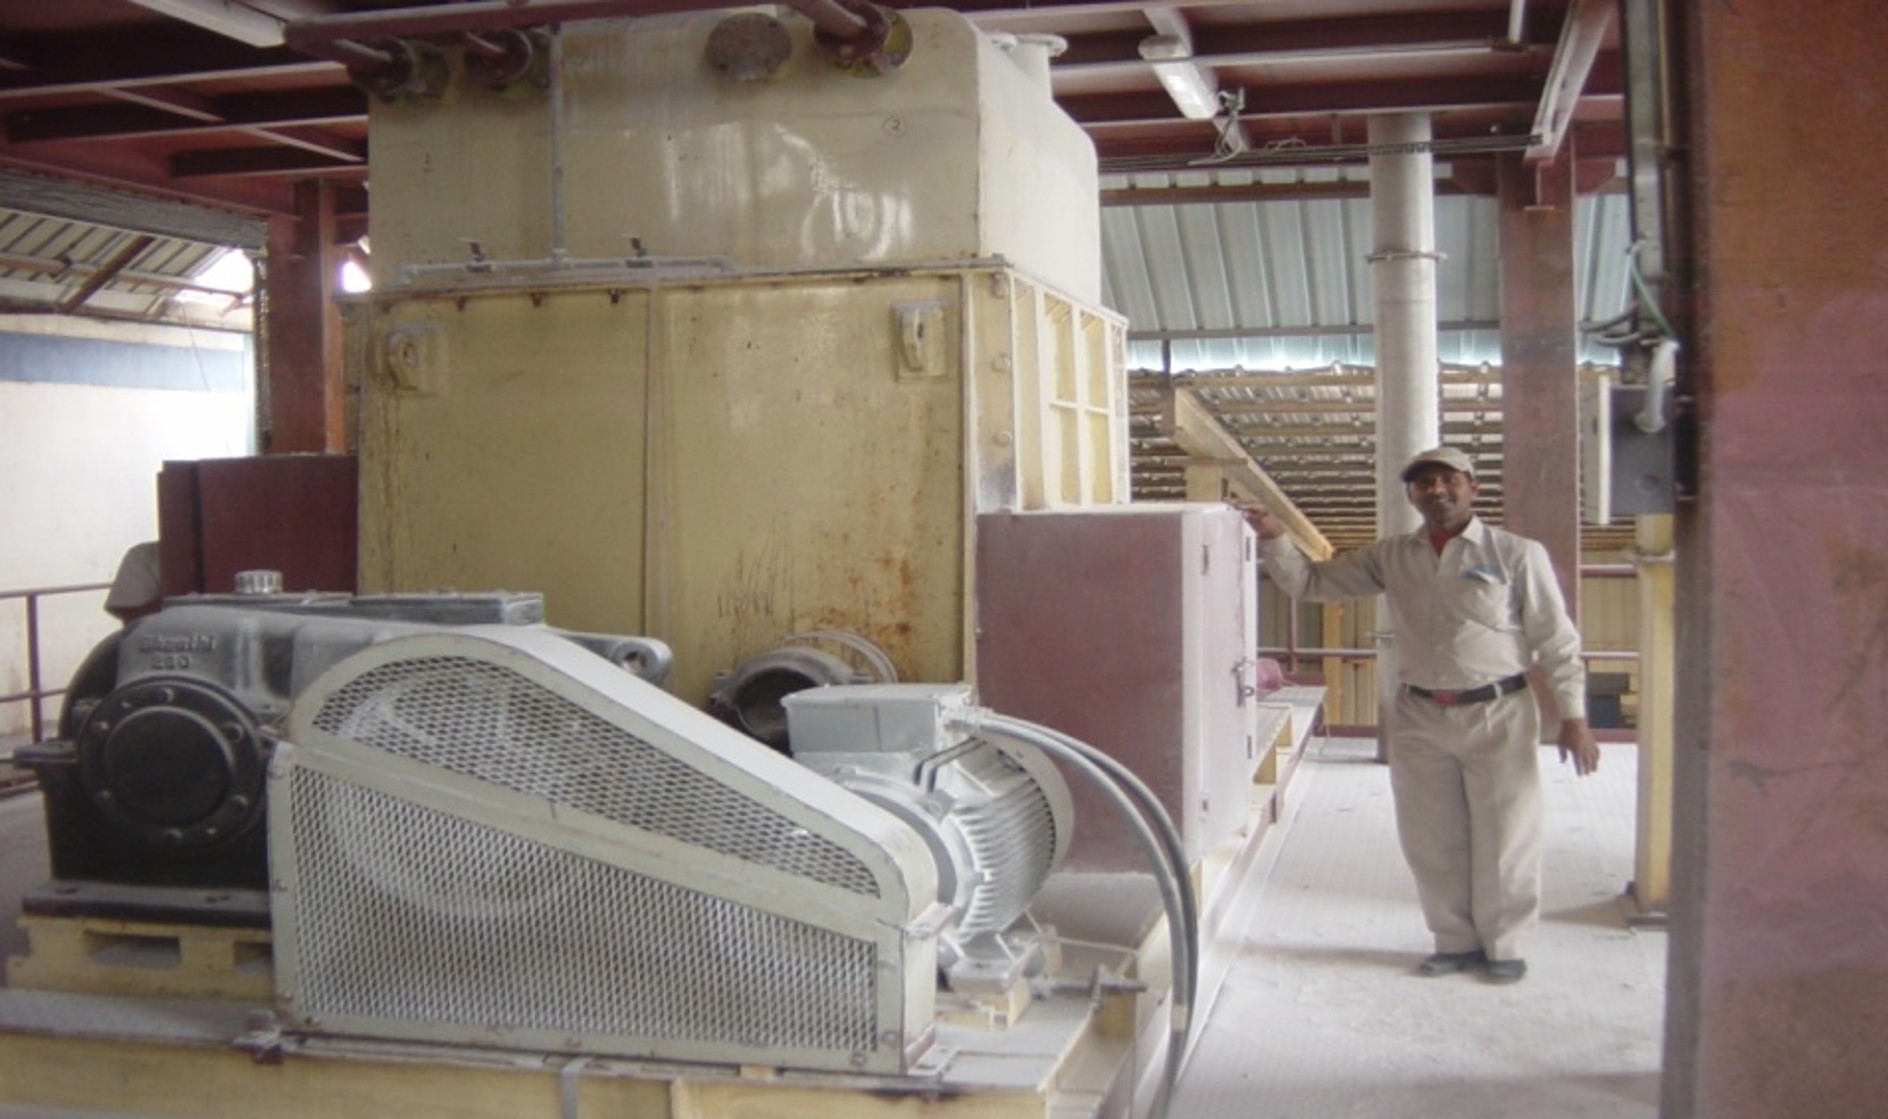
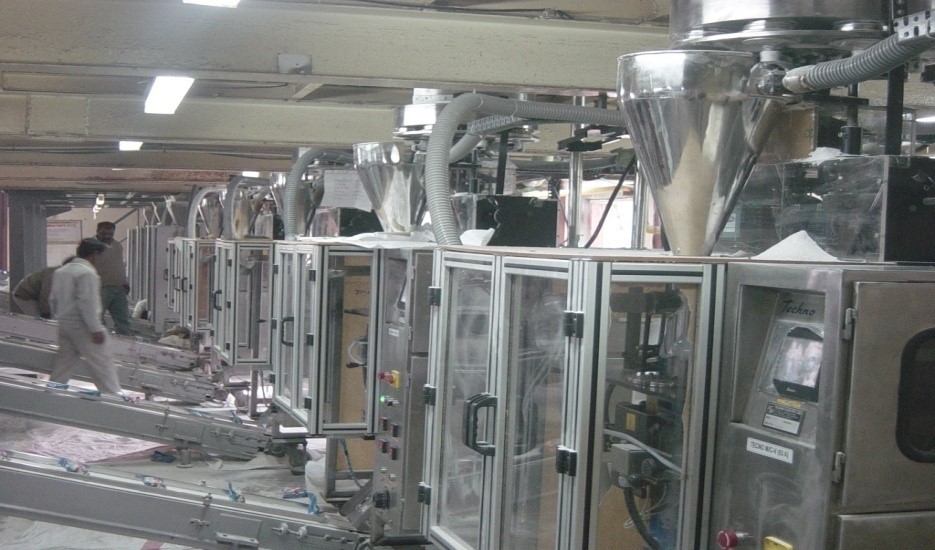
The raw materials (about fifteen different ingredients) in the form of solids, powders, and some liquids were received, checked for quality, and stored. The process began at industrial vibratory sieves that filtered the raw materials. The materials were then mixed in central sigma mixers (see Exhibit 6 – HTS Photo 3) according to the bill of materials (recipe) in lots of approximately 2000 kg each. The next stage for the material was shearing in the cage mill and passing through more sieves. After this, the detergent was ready for packaging and stored as work-in-process in 800 to 900 kg bags. These work-in-process bags were conveyed to the packaging machines (see Videos 2 and 3), which used pre-printed packaging film (PVC) to fill and seal the detergent sachets.
Video 2: HTS Packaging Line Large Packs
Source: Sharma, R. (2022, April 7). HTS packaging line large packs.[Video]. Youtube. https://www.youtube.com/watch?v=bkVn25F2a3U
Video 3: HTS Packaging Line Small Packs
Source: Sharma, R. (2022, April 7). HTS packaging line small packs. [Video]. Youtube. https://www.youtube.com/watch?v=Pl9TH_lPjfo
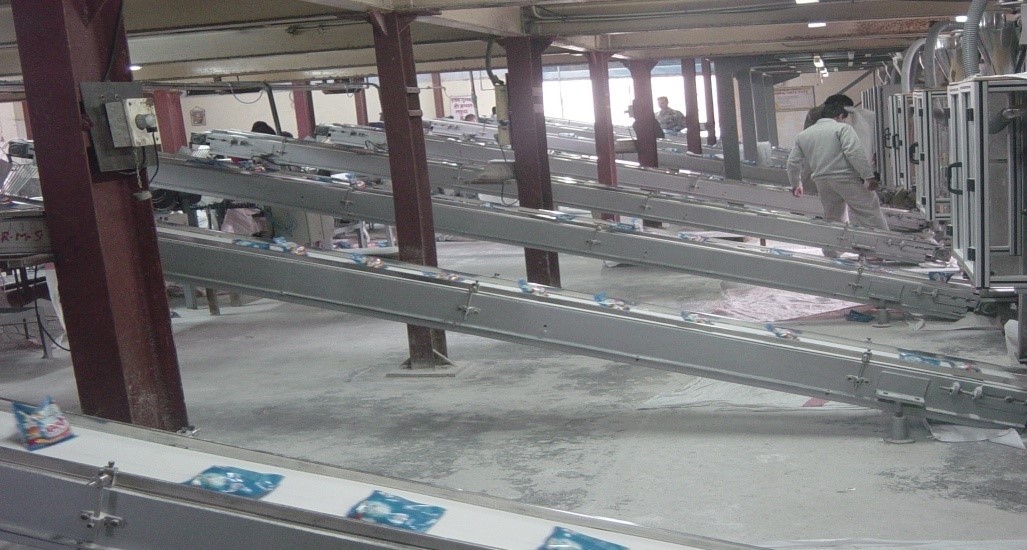
These sachets moved on conveyors up to the bagging stations (see Exhibit 6 – HTS Photo 6), where the sachets were counted and placed in larger bags known as gunny bags. Then the bags moved on the main conveyor, were stitched, weighed, and labelled (inkjet printed). They were then stacked on pallets and sent to the finished goods storage for onward shipment (see Exhibit 6 – HTS Photo 2).
HUL was linked with HTS by the enterprise resource planning (ERP) system called SAP. Weekly plans for production and delivery for each SKU were loaded every Friday. SAP also kept track of incoming materials and products shipped, as well as the operating efficiency. Blending formulae (recipes) were also controlled by HUL via SAP. The material requirement planning (MRP) system in SAP generated purchase orders and schedules for vendors of raw materials and packaging materials.
HTS’s quality department checked the quality of incoming materials and subsequently at every stage of production. HUL gave HTS a quality manual, which was followed strictly in every detail. Prior to packaging, samples were checked to ensure product integrity. At the packaging stage, the operator picked five random samples every 15 minutes to visually inspect and weigh them. The packaging lines were also equipped with automatic photo inspection against misalignment in the two sides of the pre-printed film that is used to make the sachets. The larger shipping bags (gunny bags) were weighed 100%[11] before being labelled for shipment. The weight measurements for sachets and the shipping bags were digital and automatically recorded on a computer. Quality issues encountered in every shift were recorded, and rejected samples were viewed and discussed in a daily quality meeting. Action points were noted in the minutes of the meeting (see Exhibit 7 – Sample of Minutes from a QC Meeting). The finished products in gunny bags, ready to ship, were also checked at random. A gunny bag would be cut open and the individual sachets inspected. The results were kept in defect incident reports (see Exhibit 8 QC Defect Data Year 2021 and Exhibit 9 – Rejection data (Period January to December 2021)).
Weight variation, leakers, misaligned packaging, etc., were some common reasons for rejection. Inspection results were classified into three categories: green, yellow, and red. Green indicated the product was within acceptable limits and would proceed for shipment. Yellow needed further inspection to determine the action. Red would warrant stopping the line and fixing the problem. If the product rejected was in the red zone, all the products produced during the 15 minutes prior to the production of that product would be fully inspected. Rejected sachets were cut, and the product was retrieved and mixed with the next production batch within prescribed percentage limits. Costs of the packaging inspected material were written off, and the labour and production cost of reworking rejects needed to be considered.
When touring the plant, Sharma asked if there were any quality issues with the blending recipe (bill of materials), and Bhardwaj Jr. responded:
As a matter of fact, we had an issue recently. The HUL team made changes to the blending formula in SAP system. The change was not communicated to the shop floor, and one shift produced the mix with the old recipe. It had to be reworked to make the correction. This happened only once, and it was due to a key staff member working from home because of the COVID-19 pandemic.
Every year HUL and HTS negotiated terms based on forecasts and budgets (in 2020, the budget was for 55,000 metric tons; however, the actual output was 48,000 metric tons). HTS was paid a fixed amount for overheads based on budgets. Additionally, there was a variable cost per metric ton of production, payable to HTS. As Bhardwaj Jr. explained:
There is an agreed wastage allowance for raw materials and packaging materials. If more materials were used, due to excess wastage, HTS must pay for it. However, we do not benefit if our wastage is reduced below the allowed limits. Such material savings benefit HUL.
According to Bhardwaj Jr., during the three quarters beginning April 2021 to Dec 2021, the amount paid back due to excess usage of materials was just Rs 14,000 (approx. $170), and production during this period was 33,875 metric tonnes.
HTS was committed to environmental protection, sustainability, and workers’ health and safety. As Bhardwaj explained to Sharma: “We harvest rainwater, have installed a network of fire hydrants in the plant, have systems for dust and noise control, maintain oxygen levels in the plant, [and] provide reverse osmosis treated drinking water and health care to workers.”
Apart from HTS, several other competitors in the country operated as contract manufacturers for HUL to produce Wheel detergent. To maintain the share of the total business as a manufacturer, HTS not only had to meet the expectations of HUL’s KPIs but demonstrate innovation and excellence. The brief prepared for presentation to HUL executives stated,
Professional dedication and display of high order of initiatives received applause from all levels at HUL. HTS is the only contract manufacturer who found a mention in the HUL’s webcast.[12]
Bhardwaj’s Decision
During his visit, Sharma had suggested gathering data over two different shifts and noting the weights of sample sachets from two packaging lines – one for large packs and the other multitrack for small packs. The Saturday night shift and the Monday morning shift (after the weekly maintenance on Sunday) were selected. Data collection was smooth, as all weighing machine data was captured automatically in a computer linked to them (see Exhibit 10 – Process Data – Packaging Lines). This weight data was saved in the computer but not connected to the SAP system.
After completing his initial review, Sharma proposed:
Once we analyze the data using SPC tools, we will get a better understanding of the present situation in terms of process capability and process control. We can then decide if efforts and investment in implementing these tools on an ongoing basis are justified.
Bhardwaj Jr. was a bit skeptical:
Fresh perspectives to review the process and quality are always welcome. However, any proposal needs to pass the test of norms for the rate of return on investments (ROI). We operate at 16% ROI.
Sharma appreciated the comment; still, he was optimistic:
Since quality systems are already in place, implementing SPC may require only marginal additional effort. I understand that SAP has a module for carrying out SPC computations. Alternatively, other off-the-shelf SPC software could also be used.
Sharma’s market research had also revealed that stand-alone SPC software packages were available at approximately $3000 per year. This would be a viable alternative if HTS could not utilize SAP’s SPC module due to the complexity of the coordination required with HUL.
Bhardwaj needed to decide if a system for routine statistical analysis of their processes to assess their capabilities should be implemented. He was aware that the executive team believed that the process and quality systems were working well, and the company was meeting HUL’s expectations. After all, the popular saying, “If it ain’t broke, don’t fix it,” was supported with sound reasoning, especially from a financial perspective. Bhardwaj had also sensed a reluctance from his team to make changes, a complacency that pushed them to maintain the status quo. But he wanted HTS to excel.
At the end of his meeting in Canada, Bhardwaj was at a crossroads. Now that he had heard the full results of Sharma’s analysis and the recommendations from Yegul and Gravill, Bhardwaj had to decide which path to take.
Exhibits
Exhibit 1 – HTS Organization Chart
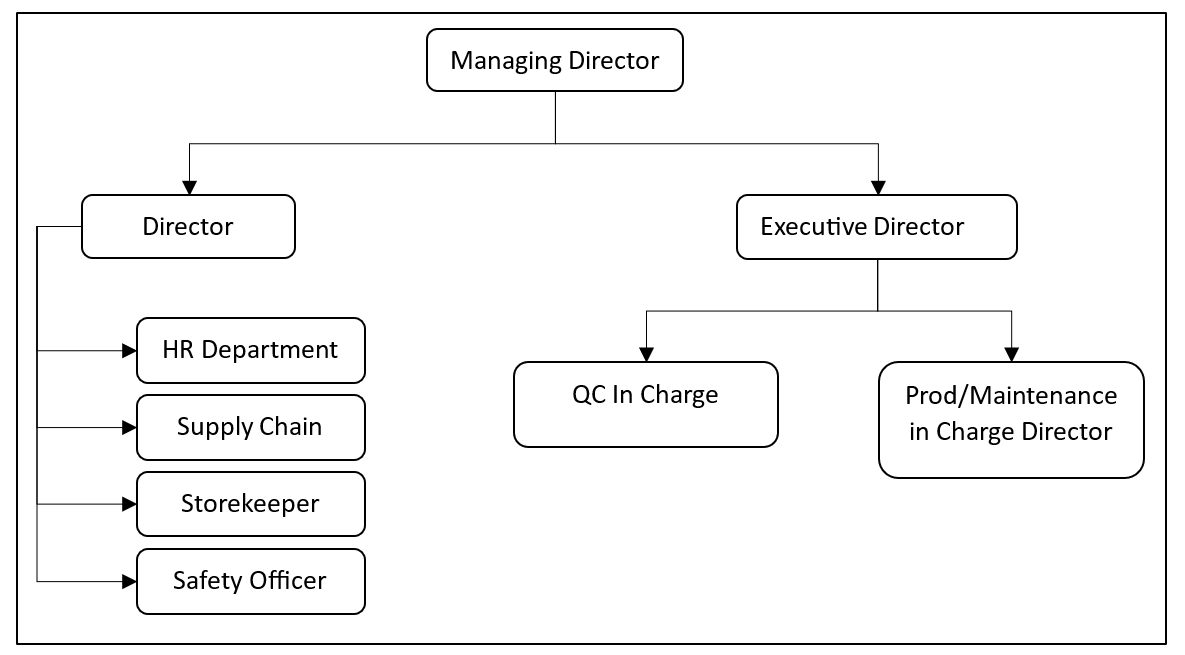
Exhibit 2 – BRC Certificate from SGS – AA Grade
![A photograph of a BRC Certificate [see image description]](https://ecampusontario.pressbooks.pub/app/uploads/sites/3000/2023/12/exhibit_1_2_5_2.png)
Exhibit 3 – KPI Report for April to June 2021
| Category | Description | Standard Score | Actual Score |
|---|---|---|---|
| World Class Service | Depot dispatch Compliance | 1 | 1 |
| blank | Output reliability compliance | 1 | 1 |
| Consumer Perceived Quality & Flawless Execution | WCM HH as applicable | 1 | 1 |
| blank | No of Depot Freezes | 1.5 | 1.5 |
| blank | DPMU | 1.5 | 1.5 |
| SHE | SHE MMS | 1 | 1 |
| E2E Competitive Cost | Productivity Improvement/Manpower/ wastage savings | 1 | 1 |
| Financial / Statutory /Hygiene | Compliance of CCP | 1 | 1 |
| blank | NCC/Cost actualization Data Submission within a month | 0.5 | 0.5 |
| blank | WC/EWS Data Submission within a month | 0.5 | 0.5 |
| Total score out of 10 | description not applicable | 10 | 10 |
Source: Data supplied by Hi-Tech Surfactants, Inc.
Exhibit 4 – Product SKUs Specifications
| SKU | Min | Max | Sales (2020) | Machine |
|---|---|---|---|---|
| 55g | 52.5g | 57.5g | 195MT | Akash |
| 115g | 111.55g | 118.5g | 4,405MT | Akash |
| 120g | 117g | 123g | 7,700MT | Akash |
| 500g | 490g | 510g | 5700MT | BoschTerra |
| 1000g | 990g | 1010g | 30,000MT | BoschTerra |
Source: Data supplied by Hi-Tech Surfactants, Inc.
Exhibit 5 – Loss Allowances
Supplier (HTS) shall bear the cost of components that exceed the applicable loss allowances below:
| Raw Materials Unit Name | Allowance |
|---|---|
| Perfume | 0.00% |
| Soda Ash | 0.25% |
| PCC | 0.25% |
| STPP | 0.25% |
| Sodium Silicate | 0.25% |
| Minerals | 0.25% |
| Calcite | 0.25% |
| Dolomite | 0.50% |
| China Clay | 0.25% |
| Colour | 0.25% |
| Salt | 0.50% |
| Speckles | 0.25% |
| Bluton C | 0.25% |
| All other chemicals | 0.25% |
| Packaging Materials Unit Name | Allowance |
| Pouches, Laminate & Wrapper | 2.00% |
| Sacks | 0.00% |
| Over-Packing Allowance (Powder) | Allowance |
| 0 to 29g | 3.00% |
| 30 to 199g | 1.50% |
| 200-499g | 1.00% |
| 500g & above | 0.50% |
Source: Data supplied by Hi-Tech Surfactants, Inc.
Exhibit 6 – HTS Photos
-

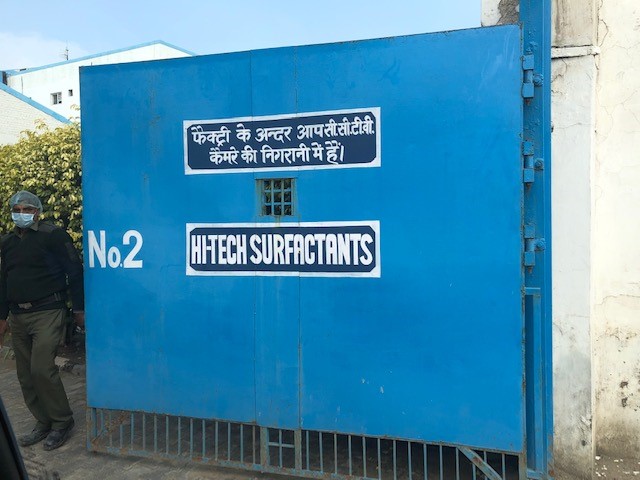
- Photo 1 – Gate 2. Credit: © Ravi Sharma. All rights reserved. Used with permission.
-
- Photo 2 – Finished Product. Credit: © Ravi Sharma. All rights reserved. Used with permission.

-

- Photo 3 – Mixer. Credit: © Hi-Tech Surfactants Pvt Ltd. All rights reserved. Used with permission.
-

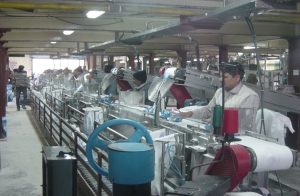
- Photo 4 – Packing Station (a). Credit: © Hi-Tech Surfactants Pvt Ltd. All rights reserved. Used with permission.
-

- Photo 5 – Packing Station (b). Credit: © Hi-Tech Surfactants Pvt Ltd. All rights reserved. Used with permission.
-
- Photo 6 – Bagging Line. Credit: © Hi-Tech Surfactants Pvt Ltd. All rights reserved. Used with permission.

Exhibit 7 – Sample of Minutes from a QC Meeting – Dated March 9, 2022
| Number | Issue | Root cause analysis (RCA) | Corrective and preventive action (CAPA) |
|---|---|---|---|
| 1 | White line all SKUs found approx 3MM with eye mark out problem | Machine part tear & wear | Machine overhauling |
| 2 | Powder spillage on machine | Machine hopper gap observed | Gap to be covered |
| 3 | S/Acid digital indicator U/S inform (23.07.2019) to RKS | Indicator U/S | PO given for the new indicator |
| 4 | Speckles leakage from system | System not properly set | System has been set |
| 5 | Broomstick used in packing, process, RM Godown | Broom Stick used | Stopped |
| 7 | FG de-rap material not sieved regularly | Not done | Now being done |
| 8 | RM not weighment properly | Not done | Not proper weighment |
| 9 | Eye mark out on Bosch machines | Not done | Corrected |
| 10 | Overpacking all SKUs | Oversight | M/C no 3 done, M/C no 1 & 2 WIP |
Source: Data supplied by Hi-Tech Surfactants, Inc.
Exhibit 8 – QC Defect Data Year 2021
| SKUs | Defects total | Under weight | Leaker | White line | Lumps | Damage | Large pinhole | Off centre | Drop test fail | Weak perforation |
|---|---|---|---|---|---|---|---|---|---|---|
| 1Kg | 83 | 29 | 24 | 12 | 8 | 6 | 2 | 1 | 1 | n/a |
| 500gm | 23 | 4 | 5 | 7 | 3 | 2 | 2 | n/a | n/a | n/a |
| 150gm | 4 | 1 | 2 | n/a | n/a | 1 | n/a | n/a | n/a | n/a |
| 140gm | 8 | 4 | 4 | n/a | n/a | n/a | n/a | n/a | n/a | n/a |
| 130gm | 4 | 1 | 3 | n/a | n/a | n/a | n/a | n/a | n/a | n/a |
| 120gm | 12 | 6 | 6 | n/a | n/a | n/a | n/a | n/a | n/a | n/a |
| 60gm | 6 | 4 | n/a | n/a | n/a | n/a | n/a | n/a | n/a | 2 |
| 55gm | 5 | 3 | 2 | n/a | n/a | n/a | n/a | n/a | n/a | n/a |
| Total | 145 | 52 | 46 | 19 | 11 | 9 | 4 | 1 | 1 | 2 |
Grand Total: 290
Note: n/a stands for not applicable. In this table, n/a means that the defect did not occur on the corresponding SKU.
Source: Data supplied by Hi-Tech Surfactants, Inc.
Exhibit 9 – Rejection Data (Period January to December 2021)
| Description | Qty (Mt) |
|---|---|
| Total FG Production | 45968.000 |
| Total FG Hold | 1511.105 |
| Total FG Rejected | 4.404 |
Source: Data supplied by Hi-Tech Surfactants, Inc.
Exhibit 10 – Process Data – Packaging Lines
Table 1 – QC Data, Online Weight Checking (1kg SKU) for 28/02/2022 (Monday)
| Sample | Weight 1 (g) | Weight 2 (g) | Weight 3 (g) | Weight 4 (g) | Weight 5 (g) |
|---|---|---|---|---|---|
| 1 | 1014 | 1015 | 1018 | 1011 | 1010 |
| 2 | 1015 | 1021 | 1017 | 1019 | 1015 |
| 3 | 1014 | 1015 | 1018 | 1016 | 1011 |
| 4 | 1019 | 1028 | 1017 | 1014 | 1015 |
| 5 | 1014 | 1017 | 1019 | 1014 | 1018 |
| 6 | 1016 | 1011 | 1015 | 1018 | 1011 |
| 7 | 1019 | 1014 | 1018 | 1011 | 1017 |
| 8 | 1014 | 1018 | 1021 | 1014 | 1010 |
| 9 | 1017 | 1019 | 1021 | 1018 | 1014 |
| 10 | 1017 | 1019 | 1011 | 1014 | 1018 |
| 11 | 1017 | 1019 | 1014 | 1011 | 1017 |
| 12 | 1018 | 1011 | 1015 | 1014 | 1013 |
| 13 | 1016 | 1017 | 1014 | 1011 | 1017 |
| 14 | 1019 | 1011 | 1014 | 1029 | 1034 |
| 15 | 1048 | 1029 | 1019 | 1018 | 1014 |
| 16 | 1025 | 1017 | 1019 | 1018 | 1014 |
| 17 | 1017 | 1019 | 1011 | 1014 | 1013 |
| 18 | 1011 | 1015 | 1018 | 1014 | 1011 |
| 19 | 1013 | 1011 | 1014 | 1017 | 1015 |
| 20 | 1011 | 1017 | 1019 | 1011 | 1016 |
| 21 | 1013 | 1011 | 1006 | 1000 | 995 |
| 22 | 1001 | 1014 | 1011 | 1016 | 1015 |
| 23 | 1016 | 1018 | 1014 | 1017 | 1019 |
| 24 | 1024 | 1014 | 1018 | 1016 | 1011 |
| 25 | 1015 | 1018 | 1017 | 1019 | 1011 |
| 26 | 1016 | 1018 | 1015 | 1014 | 1017 |
| 27 | 1016 | 1018 | 1014 | 1017 | 1014 |
| 28 | 1000 | 1011 | 1002 | 1007 | 1014 |
| 29 | 1013 | 1014 | 1010 | 1015 | 1011 |
| 30 | 1017 | 1019 | 1018 | 1017 | 1015 |
| 31 | 1018 | 1011 | 1011 | 1017 | 1015 |
| 32 | 1018 | 1016 | 1011 | 1015 | 1011 |
Table Notes:
- Sample size is 5.
- Frequency of check is every 15 minutes.
- Acceptable weight for 1 kg SKU is minimum 990 g.
Source: Data supplied by Hi-Tech Surfactants, Inc.
Download: Exhibit 10 Table 1 in Excel [opens Excel file]
Table 2 – QC Data, Online Weight Checking (1kg SKU) for 05/03/2022 (Saturday)
| Sample | Weight 1 (g) | Weight 2 (g) | Weight 3 (g) | Weight 4 (g) | Weight 5 (g) |
|---|---|---|---|---|---|
| 1 | 1011 | 1020 | 1011 | 1014 | 1020 |
| 2 | 1011 | 1020 | 1001 | 1014 | 1020 |
| 3 | 1016 | 1014 | 1011 | 1010 | 1015 |
| 4 | 1020 | 1011 | 1004 | 1020 | 1013 |
| 5 | 1010 | 1010 | 1014 | 1010 | 1011 |
| 6 | 1014 | 1020 | 1011 | 1014 | 1020 |
| 7 | 1016 | 1020 | 1011 | 1014 | 1016 |
| 8 | 1018 | 1010 | 1020 | 1011 | 1014 |
| 9 | 1020 | 1014 | 1010 | 1016 | 1020 |
| 10 | 1017 | 1014 | 1000 | 1017 | 1020 |
| 11 | 1016 | 1000 | 1008 | 1020 | 1011 |
| 12 | 1020 | 1016 | 1010 | 1011 | 1020 |
| 13 | 1020 | 1031 | 1000 | 995 | 1011 |
| 14 | 1000 | 1011 | 1020 | 1011 | 1010 |
| 15 | 1031 | 1028 | 1014 | 1020 | 1011 |
| 16 | 1010 | 1011 | 1020 | 1011 | 1016 |
| 17 | 1026 | 1011 | 1010 | 1016 | 1020 |
| 18 | 1011 | 1020 | 1011 | 1028 | 1028 |
| 19 | 1026 | 1011 | 1003 | 1011 | 1014 |
| 20 | 1001 | 1021 | 1011 | 1010 | 1016 |
| 21 | 1010 | 1016 | 1003 | 1011 | 1020 |
| 22 | 1031 | 1026 | 1019 | 1020 | 1011 |
| 23 | 1020 | 1016 | 1010 | 1013 | 1020 |
| 24 | 1020 | 1014 | 1020 | 1030 | 1016 |
| 25 | 1000 | 1011 | 1026 | 1011 | 1014 |
| 26 | 1020 | 1011 | 1001 | 1011 | 1010 |
| 27 | 1016 | 1011 | 1020 | 1010 | 1014 |
| 28 | 1000 | 1011 | 1002 | 1007 | 1014 |
| 29 | 1010 | 1016 | 1020 | 1016 | 1010 |
| 30 | 1011 | 1016 | 1020 | 1014 | 1017 |
| 31 | 1010 | 1003 | 1020 | 1016 | 1014 |
| 32 | 1045 | 1010 | 1018 | 1020 | 1016 |
Table Notes:
- Sample size is 5.
- Frequency of check is every 15 minutes.
- Acceptable weight for 1 kg SKU is minimum 990 g.
Source: Data supplied by Hi-Tech Surfactants, Inc.
Download: Exhibit 10 Table 2 in Excel [opens Excel file]
Table 3 – QC Data, Online Weight Checking (1kg SKU) for 28/02/2022 (Monday)
| Sample | Weight 1 (g) | Weight 2 (g) | Weight 3 (g) | Weight 4 (g) | Weight 5 (g) |
|---|---|---|---|---|---|
| 1 | 116 | 119 | 118 | 115 | 116 |
| 2 | 119 | 121 | 115 | 118 | 116 |
| 3 | 116 | 119 | 121 | 115 | 118 |
| 4 | 118 | 116 | 119 | 117 | 119 |
| 5 | 115 | 117 | 119 | 118 | 116 |
| 6 | 117 | 115 | 118 | 116 | 117 |
| 7 | 119 | 121 | 118 | 116 | 117 |
| 8 | 115 | 118 | 116 | 119 | 118 |
| 9 | 118 | 117 | 116 | 121 | 115 |
| 10 | 118 | 122 | 120 | 117 | 119 |
| 11 | 121 | 115 | 118 | 116 | 119 |
| 12 | 121 | 115 | 118 | 116 | 121 |
| 13 | 116 | 116 | 118 | 117 | 119 |
| 14 | 121 | 115 | 118 | 116 | 114 |
| 15 | 115 | 117 | 119 | 118 | 116 |
| 16 | 119 | 121 | 115 | 118 | 116 |
| 17 | 118 | 115 | 117 | 119 | 116 |
| 18 | 119 | 118 | 117 | 121 | 115 |
| 19 | 118 | 117 | 121 | 115 | 118 |
| 20 | 117 | 119 | 121 | 118 | 116 |
| 21 | 116 | 119 | 121 | 118 | 116 |
| 22 | 120 | 122 | 125 | 118 | 116 |
| 23 | 119 | 121 | 116 | 118 | 115 |
| 24 | 118 | 116 | 120 | 115 | 117 |
| 25 | 118 | 117 | 119 | 121 | 115 |
| 26 | 118 | 117 | 119 | 121 | 115 |
| 27 | 118 | 117 | 119 | 121 | 115 |
| 28 | 118 | 117 | 119 | 121 | 116 |
| 29 | 118 | 117 | 119 | 121 | 116 |
| 30 | 118 | 115 | 117 | 119 | 121 |
| 31 | 116 | 118 | 117 | 116 | 118 |
| 32 | 115 | 117 | 119 | 121 | 116 |
Table Notes:
- Sample size is 5.
- Frequency of check is every 15 minutes.
- Acceptable weight for 1 kg SKU is minimum 990 g.
Source: Data supplied by Hi-Tech Surfactants, Inc.
Download: Exhibit 10 Table 3 in Excel [opens Excel file]
Table 4 – QC Data, Online Weight Checking (1kg SKU) for 05/03/2022 (Saturday)
| Sample | Weight 1 (g) | Weight 2 (g) | Weight 3 (g) | Weight 4 (g) | Weight 5 (g) |
|---|---|---|---|---|---|
| 1 | 116 | 118 | 119 | 120 | 116 |
| 2 | 115 | 120 | 116 | 115 | 120 |
| 3 | 116 | 115 | 120 | 118 | 115 |
| 4 | 120 | 116 | 115 | 121 | 116 |
| 5 | 118 | 118 | 119 | 120 | 114 |
| 6 | 115 | 120 | 116 | 115 | 120 |
| 7 | 116 | 115 | 120 | 115 | 120 |
| 8 | 116 | 115 | 121 | 116 | 119 |
| 9 | 120 | 116 | 118 | 120 | 115 |
| 10 | 115 | 120 | 116 | 115 | 120 |
| 11 | 116 | 115 | 120 | 118 | 115 |
| 12 | 117 | 115 | 120 | 116 | 124 |
| 13 | 118 | 117 | 120 | 116 | 115 |
| 14 | 120 | 116 | 118 | 119 | 121 |
| 15 | 121 | 116 | 115 | 120 | 116 |
| 16 | 115 | 120 | 116 | 115 | 120 |
| 17 | 118 | 120 | 116 | 115 | 126 |
| 18 | 116 | 122 | 115 | 116 | 115 |
| 19 | 120 | 116 | 118 | 119 | 120 |
| 20 | 116 | 115 | 120 | 116 | 115 |
| 21 | 120 | 116 | 115 | 119 | 120 |
| 22 | 116 | 114 | 118 | 119 | 120 |
| 23 | 115 | 115 | 120 | 116 | 115 |
| 24 | 120 | 116 | 115 | 120 | 118 |
| 25 | 120 | 116 | 115 | 120 | 116 |
| 26 | 115 | 121 | 116 | 115 | 120 |
| 27 | 118 | 117 | 118 | 119 | 114 |
| 28 | 116 | 115 | 120 | 116 | 115 |
| 29 | 120 | 116 | 115 | 117 | 121 |
| 30 | 120 | 116 | 115 | 121 | 118 |
| 31 | 115 | 120 | 116 | 120 | 118 |
| 32 | 115 | 120 | 116 | 115 | 120 |
Table Notes:
- Sample size is 5.
- Frequency of check is every 15 minutes.
- Acceptable weight for 1 kg SKU is minimum 990 g.
Source: Data supplied by Hi-Tech Surfactants, Inc.
Download: Exhibit 10 Table 4 in Excel [opens Excel file]
Image Descriptions
Exhibit 1 – HTS Organization Chart
An organization flow chart with three levels: the top level is Managing Director, which flows to the second level, which lists Director (left) and Executive Director (right), indicating they both report to the managing director. Director flows to the third level with HR Department, Supply Chain, Storekeeper, and Safety Officer, indicating these positions report to the Director. Executive Director flows to the third level with QC in Charge and Prod/Maintenance in Charge Director, indicating these positions report to the Executive Director.
[back]
Exhibit 2 – BRC Certificate from SGS – AA Grade
A photo of the certificate, which consists of two columns. The left and wider column includes the following legible text:
Certificate IN14/91407
This is to certify that
HI-TECH SURFACTANTS PVT. LTD
H- 5 & 6, Industrial Area, Sikandrabad, Dist – Bulandshahr (UP), Post-
203205, India
SITE CODE 2044187
Has been [illegible] as meeting the requirements of
Global Standard for Consumer Products
Personal Care and Household
Issue 4: November 2016
Evaluation Lovel: Higher Level
Achieved Grade: AA
Audit Programme: Remote
For the following activities
Manufacture of Dry Detergent Powder by process of mixing and filling
in laminates and packed in HOPE Sacks.
Product Categories: 7
Exclusions from scope: None
Date of Evaluation 18 March 2021
Certificate Issue Date 26 April 2021
Re-Evaluation Due Date: From 18 February 2022 to 15 March 2022
Certificate Expiry Date 23 April 2022
This is followed by a QR code with five lines of small text that is illegible and the text “Authorized by” and an indecipherable signature.
This is followed by six lines of small text that is illegible but appears to list SGS address and contact information and other details, including the text “Page 1 of 1”
The right column consists of the following logos and text:
SGS logo
SGS: BRC GS Process Certification logo
BRGS: Consumer Products Certificated logo
Auditor Number 20039
UKAS Product Certification logo
At the bottom of the image is a large icon of the globe on the left, with the letters SGS repeating across the certificate as they incrementally shift and change into the image of a bird with wings spread. This logo is followed by a paragraph of text that is too small to be legible.
[back]
References
Bonafide Research. (2022). India detergent market overview, 2022-2028. Product code: 1151027. https://www.giiresearch.com/report/bon1151027-india-detergent-market-overview.html
Hindustan Unilever Limited. (2023a). Active Wheel 2 in 1. https://www.hul.co.in/brands/home-care/wheel-hcbpc/
Hindustan Unilever Limited. (2023b). Business integrity. https://www.hul.co.in/planet-and-society/responsible-business/business-integrity/
Hindustan Unilever Limited. (2023c). Integrated annual report 2022-23. https://www.hul.co.in/files/92ui5egz/production/6a9122377e0712e70bfb04f0336bf84f84b518ef.pdf
Unilever. (2023). Our strategy. https://www.unilever.com/our-company/strategy/
Download a PDF copy of this case [PDF].
Read the Instructor’s Manual Abstract for this case.
How to cite this case: Sharma, R., Yegul, F. & Gravill, J. (2024). Statistical process control at Hi-Tech Surfactants. Open Access Teaching Case Journal, 1(2). https://doi.org/10.58067/g1f5-6t07
The Open Access Teaching Case Journal is a peer-reviewed, free to use, free to publish, open educational resource (OER) published with the support of the Conestoga College School of Business and the Case Research Development Program and is aligned with the school’s UN PRME objectives. Visit the OATCJ website [new tab] to learn more about how to submit a case or become a reviewer.
- The equivalent of $407,286, based on the exchange rate listed at www.xe.com on October 17, 2022. ↵
- Unilever, 2023. ↵
- Bonafide Research, 2022. ↵
- Hindustan Unilever Limited, 2023c. ↵
- Hindustan Unilever Limited, 2023b. ↵
- Hindustan Unilever Limited, 2023a. ↵
- Hi-Tech Surfactants, internal communication, n.d. ↵
- top class, excellent, in Hindi ↵
- key performance indicators ↵
- stock keeping units ↵
- each and every bag was weighed ↵
- Hi-Tech Surfactants, internal communication, n.d. ↵
