9 Week 9 Financial Statement and Ratio Analysis
Week 9 Financial Statement and Ratio Analysis
Introduction
 Learning Objectives
By the end of this week you will be able:
- Learn what ratio analysis is, how to conduct these calculations,
- Learn how to use the different types of ratios in decision-making; profitability, liquidity, debt, and efficiency
This chapter should take you 12.9 minutes to read and plus time to complete an In-Class Case Study.
Financial Statement Analysis
Now that you know a bit about financial statements, let’s see how they’re used to help owners, managers, investors, and creditors assess a firm’s performance and financial strength. You can glean a wealth of information from financial statements, but first you need to learn a few basic principles for “unlocking” it, like ratios.
But what are ratios and why are they important?
 Video Activity: 3 Minutes! Financial Ratio & Financial Analysis Explained & Financial Statement Analysis [2:54]
Ratio Analysis
How do you compare Apple’s financial results with those of other companies in your industry or with the other companies whose stock is available to investors? And what about your balance sheet? Are there relationships on this statement that also warrant investigation? These issues can be explored by using ratio analysis, a technique for evaluating a company’s financial performance.
Remember that a ratio is just one number divided by another, with the result expressing the relationship between the two numbers. It’s hard to learn much from just one ratio, or even a number of ratios covering the same period. Rather, the deeper value in ratio analysis lies in looking at the trend of ratios over time and in comparing the ratios for several time periods with those of other companies. There are a number of different ways to categorise financial ratios.
Here’s one set of categories:
Profitability ratios tell you how much profit is made relative to the amount invested (return on investment) or the amount sold (return on sales).
Liquidity ratios tell you how well positioned a company is to pay its bills in the near term. Liquidity refers to how quickly an asset can be turned into cash. For example, the share of stock is substantially more liquid than a building or a machine.
Debt ratios look at how much borrowing a company has done in order to finance the operations of the business. The more borrowing, the more risk a company has taken on, and so the less likely it would be for new lenders to approve loan applications.
To help you understand these ratios we will use financial statement examples from Apple Inc. 2017. We have also prepared a CRI460 Financial Ratios Summary sheet for you. You can access the summary sheet by clicking here.
Profitability Ratios
There are many different ratios that help measure profitability. Three good basic ratios to understand are, return on investment ,margins and earnings per share.
Return on Investment (ROI)
A key profitability ratio is your return on investment (ROI). When you put money into an investment or a business endeavour, ROI helps you understand how much profit or loss your investment has earned. Return on investment is a simple ratio that divides the net profit (or loss) from an investment by its cost. Because it is expressed as a percentage, you can compare the effectiveness or profitability of different investment choices. To calculate return on investment, divide the amount you earned from an investment—often called the net profit, or the cost of the investment minus its present value—by the cost of the investment and multiply that by 100. The result should be represented as a percentage. Here are two ways to represent this formula:
ROI = ((Present Value – Cost of Investment) / Cost of Investment) x 100
Let’s say you invested $5,000 in Apple last year, for example, and sold your shares for $5,500 this week. Here’s how you would calculate your ROI for this investment:
ROI = ($5,500 – $5,000 / $5,000) x 100
Your return on investment in Apple would be 10%.
Margin Ratios
There are many different forms of margin ratios to help you understand the profitability of an organisation. Margin ratios typically use the income statement and each ratio measures a more complete picture of the income statement.
Gross Margin = (Gross Profit/Net Sales) x 100
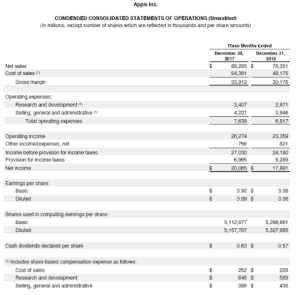
Using the December 30, 2017 Income statement results, we can see that Apple had Net sales of $88, 293 Million and Gross Profit of $33,912 Million. While gross profit was not labelled, it was represented as Net sales – Cost of sales = $33,912 Million.
Gross Margin = (33,912/88,293) x 100
Apple’s Gross Margin for December 30, 2017 would be 38.4%
Check For Understanding
Earnings Per Share (EPS)
Another profitability ratio on which the financial markets focus is earnings per share, also known as EPS. This ratio divides net income by the number of shares of stock outstanding. It is commonly used to estimate corporate value. The higher the EPS the greater the value to the investors because people will pay more for a company’s shares if they think it has higher profits relative to the price of shares. The most valuable use of this ratio is when comparing the EPS amongst competitors in the same industry during the same time period.
In the Apple Income statement example from above, EPS increased from $3.38 in 2016 to $3.92 in 2017. From a percentage variance perspective this represented a 13.7% improvement from 2016 to 2017. This percentage variance was calculated as follows.
Variance % change = [($3.92-$3.38)/3.92] x 100
Variance % change = 13.7%
From an analysis perspective this change is significant because it represents a double digit (10 or greater) percentage change year over year. While this change is positive for Apple, it is more relevant when compared to competitors.
Liquidity Ratios
Liquidity ratios are one element of measuring the financial strength of a company. They assess its ability to pay its current bills.
Current Ratio (CR)
If you want to know an organization’s ability to pay short-term financial obligations, you can use the Current Ratio (CR). The current ratio compares the organization’s current assets to it’s current liabilities. This ratio is sometimes called the working capital ratio.
It is calculated by dividing your Current Assets by the Current Liabilities from the Balance Sheet. A ratio less than 1.00 would indicate the organization has more liabilities than assets. The higher the current ratio is, the greater the organization’s ability to pay short-term financial obligations. Where the current ratio can be particularly helpful is when comparing it over time for the same organisation or benchmarking the ratio with other organizations.
Using Apple Inc. Condensed Consolidated Balance Sheet provided for December 30, 2017, you would calculate that…
Current Ratio = (Current Assets/Current Liabilities)
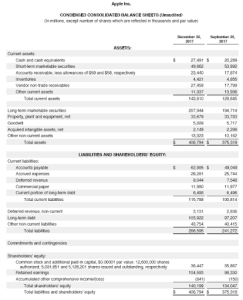
Using the December 30, 2017 Income statement results, we can see that Apple had Current Assets of $143,810 Million and Current Liabilities of $115,788 Million
Current Ratio = ($143,810/$115,788)
Apple/s Current Ratio for December 30, 2017 would be 1.24 (greater than>)1
Check For Understanding
Debt Ratios
The term debt refers to something that is owed or due. From an organisation perspective debt is typically referred to as a liability on the balance sheet. Debt Ratios are expressed as a decimal or percentage and they measure an organizations’s leverage. Leverage is another way of saying how much money has the organization borrowed in order to operate.
Debt to Equity Ratio (DE)
A key debt ratio, which tells us how the company is financed, is the debt-to-equity ratio, which calculates the relationship between funds acquired from creditors (debt) and funds invested by owners (equity). For this ratio calculation, we use Apple’s total liabilities, not just the line on the balance sheet that says long-term debt, because in effect, Apple is borrowing from those who it owes but has not yet paid. Apple’s total liabilities at the end of 2017 were $266.6 billion versus owner’s equity of $140.2 billion, a ratio of 1.9, which means Apple has borrowed more than it has invested in the business.
Using Apple Inc. Condensed Consolidated Balance Sheet provided for December 30, 2017, you would calculate that…
Debt to Equity Ratio = Total debt(also called Total Liabilities) / Total Equity (also called Total Shareholders’ equity)
Using the December 30, 2017 Balance sheet results, we can see that Apple had Total Debt of $266,596 Million add Total Equity of $140,199 Million
Debt to Equity = ($266,596/$140,199)
Apple/s Debt to Equity Ratio for December 30, 2017 would be 1.90
To some investors, that high level of debt might seem alarming. But remember that Apple has $207,944 million invested in marketable securities. If it wished to do so, Apple could sell some of those securities and pay down its debts, thus improving its ratio. It’s likely that anyone thinking about lending money to Apple and seeing these figures would be confident that Apple has the ability to pay back what they borrow.
Check for understanding
Ratio Conclusion
There are many more ratios that evaluate and analyze different parts of the organization. In order of any ratio to have meaning, it must be compared to something else. A ratio can be used to compare to past performance, planned budget, competitors or industry averages. Many industries have specialized ratios or ratios that are commonly used. The real value lies in the users ability to derive meaning from the data to enable decision making.
If you are interested in learning and reading about different industries in the creative sector, check out the CI Industry Reports that the Toronto Metropolitan University Library has prepared. The document features links to different IbisWorld industry reports.
Industry reports can be found for many different sectors in the creative industries.
- Media Business
- Music
- Fashion
- Communications and Public Relations
- Publishing and Printing
- Art & Business of Film
- Acting/Dance Studies
- Interior Design
- Visual Culture
