6 Week 6 Budgeting for Creative Projects
Week 6 Budgeting for Creative Projects
Introduction
 Learning Objectives
In the week, students will …
- Explain the importance of budgeting
- Understand different methods for estimating budgets
- Calculate and interpret budget variances
- Calculate break even
This chapter should take you 18 minutes to read and plus time to complete an In-Class Case Study.
Recent university graduates working in the creative sector frequently start their career as a coordinator. According to the Oxford dictionary, a coordinator is “a person whose job is to organise events or activities and to negotiate with others in order to ensure they work together effectively.” Beyond scheduling and communication amongst different people, one of the most common tasks a coordinator performs is the creation or monitoring of budgets. All creative endeavours like film, music, television and visual art require budgeting to manage financial resources.
According to Human Resources and Skills Development Canada the ability to use numeracy for things like scheduling, budgeting or accounting activities is considered an essential skill that people need for learning, work and life. Depending upon the industry and role you pursue for your careers, budgeting will have varying degrees of importance. As an example, for an industry like event planning, budgeting is considered one of the most important skills[1]
An example of a recent graduate and the importance of budgeting is Melody McMullan a 2018 Creative Industries Graduate from Toronto Metropolitan University. Upon graduation Melody worked as an Office Coordinator at Taqqut Productions. Her most common task as a coordinator for the Inuit-owned film production company was that of estimating the costs of film shoots and tracking budgets. Her experience taking a finance course in her program helped prepare her for this job.
Budgeting for the Creative Sector
Budgeting is the process of creating and managing financial information which estimates income and expenses over a period of time. The budget can be for one project, one month or one year. It can also be just for the sales department, cash flow, operations, or other roles within an organisation. A budget is a common element of all successful organisations whether they be large or small. The budget serves as a map or guide for individuals and organisations alike. Within the creative sector budgets are an integral part of all applications for funding. As an example, if you require a grant for creation, organisations like Ontario Creates, Canada Council for the Arts and other funding organisations require budgets within the application process.
The terminology and skills required for budgeting will take different forms, depending upon the industry sector, organisation and legislative requirements. For an example of budgeting practices in different creative sectors, check out these short videos.
 Video Activity: An Introduction to Film Budgeting [6:12]
Ashim Ahuja is a film producer and speaks about budgeting as a creative tool. Watch this short video for insights and if you want to read more check out this short blog story from studio binder by clicking here.
Video Activity: How to budget for a fashion show [3:07]
Donna Tilery the founder of New Jersey Fashion Week, speaks about how to budget for a fashion show.
Video Activity: How to budget for a public art [10:49]
This podcast by Distill Creative speaks about how to create a budget for a public art project.
Budgeting Methods
Organisations have many different budgets representing everything from sales and operations to cash flow and capital planning. There are some common methods used for budgeting, each with different advantages and disadvantages. There is no one agreed upon set of budgeting methods, however three of the most commonly used are Zero, Incremental and Activity based.
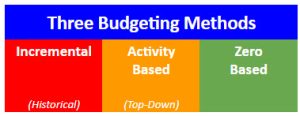
Source: Gibbs (2023), Original artwork.
Zero Based. This method is likely the most common method used within the creative sector. Think about it, if each creative project is unique and different, then the costs of that project will also be unique and different. Using this method your preparation of a budget starts from scratch and is not based on past projects or past year performance. While this is the most time consuming of the methods and requires the most research, it is the most used and effective method related to film, television, music, art and other creative sector projects. This method is also the one that is used most by recent graduates in their roles working within organisations or starting their own creative endeavours.
Incremental. An incremental budget is based on past years or projects financial information. The incremental method generally adds or subtracts a percentage to the budget for the upcoming year. This method of budgeting is commonly used within companies or industries which are well established and have little or no fluctuation in the market. From the three methods identified, incremental is the most straightforward method that is easily standardised. While it is the easiest, it also keeps resource allocations relatively the same, encourages managers to underestimate growth or exaggerate expenses and hinders innovation because it is about keeping things the same.
Activity Based. This is a top-down based budgeting approach whereby you establish the business target or output first. Once that is decided, you prepare a budget that supports the established goals. The aim of this budget method is to eliminate unnecessary steps and focus on the activities/expenses which are most needed in order to meet the sales target.
While the above three methods make budgeting look simple, creating a budget will vary in complexity depending upon the size and scale of the creative operation. As an example, below is the recreation of the budget for the filming of Spider Man 2 from 2002 as presented by The Guardian newspaper. What is interesting about this budget is the industry standard different sections for the communication of different budgets. Each section represents a different stage of the process for producing a film.
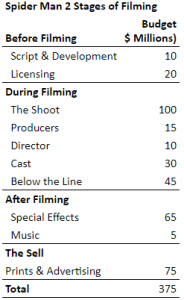
Source: Thomas, A. (2004) Anatomy of a blockbuster. The Guardian https://www.theguardian.com/film/2004/jun/11/3
Tips for Building a Budget
This blog post by Tim Clark includes some helpful tips on creating a project budget [5 minute read] https://www.liquidplanner.com/blog/7-ways-create-budget-project
Check Your Understanding
Variance Analysis
In simple terms a variance analysis is the difference between planned and actual results. From a financial analysis perspective it is one of the most common forms of analysis. A variance analysis can be done using financial figures, sales, labour and most any other quantifiable variable. It is a management tool that is used to not only monitor ongoing projects but to look at results for the end of a given project or time period. Variance analysis examples include…
Monitoring Financial Results. Remember Spider Man 2 from above. Filming for that movie started in April 2003 and was finished in December of that year. Filming movies have a lot of moving parts, with 16 different accountants featured in the movie credits, they would be tracking expenses throughout filming and comparing them according to the initial plan. The budget for a film could be hundreds of pages. Tracking the budget using variance reports throughout the film is important. The producer of a film is required not to exceed the initial budget that was used to secure financing for the film. If the producer does go over budget, they may have to absorb the over-runs by reducing their fees.
Comparing Planned vs. Actual Results. At the end of a project or fiscal year, it is common practice to compare planned vs actual financial results. This review helps highlight key learnings during the time period and helps explain areas where things did not go to plan.
Comparing Financial Results. Within non-profit organisations Soulpepper Theatre and Pride Toronto (see page 18), it is common practice to publish the rolled up financial results for the entire year to share with the associations board and stakeholders. The sharing of this information is a form of transparency to the stakeholders and tells a story to the reader of how the organisation performed in the current year as compared to the past year.
In simple terms a variance analysis is the difference between planned and actual results. From a financial analysis perspective it is one of the most common forms of analysis. A variance analysis can be done using financial figures, sales, labour and most any other quantifiable variable. It is a management tool that is used to not only monitor ongoing projects but to look at results for the end of a given project or time period. Variance analysis examples include…
- Monitoring Financial Results. Remember Spider Man 2 from above. Filming for that movie started in April 2003 and was finished in December of that year. Filming movies have a lot of moving parts, with 16 different accountants featured in the movie credits, they would be tracking expenses throughout filming and comparing them according to the initial plan. The budget for a film could be hundreds of pages. Tracking the budget using variance reports throughout the film is important. The producer of a film is required not to exceed the initial budget that was used to secure financing for the film. If the producer does go over budget, they may have to absorb the over-runs by reducing their fees.
- Comparing Planned vs. Actual Results. At the end of a project or fiscal year, it is common practice to compare planned vs actual financial results. This review helps highlight key learnings during the time period and helps explain areas where things did not go to plan.
- Comparing Financial Results. Within non-profit organisations Soulpepper Theatre and Pride Toronto (see page 18), it is common practice to publish the rolled up financial results for the entire year to share with the associations board and stakeholders. The sharing of this information is a form of transparency to the stakeholders and tells a story to the reader of how the organisation performed in the current year as compared to the past year.
Variance Formula
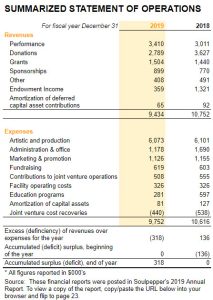
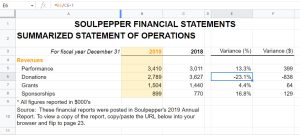
The expression of a variance can come in the form of a simple number or a percentage. The results are used to evaluate decision making and performance of an ongoing project, past project or fiscal year. The Soulpepper Financial Statements image below shows the variance in % and $ for 2019 versus 2018.
The two ways to calculate variance are:
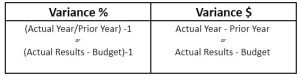
Variance % Formula
In the example above, the Variance % formula is calculating the percentage difference between 2019 the actual year and 2018 the prior year.
Based on the above Soulpepper Financial statements, the theatre company had $3,011,000 in revenue for 2018 and $3,410,000 in revenue for 2019. Based on this, we divide $3,410,000 by $3,011,000 and subtract 1 to express the number as a percentage 13.3%.
This result is a positive variance to revenue from 2019 versus 2018.
Variance $ Formula
In the example above, the Variance $ formula is calculating the difference between 2019 the actual year and 2018 the prior year.
Based on the above Soulpepper Financial statements, the theatre company had $3,410,000 in revenue for 2019 and $3,011,000 in revenue for 2018. Based on this, we subtract $3,011,000 from $3,410,000 and express the results as a financial number of $399,000.
This result is a positive variance to revenue and from 2019 versus 2018.
Interpreting the Analysis
It is not enough to just make the calculations, but you must also interpret and explain the results of the analysis. Depending upon whether you are speaking to a revenue or an expense, the results of the variance analysis are interpreted differently.
As an example if your revenue has a negative variance it means that the actual results were lower than the past year, this is considered a negative result. However if your expense has a negative variance it means that the actual spending was less than the past year, it would be considered a favourable result.
Communicating the Analysis
If you are responsible for budget reporting it is not enough to simply calculate and interpret the Variance % or Variance $, you must also be able to communicate what the report says. If you are communicating the results of an analysis, you do not want to write or speak to all of the variances that you calculate. Rather you want to speak to those variances that are most significant. Some good rules to abide by when speaking to budget highlights are:
Start with Overall. When communicating the results of your analysis, always start with the results of the overall project or analysis and then speak to specific line items following.
Positive and Negative Variances.A variance analysis can have anywhere from 1 to 30 individual line items. Rather than speak to all line items at once, it is a good idea to speak to the positive variances first and then the negative variances.
Significance $’s. For the examples presented here, we have calculated both % and $ variance. This is done because depending upon the organisation or reporting requirements, they may use either %, $ or both. For the purposes of financial analysis and this course, we encourage you to always rank your significance based on $’s and not %. This is recommended because $’s are ultimately the actual measure of financial significance, while % is a proportional measure.
Rule of Three. Imagine having 30 lines in your variance report. If you communicated results line by line, the audience or reader would be tired and not able to focus on the key variables. So it is always best to prioritise your variance from most significant to least and then speak to or write up an explanation for these three most significant variances. This way you are doing the critical thinking and analysis for your audience or reader, allowing them to focus on what is most important. If you have not heard about the presentation Rule of Three before, click here to read a block post about it.
 In -Class Case Study: Meet Julie
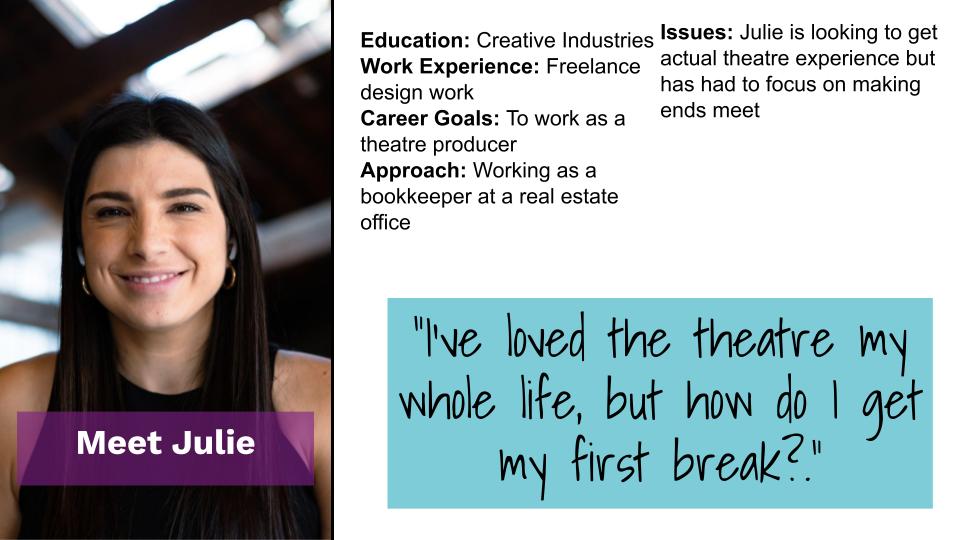
In-Class Case Study: Financial Analyst Job Interview, Soulpepper?
Julie is going to a job interview with her favourite theatre Soulpepper Theatre. It is exactly where she would like to get her start in theatre. The job is working as a producer’s assistant. In advance of the interview, they gave Julie the task of completing a variance analysis from their 2019 to 2018 income statement. Julie is expected to come to the interview completing the calculations and be prepared to discuss major variance and issues.
Make a copy with the ‘Make a copy’ feature in Google Sheets of this Week 6 In-Class Case Study Spreadsheet or copy and paste the URL below.
https://docs.google.com/spreadsheets/d/1akOLMUeO2ef96s4HvETTS5Y-TZGS4U5Errat9qvk2zM/edit?usp=sharing
Check Your Understanding
Break Even Analysis
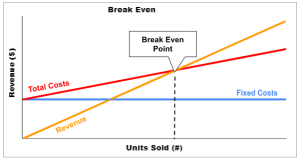
When starting a business or working on a creative project like an exhibit, event or film, inevitably you will need to calculate the break even point. According to Corporate Finance Institute, Break Even is “The point in which total cost and total revenue are equal”. The calculation tells you the number of units you must sell in order to cover the fixed and variable production costs. This calculation is broadly used and something that is applicable in a number of different creative industry contexts.
- Fashion Designer. From clothing to jewellery, manufacturers will use a break even point to help them set initial pricing for a new garment or piece of jewellery.
- Event Managers. For event managers that are reliant on ticket sales to generate revenue, they all know how many tickets are needed to sell in order to recover their investments and break even.
Break Even Formula

Fixed Costs. A fixed cost is something that does not change when you directly sell something. Common fixed costs are salaries, start-up costs, marketing, rent, staffing and insurance.
Contribution Margin Per Unit. The formula for contribution margin is (Sales price per Unit less Variable Cost per Unit). It is the measure of how much money is left over after you sell something that is available to offset your fixed costs.
Sales Price per Unit. This is the price you sell your product or service to the consumer for.
Variable Cost per Unit. In simple terms these are costs that vary with the level of sales. It is usually things like direct labour costs to produce or create something and the raw materials that go into making something.
While this sounds simple, it is a concept that is difficult for people to understand. Some people think variable means cost change then they are variable. However variable costs are only those that are directly related to the product or service sold.
Video Activity: Watch this Video about Variable Costs [3:37]
One of the more complex things for people to understand about break even is variable costs. Watch this short video to help you better understand them.
Break Even Example Shazar Vinyl Record
Shazar is a recording artist who wants to produce a vinyl record and sell them at upcoming shows. Without going to get formal quotes for costing, Shazar does some initial online research to get some rough costing to press a two-sided 12” record with plain labelling, sleeves and jackets.
Fixed Costs
Lacquer Cutting $ 380.00
Plating $ 340.00
Pressing Set-Up Fee $ 190.00
Test Pressing $ 65.00
Total Fixed Costs $ 975.00
Variable Costs per Unit
Centre Labels $ 0.05
Inner Sleeves $ 0.15
Jackets $ 0.75
140g Vinyl Record $ 1.55
Total Variable Costs $ 2.50
Source of above pricing (https://www.vinylrecordlife.com/vinyl-record-pressing-costs/)
Break Even Summary
Total Fixed Costs $975.00
Contribution Margin per Unit $19.50
Selling Price per Unit $22.00
Variable Cost per Unit $2.50
| Break Even
Units Sold |
= | Fixed Costs | = | $975.00 | = | 50 |
| Contribution Margin per Unit | $19.50 |
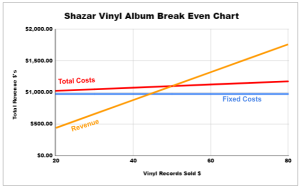
In the above example, based on the sales price of $22 per album and variable costs of $2.50, Shazar would need to sell 50 albums in order to break even.
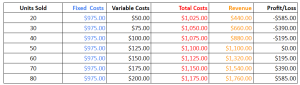
Break Even Tables and Charts
The visuals below show the Profit/Loss for Shazar’s vinyl record sales. This can be used to help Shazar determine her level or risk associated with printing the vinyl records. The visuals show that Shazar would break even when selling 50 units at revenues of $1,100.
Break Even Tables. Break even tables are helpful because they can be created to show the actual financial figures required to break even. The table also communicates the potential profit/loss at different levels.
Check Your Understanding
CFI Team, (2022, November 26). Break even analysis. CFI. Retrieved from https://corporatefinanceinstitute.com/resources/accounting/break-even-analysis/
- Perry, M., Foley, P., & Rumpf, P. (1996). Events management: An emerging challenge in Australian higher education. Festival Management and Event Tourism, 4(3-4), 85-93. ↵
