10 Week 10 Horizontal and Vertical Analysis
Week 10 Horizontal and Vertical Analysis
Introduction
 Learning Objectives
By the end of this week you will be able to:
- Learn what horizontal and vertical analysis is, and how to conduct these calculations
- Learn how to use the different types of analysis to make comparisons within one or multiple organizations
This chapter should take you 8-10 minutes to read, plus time to complete activities.
Financial analysis is a critical skill for those people wanting to work in the creative industries. You need to be able to not only read, but interpret financial information to help make informed decisions or make recommendations. The ability to evaluate financial statements, ratios and key performance indicators will help you make informed decisions in the future.
When you compare financial information over time, you can help identify patterns or insights. Two of the most common forms of analysis are Horizontal and Vertical Analysis.
Vertical Analysis
Vertical analysis focuses on assessing the proportional representation of each line item in a financial statement relative to a base figure. This base figure is usually total assets or sales for the income statement.By expressing each item as a percentage of the base, vertical analysis allows for meaningful comparisons within and across companies of different sizes. It helps identify the composition and relative importance of various components, such as expenses or assets, within the financial structure.
Last week you looked at ratios to analyze the financial statements, this week you will combine the ratios to compare the breakdown of the Income Statement. Vertical Analysis allows you to see the revenue broken down by costs and what trickles down to the profits. This is a great way to standardize the revenue, costs and profits to be able to track where the company is spending the most money.
 Video: Vertical analysis of financial statements (11:51 minutes)
Vertical analysis of financial statements, a step-by-step introduction.
Example of Vertical Analysis of Aritzia’s Income Statement
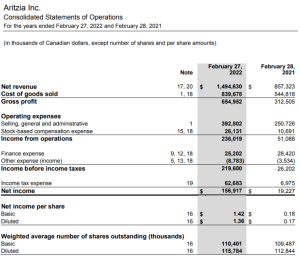
Google Sheet For Calculations: https://docs.google.com/spreadsheets/d/1Eh0Aj9SSVDr-oicdxlsTsJED0lY80550zczYcP7MlzE/edit?usp=sharing
To calculate what percentage each cost and profit step is of the revenue you will need to take the desired line items and divide them by the revenue. Using the above Income Statement for 2022 for the Cost of Goods Sold you take $839,678/$1,494,630 = 0.56 which is the decimal and to calculate the percentage you need to multiply it by 100% to get 56%.
Instead of individually calculating each ratio you can create a Common Sized Income Statement. This is an easy way to calculate all of the ratios and be able to compare them. Open the Excel/Google Sheet with the Income Statement. Add a column to the right of the year that you are calculating. Beside the Revenue line add a formula to calculate the percentage of revenue/revenue, in the Aritzia document it will be =C8/C8. Before copying this formula down the Income Statement add a $ before the second 8. This will fix the number 8 and not change it for all the formulas because you need all the costs and profits to be divided by C8. The reason you do not need to add a $ before the C is because we are not switching columns so there is no reason to keep C fixed. Once you add the dollar sign you can drag the formula down using the circle on the bottom right corner of the cell you are currently on. After you have the updated formulas for each row populated you can switch the format of the number to a percentage with your desired accuracy. To do this you will need to go into the format option on the top left corner and select number and then percentage.
You can make the Common Sized Income Statement less confusing by bolding the profits in each section to know that they are not being added to make up the revenue. To double-check your work you can add up all the costs and net profit, everything together should be 100% as it makes up the total revenue.
Check Your Understanding
Horizontal Analysis
For a business to be successful they have to be able to stay in the growth stage. A good way to look at growth is through horizontal analysis, comparing the change from one year to the next.
Horizontal analysis, also known as trend analysis, is a method used to evaluate financial data over a series of reporting periods. It involves comparing line items in financial statements, such as revenues, expenses, and assets, across different periods to identify changes and trends. Horizontal analysis helps detect patterns of growth or decline, providing insights into an organization’s financial performance and highlighting areas that require attention.
You can look at change by dollar value but that is difficult to compare between different costs and years. So you would want to calculate the percentage of change between the dollar values for each. You need to take the (Year 2 value – Year 1 value) / Year 1 Value this will give you the decimal value which you can multiply by 100% to give you the percentage.
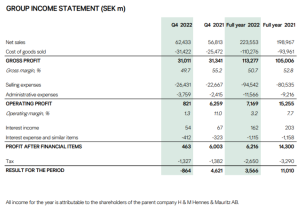
Example of Vertical Analysis of Aritzia’s Income Statement Source: https://hmgroup.com/wp-content/uploads/2021/02/H-M-Hennes-Mauritz-AB-Full-year-report-2020.pdf
Please open the H&M tab in the previously shared Google Sheet to calculate the percentage change between 2021 and 2022. To make the calculation you will need to take the (2022 value – 2021 value) / 2021 value and format it to be a percentage. In the Google Sheet, you can start by calculating the Revenue change using the formula =(C5-D5)/D5 and format the call to a percentage. And then drag down the formula to calculate the rest of the percent change for the Income Statement. Once you have the percentage change for the value you can review how different line items changed in comparison to each other. Keeping an eye out for costs that grew significantly, it is important to be wary of these changes and try to find out why things are growing at different rates.
To combine Vertical and Horizontal Analysis you can calculate the change between the Common Sized Income Statement. You just need to subtract the new years % from the previous year’s % to see how much it increased or decreased. If a larger part of the revenue is going to a specific area, you should investigate to understand why it is happening.
Check Your Understanding
Analysis Between Companies
Both Vertical and Horizontal Analysis allows you to compare companies’ performance even if they are of different sizes and revenue amounts. Also, it lets you compare different currencies without needing to convert the money as everything is using percentages. When you are comparing companies make sure to compare only relevant companies to each other. If they are in completely different industries or scales the comparison will not be effective.
You can compare how much each company spends on a particular expense and how the revenue is divided. Keep in mind that different companies have their own unique strategies which impact their allocation of funds. If a business is new or going through a rebrand it is reasonable to expect them to spend more money on their marketing expenses as opposed to an established company.
When comparing two businesses you want to look at how much their bottom line is, and if it is showing positive growth. As well as reviewing the costs to make sure that they are under control and the company is showing consistency with them. If the costs are growing significantly faster than the revenue that is concerning because that will affect the bottom line.
Check Your Understanding
