2 General Business Management Applications
Chapter 2 Topics
2.1 Percent Change
2.2 Averages
2.3 Ratios, Proportions, and Prorating
Basic calculations are so much a part of your everyday life that you could not escape them if you tried. While driving to school, you may hear on the radio that today’s forecasted temperature of 27°C is 3°C warmer than the historical average. In the news, consumers complain that gas prices rose 11% in three months. A commercial tells you that the Toyota Prius you are driving uses almost 50% less gas than the Honda Civic Coupe Si. After class you head to Anytime Fitness to cancel a gym membership because you are too busy to work out. You have used only four months of an annual membership for which you paid $449, and now you want to know how large a prorated refund you are eligible for.
On a daily basis you use basic calculations such as averages (the temperature), percent change (gas prices), ratios and proportions (energy efficiency), and prorating (the membership refund). To invest successfully, you must also apply these basic concepts. Or if you are an avid sports fan, you need basic calculations to understand your favourite players’ statistics.
And it’s not hard to see how these calculations would be used in the business world. Retail management examines historical average daily sales to predict future sales and to schedule the employees who will service those sales. Human resource managers continually calculate ratios between accounting and performance data to assess how efficiently labour is being used. Managers proration a company’s budget across its various departments.
This chapter covers universal business mathematics you will use whether your chosen business profession is marketing, accounting, production, human resources, economics, finance, or something else altogether. To be a successful manager you need to understand percent changes, averages, ratios, proportions, and prorating.
2.1 Percent Change
On your way to work, you notice that the price of gasoline is about 10% higher than it was last month. At the office, reports indicate that input costs are down 5.4% and sales are up 3.6% over last year. Your boss asks you to analyze the year-over-year change in industry sales and submit a report. During your coffee break, you look through the day’s e-flyers in your inbox. Home Depot is advertising that all garden furniture is 40% off this week; Safeway’s ad says that Tuesday is 10% off day; and a Globe and Mail story informs you that the cost of living has risen by 3% since last year. You then log in to your financial services account, where you are happy to find that the mutual funds in your RRSP are up 6.7% from last year. What are you going to do with all this information?
Understanding how data changes from one period to the next is a critical business skill. It allows for quick assessment as to whether matters are improving or getting worse. It also allows for easy comparison of changes in different types of data over time. In this section, the concept of percent change is explored, which allows for the calculation of change between two points in time. Then a rate of change over time is introduced, which allows you to determine the change per period when multiple points in time are involved in the calculation.
Percent Change
It can be difficult to understand a change when it is expressed in absolute terms. Can you tell at a glance how good a deal it is to buy a $359 futon for $215.40? It can also be difficult to understand a change when it is expressed as a percentage of its end result. Are you getting a good deal if that $215.40 futon is 60% of the regular price? What most people do find easier to understand is a change expressed as a percentage of its starting amount. Are you getting a good deal if that $359 futon is on sale at 40% off? A percent change expresses in percentage form how much any quantity changes from a starting period to an ending period.
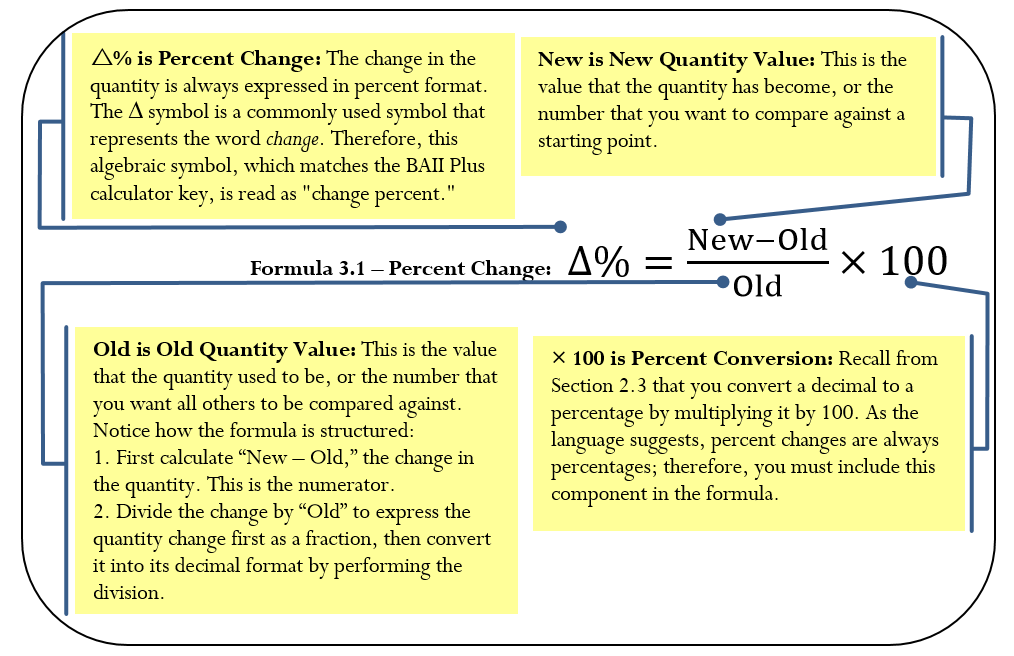
The Formula
To calculate the percent change in a variable, you need to know the starting number and the ending number. Once you know these, Formula 3.1 (on the next page) represents how to express the change as a percentage.
Remember two critical concepts about percent change:
- Do Not Include the Original Quantity in the Change. Percent change represents the changes in the quantities, not the values of the quantities themselves. The original quantity does not count toward the percent change. Therefore, if any quantity doubles, its percent change is 100%, not 200%. For example, if the old quantity was 25 and the new quantity is 50, note that the quantity has doubled. However, 25 of the final 50 comes from the original amount and therefore does not count toward the change. We subtract it out of the numerator through calculating 50 − 25 = 25. Therefore, the change as a percentage is
 The same applies to a tripling of quantity. If our new quantity is 75 (which is triple the old quantity of 25), then
  % The original value of 25 is once again subtracted out of the numerator. The original 100% is always removed from the formula.
 - Negative Changes. A negative change must be expressed with a negative sign or equivalent wording. For example, if the old quantity was 20 and the new quantity is 15, this is a decrease of 5, or a change of 15 − 20 = −5. The percent change is
 . Be careful in expressing a negative percent change. There are two correct ways to do this properly:
- “The change is −25%.”
- “It has decreased by 25%.”
Note in the second statement that the word “decreased” replaces the negative sign. To avoid confusion, do not combine the negative sign with the word “decreased”—recall that two negatives make a positive, so “It has decreased by −25%” would actually mean the quantity has increased by 25%.
Percent Change
How It Works
To solve any question about percent change, follow these steps:
Step 1: Notice that there are three variables in the formula. Identify the two known variables and the one unknown variable.
Step 2: Solve for the unknown variable using Formula 3.1.
Assume last month your sales were $10,000, and they have risen to $15,000 this month. You want to express the percent change in sales.
Step 1: The known variables are Old = $10,000 and New = $15,000. The unknown variable is percent change, or ∆%.
Step 2: Using Formula 3.1, ∆%=
*** QuickLaTeX cannot compile formula:
\frac{{

*** Error message:
File ended while scanning use of \frac .
Emergency stop.
15,000- 10,000}}\times 100=\;\frac{{
 10,000}}\times 100=0.5\times 100=50\%
 5,000 month-over-month. Relative to sales of $10,000 last month, this month’s sales have risen by 50%.
Important Notes
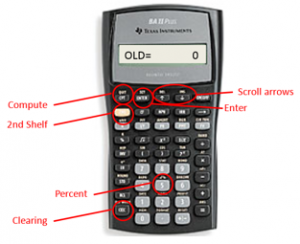
To access the percent change function on your BAII Plus calculator, press 2nd ∆% located above the number 5 on your keypad. Always clear the memory of any previous question by pressing 2nd CLR Work once the function is open. Use the ↑ and ↓ arrows to scroll through the four lines of this function. To solve for an unknown variable, key in three of the four variables and then press Enter. With the unknown variable on your display, press CPT. Each variable in the calculator is as follows:
- OLD = The old or original quantity; the number that represents the starting point
- NEW = The new or current quantity; the number to compare against the starting point
- %CH = The percent change, or ∆% in its percent format without the % sign
- #PD = Number of consecutive periods for change. By default, it is set to 1. For now, do not touch this variable. Later in this section, when we cover rate of change over time, this variable will be explained.
Things To Watch Out For
Watch out for two common difficulties involving percent changes.
- Rates versus Percent Changes. Sometimes you may be confused about whether questions involve rates (Section 2.3) or percent changes. Recall that a rate expresses the relationship between a portion and a base. Look for some key identifiers, such as “is/are” (the portion) and “of” (the base). For percent change, key identifiers are “by” or “than.” For example, “x has increased by y%” and “x is y% more than last year” both represent a percent change.
- Mathematical Operations. You may imagine that you are supposed to add or subtract percent changes, but you cannot do this. Remember that percentages come from fractions. According to the rules of algebra, you can add or subtract fractions only if they share the same base (denominator). For example, if an investment increases in value in the first year by 10% and then declines in the second year by 6%, this is not an overall increase of 10% − 6% = 4%. Why? If you originally had $100, an increase of 10% (which is $100 × 10% = $10) results in $110 at the end of the first year. You must calculate the 6% decline in the second year using the $110 balance, not the original $100. This is a decline of $110 × (−6%) = −$6.60, resulting in a final balance of $103.40. Overall, the percent change is 3.4%.
Paths To Success
A percent change extends the rate, portion, and base calculations introduced in Section 2.3. The primary difference lies in the portion. Instead of the portion being a part of a whole, the portion represents the change of the whole. Putting the two formulas side by side, you can calculate the rate using either approach.

Give It Some Thought
- It has been five years since Juan went shopping for a new car. On his first visit to a car lot, he had sticker shock when he realized that new car prices had risen by about 20%. What does this situation involve?
- Percent change
- Rate, portion, base
- Manuel had his home custom built in 2006 for $300,000. In 2014 he had it professionally appraised at $440,000. He wants to figure out how much his home has appreciated. How would he do so?
- The 2006 price is the “New,” and the 2014 price is the “Old.”
- The 2006 price is the “Old,” and the 2014 price is the “New.”
Solutions:
- a (the question involves how car prices have changed; note the key word “by”)
- b (the 2006 price is what the house used to be worth, which is the old quantity; the 2014 price represents the new value of the home)
Example 2.1 A: Price of New Cars in Canada
|
In 1982, the average price of a new car sold in Canada was $10,668. By 2009, the average price of a new car had increased to $25,683. By what percentage has the price of a new car changed over these years?
|
|
|
You are trying to find the percent change in the price of the new car, or ∆%.
|
|
|
What You Already Know Step 1: You know the old and new prices for the cars: Old = $10,668 New = $25,683
|
How You Will Get There Step 2: Apply Formula 3.1.
|
|
Step 2:
|
|
|
From 1982 to 2009, average new car prices in Canada have increased by 140.748%.
|
|

Example 2.1 B: Price Changes
|
Consumers often object to price changes in many daily products, even though inflation and other cost changes may justify these increases. To reduce the resistance to a price increase, many manufacturers adjust both prices and product sizes at the same time. For example, the regular selling price for a bottle of shampoo was $5.99 for 240 mL. To account for cost changes, the manufacturer decided to change the price to $5.79, but also reduce the bottle size to 220 mL. What was the percent change in the price per millilitre?
|
|
|
You need to find the percent change in the price per millilitre, or ∆%.
|
|
|
What You Already Know Step 1: You know the old price and bottle size, as well as the planned price and bottle size: Old price = $5.99 Old size = 240 mL New price = $5.79 New size = 220 mL
|
How You Will Get There Step 1 (continued): Convert the price and size to a price per millilitre by taking the price and dividing by the size. Step 2: Apply Formula 3.1.
|
|
Step 1:
|
Step 2:
|
|
The price per mL has increased by 5.4485%. Note that to the consumer, it would appear as if the price has been lowered from $5.99 to $5.79, as most consumers would not notice the change in the bottle size.
|
|


Rate of Change over Time
The percent change measures the change in a variable from start to end overall. It is based on the assumption that only a single change occurs. What happens when the ending number results from multiple changes and you want to know the typical value of each change? For example, the population of the Toronto census metropolitan area (CMA) has grown from 4,263,759 in 1996 to 5,113,149 in 2006. What annual percentage growth in population does this reflect? Notice that we are not interested in calculating the change in population over the 10 years; instead we want to determine the percentage change in each of the 10 years. The rate of change over time measures the percent change in a variable per time period.
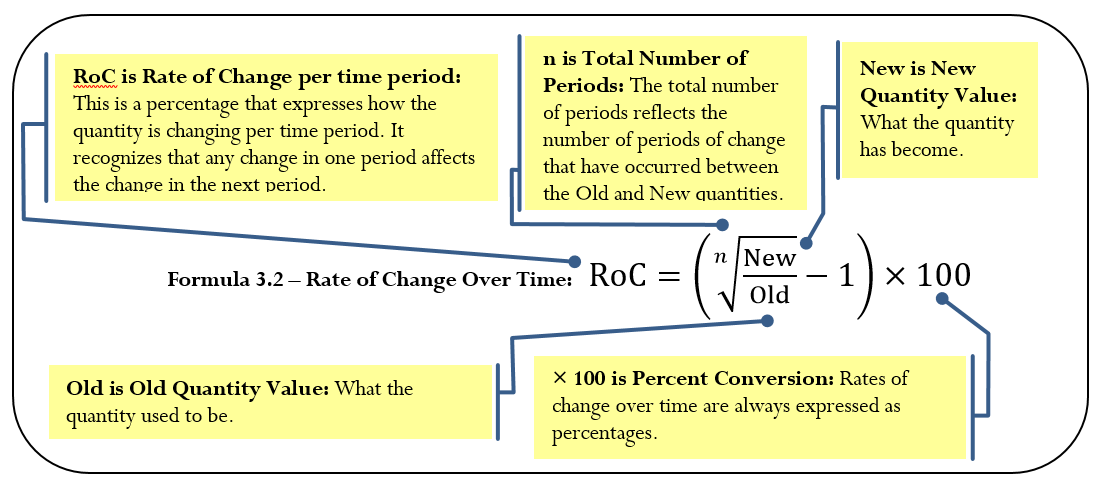
The Formula
Calculating the rate of change over time is not as simple as dividing the percent change by the number of time periods involved, because you must consider the change for each time period relative to a different starting quantity. For example, in the Toronto census example, the percent change from 1996 to 1997 is based on the original population size of 4,263,759. However, the percent change from 1997 to 1998 is based on the new population figure for 1997. Thus, even if the same number of people were added to the city in both years, the percent change in the second year is smaller because the population base became larger after the first year. As a result, when you need the percent change per time period, you must use Formula 3.2.
Rate of Change
How It Works
When you work with any rate of change over time, follow these steps:
Step 1: Identify the three known variables and the one unknown variable.
Step 2: Solve for the unknown variable using Formula 3.2.
Important Notes
On your calculator, calculate the rate of change over time using the percent change (∆%) function. Previously, we had ignored the #PD variable in the function and it was always assigned a value of 1. In rate of change, this variable is the same as n in our equation. Therefore, if our question involved 10 changes, such as the annual population change of the Toronto CMA from 1996 to 2006, then this variable is set to 10.
Paths To Success
You may find it difficult to choose which formula to use: percent change or rate of change over time. To distinguish between the two, consider the following:
- If you are looking for the overall rate of change from beginning to end, you need to calculate the percent change.
- If you are looking for the rate of change per interval, you need to calculate the rate of change over time.
Ultimately, the percent change formula is a simplified version of the rate of change over time formula where n = 1. Thus you can solve any percent change question using Formula 3.2 instead of Formula 3.1.
Give It Some Thought
For each of the following, distinguish whether you should solve the question by the percent change formula or the rate of change over time formula.
- When Peewee started five-pin bowling with the Youth Bowling Canada (YBC) in 1997, his average was 53. In 2011, he finished his last year of the YBC with an average of 248. How did his average change from 1997 to 2011?
- A stock was priced at $4.34 per share in 2006 and reached $7.15 per share in 2012. What annual return did a shareholder realize?
- In 2004, total sales reached $1.2 million. By 2010, sales had climbed to $4.25 million. What is the growth in sales per year?
Solutions:
- Percent change; looking for overall change
- Rate of change over time; looking for change per year
- Rate of change over time; looking for change per year
Example 2.1 D: Population Growth
|
Using the Toronto CMA information, where the population grew from 4,263,759 in 1996 to 5,113,149 in 2006, calculate the annual percent growth in the population. We need to calculate the percent change per year, which is the rate of change over time, or RoC.
|
|||
|
What You Already Know Old = 4,263,759 New = 5,113,149 n = 2006 − 1996 = 10 years
|
How You Will Get There Step 1: We know the starting and ending numbers for the population along with the time frame involved.
|
||
|
Step 2:
|
Step 2: Apply Formula 3.2.
|
||
|
Over the 10 year span from 1996 to 2006, the CMA of Toronto grew by an average of 1.8332% per year.
|
|||
![{\rm{RoC}} = \left( {\sqrt[{10}]{{\frac{{5,113,149}}{{4,263,759}}}} - 1} \right) \times 100](https://ecampusontario.pressbooks.pub/app/uploads/quicklatex/quicklatex.com-1c8170fcf605f9e9f9d80289584ec901_l3.png "Rendered by QuickLaTeX.com")
![= \left( {\sqrt[{10}]{{1.199211}} - 1} \right) \times 100](https://ecampusontario.pressbooks.pub/app/uploads/quicklatex/quicklatex.com-72367c151af451b555d59b6fc6263356_l3.png "Rendered by QuickLaTeX.com")


Example 2.1 E: Percent Changes and Rate of Change Together
|
Kendra collects hockey cards. In her collection, she has a rookie year Wayne Gretzky card in mint condition. The book value of the card varies depending on demand for the card and its condition. If the estimated book value of the card fell by $84 in the first year and then rose by $113 in the second year, determine the following: a. What is the percent change in each year if the card is valued at $1,003.33 at the end of the first year? b. Over the course of the two years, what was the overall percent change in the value of the card? c. What was the rate of change per year?
|
|||
|
We need to provide four answers to the questions and find the percent change in year 1, or
|
|||
|
Step 1: We know the price of the card at the end of the first year as well as how it has changed each year. Price at end of first year = $1,003.33 Price change in first year = −$84 Price change in second year = $113 Step 2: New = Old + Change; $1,003.33 = Old − $84.00; $1,087.33 = Old Step 3: Step 4: New = Old + Change = $1,003.33 + $113 = $1,116.33 Step 5: Step 6: Step 7: RoC =
|
How You Will Get There Step 2: Calculate the price at the beginning of the first year. Step 3: For the percent change in Year 1, apply Formula 3.1: Step 4: Calculate the price at the end of the second year. Step 5: For the percent change in Year 2, apply Formula 3.1: Step 6: For the overall percent change, take the old price at the beginning of the first year and compare it to the new price at the end of the second year. Apply Formula 3.1: Step 7: Calculate the rate of change over the two years using the same two prices, but apply Formula 3.2.
|
||
|
The value of the hockey card dropped 7.7253% in the first year and rose 11.2625% in the second year. Overall, the card rose by 2.6671% across both years, which represents a growth of 1.3248% in each year.
|
|||
 , then the percent change in year 2, or
  . Using these first two solutions, we calculate both the overall percent change across both years, or ∆%overall, and the rate of change per year, or RoC.


![\left( {\sqrt[2]{{\frac{{$ 1,116.33}}{{$ 1,087.33}}}} - 1} \right) \times 100 = 1.3248\%](https://ecampusontario.pressbooks.pub/app/uploads/quicklatex/quicklatex.com-c838a51a40841556cfb8f41edf943564_l3.png "Rendered by QuickLaTeX.com")
Exercises
Mechanics
For questions 1–3, solve for the unknown (?) using Formula 3.1 (percent change).
| Old | New | ∆% | |
| 1. | $109.95 | $115.45 | ? |
| 2. | ? | $622.03 | 13.25% |
| 3. | 5.94% | ? | −10% |
- If $9.99 is changed to $10.49, what is the percent change?
- $19.99 lowered by 10% is what dollar amount?
- What amount when increased by 40% is $3,500?
- If 10,000 grows to 20,000 over a period of 10 years, what is the annual rate of change?
Applications
- How much, including taxes of 12%, would you pay for an item with a retail price of $194.95?
- From September 8, 2007 to November 7, 2007, the Canadian dollar experienced a rapid appreciation against the US dollar, going from $0.9482 to $1.1024. What was the percent increase in the Canadian dollar?
- From 1996 to 2006, the “big three” automakers in North America (General Motors, Ford, and Chrysler) saw their market share drop from 71.5% to 52.7%. What is the overall change and the rate of change per year?
- The average price of homes in Calgary fell by $10,000 to $357,000 from June 2009 to July 2009. The June 2009 price was 49% higher than the June 2005 price. a. What was the percent change from June 2009 to July 2009 b. What was the average price of a home in June 2005? c. What was the annual rate of change from June 2005 to June 2009?
- On October 28, 2006, Saskatchewan lowered its provincial sales tax (PST) from 7% to 5%. What percent reduction does this represent?
- A local Superstore sold 21,983 cases of its President’s Choice cola at $2.50 per case. In the following year, it sold 19,877 cases at $2.75 per case.
- What is the percent change in price year-over-year?
- What is the percent change in quantity year-over-year?
- What is the percent change in total revenue year-over-year? (Hint: revenue = price × quantity)
- A bottle of liquid laundry detergent priced at $16.99 for a 52-load bottle has been changed to $16.49 for a 48-load bottle. By what percentage has the price per load changed?
Challenge, Critical Thinking, & Other Applications
- At a boardroom meeting, the sales manager is happy to announce that sales have risen from $850,000 to $1,750,000 at a rate of 4.931998% per year. How many years did it take for the sales to reach $1,750,000?
- The Nova Scotia Pension Agency needs to determine the annual cost of living adjustment (COLA) for the pension payments made to its members. To do this, it averages the consumer price index (CPI) for both the previous fiscal year and the current fiscal year. It then calculates the percent change between the two years to arrive at the COLA. If CPI information is as follows, determine the COLA that the pensioners will receive.
| Previous Fiscal Year | Current Fiscal Year | ||||||
| Nov. | 109.2 | May | 112.1 | Nov. | 111.9 | May | 114.6 |
| Dec. | 109.4 | June | 111.9 | Dec. | 112.0 | June | 115.4 |
| Jan. | 109.4 | July | 112.0 | Jan. | 111.8 | July | 115.8 |
| Feb. | 110.2 | Aug. | 111.7 | Feb. | 112.2 | Aug. | 115.6 |
| Mar. | 111.1 | Sep. | 111.9 | Mar. | 112.6 | Sep. | 115.7 |
| Apr. | 111.6 | Oct. | 111.6 | Apr. | 113.5 | Oct. | 114.5 |
- During The Bay’s warehouse clearance days, it has reduced merchandise by 60%. As a bonus, today is Scratch ’n’ Save day, where you can receive up to an additional 25% off the reduced price. If you scratched the maximum of 25% off, how many dollars would you save off an item that is regularly priced at $275.97? What percent savings does this represent?
- Federal Canadian tax rates for 2010 and 2011 are listed below. For example, you pay no tax on income within the first bracket, 15% on income within the next bracket, and so on. If you earned $130,000 in each year, by what percentage did your federal tax rate change? In dollars, what was the difference?
| 2010 Tax Brackets | Taxed at | 2011 Tax Brackets |
| $0–$10,382 | 0% | $0–$10,527 |
| $10,383–$40,970 | 15% | $10,528–$41,544 |
| $40,971–$81,941 | 22% | $41,545–$83,088 |
| $81,942–$127,021 | 26% | $83,089–$128,800 |
| $127,022+ | 29% | $128,801+ |
- Melina is evaluating two colour laser printers for her small business. A Brother model is capable of printing 21 colour pages per minute and operates 162.5% faster than a similar Hewlett-Packard model. She needs to print 15,000 pages for a promotion. How much less time (stated as a percentage) will it take on the Brother model?
- A chocolate bar has been priced at $1.25 for a 52 gram bar. Due to vending machine restrictions, the manufacturer needs to keep the price the same. To adjust for rising costs, it lowers the weight of the bar to 48 grams.a. By what percentage has the price per gram changed? b. If this plan is implemented over two periods, what rate of change occurs in each period?
2.2 Averages
No matter where you go or what you do, averages are everywhere. Let’s look at some examples:
- Three-quarters of your student loan is spent. Unfortunately, only half of the first semester has passed, so you resolve to squeeze the most value out of the money that remains. But have you noticed that many grocery products are difficult to compare in terms of value because they are packaged in different sized containers with different price points? For example, one tube of toothpaste sells in a 125 mL size for $1.99 while a comparable brand sells for $1.89 for 110 mL. Which is the better deal? A fair comparison requires you to calculate the average price per millilitre.
- Your local transit system charges $2.25 for an adult fare, $1.75 for students and seniors, and $1.25 for children. Is this enough information for you to calculate the average fare, or do you need to know how many riders of each kind there are?
- Five years ago you invested $8,000 in Roller Coasters Inc. The stock value has changed by 9%, −7%, 13%, 4%, and −2% over these years, and you wonder what the average annual change is and whether your investment kept up with inflation.
- If you participate in any sport, you have an average of some sort: bowlers have bowling averages; hockey or soccer goalies have a goals against average (GAA); and baseball pitchers have an earned run average (ERA).
Averages generally fall into three categories. This section explores simple, weighted, and geometric averages.
Simple Averages
An average is a single number that represents the middle of a data set. It is commonly interpreted to mean the “typical value.” Calculating averages facilitates easier comprehension of and comparison between different data sets, particularly if there is a large amount of data. For example, what if you want to compare year-over-year sales? One approach would involve taking company sales for each of the 52 weeks in the current year and comparing these with the sales of all 52 weeks from last year. This involves 104 weekly sales figures with 52 points of comparison. From this analysis, could you concisely and confidently determine whether sales are up or down? Probably not. An alternative approach involves comparing last year’s average weekly sales against this year’s average weekly sales. This involves the direct comparison of only two numbers, and the determination of whether sales are up or down is very clear.
In a simple average, all individual data share the same level of importance in determining the typical value. Each individual data point also has the same frequency, meaning that no one piece of data occurs more frequently than another. Also, the data do not represent a percent change. To calculate a simple average, you require two components:
- The data itself—you need the value for each piece of data.
- The quantity of data—you need to know how many pieces of data are involved (the count), or the total quantity used in the calculation.
Simple Average
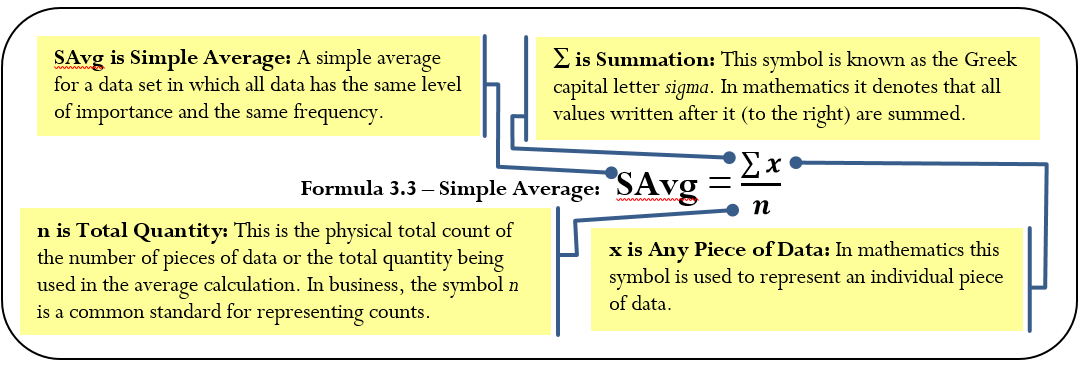
As expressed in Formula 3.3, you calculate a simple average by adding together all of the pieces of data then taking that total and dividing it by the quantity.
How It Works
The steps required to calculate a simple average are as follows:
Step 1: Sum every piece of data.
Step 2: Determine the total quantity involved.
Step 3: Calculate the simple average using Formula 3.3.
Assume you want to calculate an average on three pieces of data: 95, 108, and 97. Note that the data are equally important and each appears only once, thus having the same frequency. You require a simple average.
Step 1: Σx = 95 + 108 + 97 = 300.
Step 2: There are three pieces of data, or n = 3.
Step 3: Apply Formula 3.3: SAvg =  . The simple average of the data set is 100.
Important Notes
Although mentioned earlier, it is critical to stress that a simple average is calculated only when all of the following conditions are met:
- All of the data shares the same level of importance toward the calculation.
- All of the data appear the same number of times.
- The data does not represent percent changes or a series of numbers intended to be multiplied with each other.
If any of these three conditions are not met, then either a weighted or geometric average is used depending on which of the above criteria failed. We discuss this later when each average is introduced.
Give It Some Thought
It is critical to recognize if you have potentially made any errors in calculating a simple average. Review the following situations and, without making any calculations, determine the best answer.
- The simple average of 15, 30, 40, and 45 is: a. lower than 20. b. between 20 and 40, inclusive. c. higher than 40.
- If the simple average of three pieces of data is 20, which of the following data do not belong in the data set? Data set: 10, 20, 30, 40 a. 10 b. 20 c. 30 d. 40
Solutions:
- b (a simple average should fall in the middle of the data set, which appears spread out between 15 and 45, so the middle would be around 30)
- d (if the number 40 is included in any average calculation involving the other numbers, it is impossible to get a low average of 20)
Example 2.2 A: Comparing Average Sales
Weighted Averages
Have you considered how your grade point average (GPA) is calculated? Your business program requires the successful completion of many courses. Your grades in each course combine to determine your GPA; however, not every course necessarily has the same level of importance as measured by your course credits.
Perhaps your math course takes one hour daily while your communications course is only delivered in one-hour sessions three times per week. Consequently, the college assigns the math course five credit hours and the communications course three credit hours. If you want an average, these different credit hours mean that the two courses do not share the same level of importance, and therefore a simple average cannot be calculated.
In a weighted average, not all pieces of data share the same level of importance or they do not occur with the same frequency. The data cannot represent a percent change or a series of numbers intended to be multiplied with each other. To calculate a weighted average, you require two components:
- The data itself—you need the value for each piece of data.
- The weight of the data—you need to know how important each piece of data is to the average. This is either an assigned value or a reflection of the number of times each piece of data occurs (the frequency).
The Formula
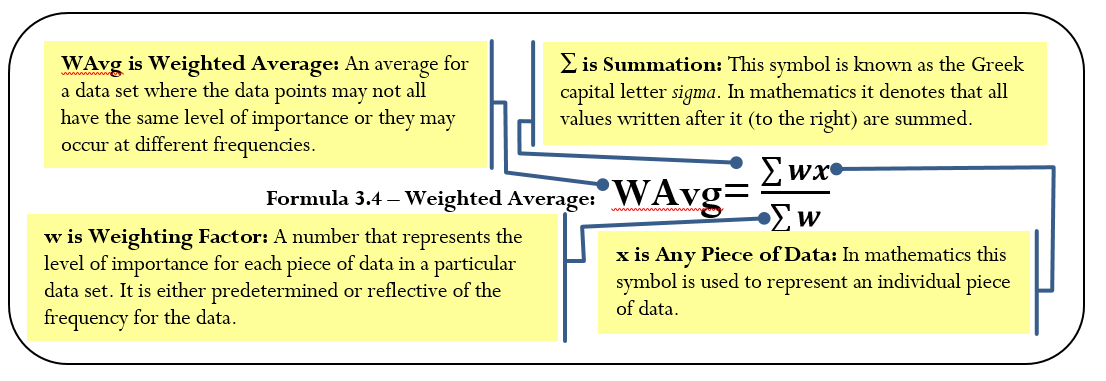
As expressed in Formula 3.4, calculate a weighted average by adding the products of the weights and data for the entire data set and then dividing this total by the total of the weights.
Weighted Average
How It Works
The steps required to calculate a weighted average are:
Step 1: Sum every piece of data multiplied by its associated weight.
Step 2: Sum the total weight.
Step 3: Calculate the weighted average using Formula 3.4.
Let’s stay with the illustration of the math and communications courses and your GPA. Assume that these are the only two courses you are taking. You finish the math course with an A, translating into a grade point of 4.0. In the communications course, your C+ translates into a 2.5 grade point. These courses have five and three credit hours, respectively. Since they are not equally important, you use a weighted average.
Step 1: In the numerator, sum the products of each course’s credit hours (the weight) and your grade point (the data). This means (math credit hours × math grade point) + (communications credit hours × communications grade point). Numerically, this is Σwx = (5 × 4) + (3 × 2.5) = 27.5.
Step 2: In the denominator, sum the weights. These are the credit hours. You have Σw = 5 + 3 = 8.
Step 3: Apply Formula 3.4 to calculate your GPA.
WAvg =  (GPAs have two decimals).
Note that your GPA is higher than if you had just calculated a simple average of  . This happens because your math course, in which you scored a higher grade, was more important in the calculation.
Things To Watch Out For
The most common error in weighted averages is to confuse the data with the weight. If you have the two backwards, your numerator is still correct; however, your denominator is incorrect. To distinguish the data from the weight, notice that the data forms a part of the question. In the above example, you were looking to calculate your grade point average; therefore, grade point is the data. The other information, the credit hours, must be the weight.
Paths To Success
The formula used for calculating a simple average is a simplification of the weighted average formula. In a simple average, every piece of data is equally important. Therefore, you assign a value of 1 to the weight for each piece of data. Since any number multiplied by 1 is the same number, the simple average formula omits the weighting in the numerator as it would have produced unnecessary calculations. In the denominator, the sum of the weights of 1 is no different from counting the total number of pieces of data. In essence, you can use a weighted average formula to solve simple averages.
Give It Some Thought
In each of the following, determine which information is the data and which is the weight.
- Rafiki operates a lemonade stand during his garage sale today. He has sold 13 small drinks for $0.50, 29 medium drinks for $0.90, and 21 large drinks for $1.25. What is the average price of the lemonade sold?
- Natalie received the results of a market research study. In the study, respondents identified how many times per week they purchased a bottle of Coca-Cola. Calculate the average number of purchases made per week.
| Purchases per Week | # of People |
| 1 | 302 |
| 2 | 167 |
| 3 | 488 |
| 4 | 256 |
Solutions:
- The price of the drinks is the data, and the number of drinks is the weight.
- The purchases per week is the data, and the number of people is the weight.
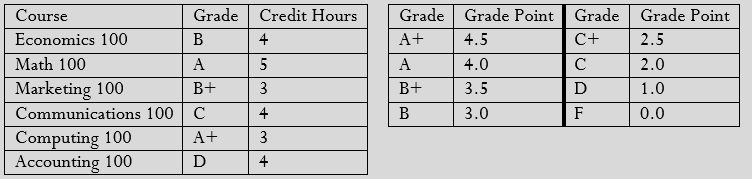
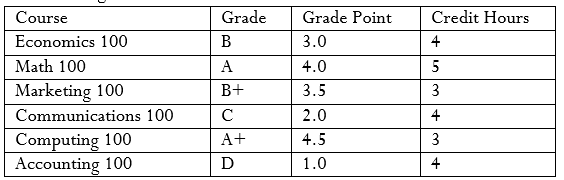
Example 2.2 B: Calculating Weighted GPA
|
A mark transcript received by a student at a local college. The chart shows how the grade translates into a grade point.
Calculate the student's grade point average (GPA). Round your final answer to two decimals.
|
|
|
The courses do not carry equal weights as they have different credit hours. Therefore, to calculate the GPA you must find a weighted average, or WAvg.
|
|
|
What You Already Know Since the question asked for the grade point average, the grade points for each course are the data, or x. The corresponding credit hours are the weights, or w.
|
How You Will Get There You need to convert the grade for each course into a grade point using the secondary table. Then perform the following steps: Step 1: Sum every piece of data multiplied by its associated weight. Step 2: Sum the total weight. Step 3: Calculate the weighted average using Formula 3.4.
|
|
Convert the grades:
Step 1: Step 2: Step 3:
|
|
|
The student's GPA is 2.96. Note that math contributed substantially (almost one-third) to the student's grade point because this course was weighted heavily and the student performed well.
|
|


Geometric Averages
How do you average a percent change? If sales increase 100% this year and decrease 50% next year, is the average change in sales an increase of  per year? The answer is clearly “no.” If sales last year were $100 and they increased by 100%, that results in a $100 increase. The total sales are now $200. If sales then decreased by 50%, you have a $100 decrease. The total sales are now $100 once again. In other words, you started with $100 and finished with $100. That is an average change of nothing, or 0% per year! Notice that the second percent change is, in fact, multiplied by the result of the first percent change. A geometric average finds the typical value for a set of numbers that are meant to be multiplied together or are exponential in nature.
The Formula
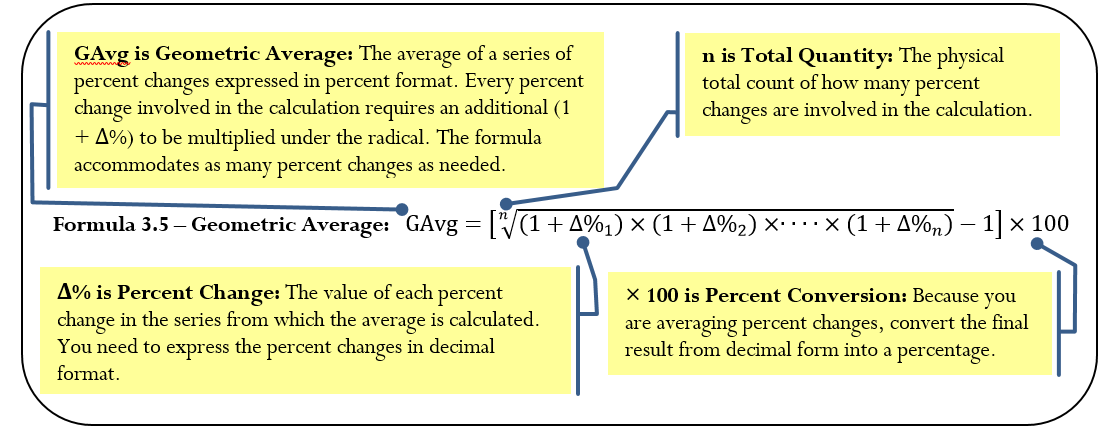
In business mathematics, you most commonly use a geometric average to average a series of percent changes. Formula 3.5 is specifically written to address this situation.
Geometric Average
How It Works
To calculate a geometric average follow these steps:
Step 1: Identify the series of percent changes to be multiplied.
Step 2: Count the total number of percent changes involved in the calculation.
Step 3: Calculate the geometric average using Formula 3.5.
Let’s use the sales data presented above, according to which sales increase 100% in the first year and decrease 50% in the second year. What is the average percent change per year?
Step 1: The changes are Δ%1 = +100% and Δ%2 = -50%.
Step 2: Two changes are involved, or n = 2.
Step 3: Apply Formula 3.5:
![{\rm{GAvg}} = \left[ {\sqrt[2]{{\left( {1 + 100\% } \right) \times \left( {1 - 50\% } \right)}} - 1} \right] \times 100](https://ecampusontario.pressbooks.pub/app/uploads/quicklatex/quicklatex.com-a8c1ca7718aa2781185d276763c3fd5f_l3.png "Rendered by QuickLaTeX.com")
![= \left[ {\sqrt[2]{{2 \times 0.5}} - 1} \right] \times 100 = \left[ {\sqrt[2]{1} - 1} \right] \times 100 = 0 \times 100 = 0\%](https://ecampusontario.pressbooks.pub/app/uploads/quicklatex/quicklatex.com-f9af5d74c805bdbe79be30799d9d6dce_l3.png "Rendered by QuickLaTeX.com")
The average percent change per year is 0% because an increase of 100% and a decrease of 50% cancel each other out.
Important Notes
A critical requirement of the geometric average formula is that every (1 + Δ%) expression must result in a number that is positive. This means that the Δ% cannot be a value less than -100% else Formula 3.5 cannot be used.
Paths To Success
An interesting characteristic of the geometric average is that it will always produce a number that is either smaller than (closer to zero) or equal to the simple average. In the example, the simple average of +100% and -50% is 25%, and the geometric average is 0%. This characteristic can be used as an error check when you perform these types of calculations.
Give It Some Thought
For the first three questions, determine whether you should calculate a simple, weighted, or geometric average.
- Randall bowled 213, 245, and 187 in his Thursday night bowling league and wants to know his average.
- Cindy invested in a stock that increased in value annually by 5%, 6%, 3%, and 5%. She wants to know her average increase.
- A retail store sold 150 bicycles at the regular price of $300 and 50 bicycles at a sale price of $200. The manager wants to know the average selling price.
- Gonzalez has calculated a simple average of 50% and a geometric average of 60%. He believes his numbers are correct. What do you think?
Solutions:
- Simple; each item has equal importance and frequency.
- Geometric; these are a series of percent changes on the price of stock.
- Weighted; each item has a different frequency.
- At least one of the numbers is wrong since a geometric average is always smaller than or equal to the simple average
Example 2.2 C: Changing Prices
|
From 2006 to 2010, WestJet’s year-over-year annual revenues changed by +21.47%, +19.89%, -10.55%, and +14.38%. This reflects growth from sales of $1.751 billion in 2006 to $2.609 billion in 2010.[1] What is the average percent growth in revenue for WestJet during this time frame?
|
|
|
Note that these numbers reflect percent changes in revenue. Year-over-year changes are multiplied together, so you would calculate a geometric average, or GAvg.
|
|
|
What You Already Know Step 1: You know the four percent changes: Δ%1 = 21.47% Δ%2 = 19.89% Δ%3 = -10.55% Δ%4 = 14.38%
Step 2: Four changes are involved, or n = 4.
Step 3:
|
How You Will Get There Step 3: Express the percent changes in decimal format and substitute into Formula 3.5.
|
|
On average, WestJet revenues have grown 10.483% each year from 2006 to 2010.
|
|
![{\rm{GAvg}} = \left[ {\sqrt[4]{{\left( {1 + 0.2147} \right) \times \left( {1 + 0.1989} \right) \times \left( {1 - 0.1055} \right)\; \times \left( {1 + 0.1438} \right)}} - 1} \right] \times 100 = 10.483\%](https://ecampusontario.pressbooks.pub/app/uploads/quicklatex/quicklatex.com-70ec34421e973f93bb2fb6c4eaed0d88_l3.png "Rendered by QuickLaTeX.com")
Exercises
Mechanics
Calculate a simple average for questions 1 and 2.
| Data | |
| 1. | 8, 17, 6, 33, 15, 12, 13, 16 |
| 2. | $1,500 $2,000 $1,750 $1,435 $2,210 |
Calculate a weighted average for questions 3 and 4.
| 3. | 4 | 4 | 4 | 4 | 12 | 12 | 12 | 12 | 12 | 12 | 12 | 15 | 15
|
||||
| 4. | Data | $3,600 | $3,300 | $3,800 | $2,800 | $5,800 | |||||||||||
| Weight | 2 | 5 | 3 | 6 | 4 | ||||||||||||
Calculate a geometric average for exercises 5 and 6. Round all percentages to four decimals.
| 5. | 5.4% | 8.7% | 6.3% | ||
| 6. | 10% | -4% | 17% | -10% | |
Applications
- If a 298 mL can of soup costs $2.39, what is the average price per millilitre?
- Kerry participated in a fundraiser for the Children’s Wish Foundation yesterday. She sold 115 pins for $3 each, 214 ribbons for $4 each, 85 coffee mugs for $7 each, and 347 baseball hats for $9 each. Calculate the average amount Kerry raised per item.
- Stephanie’s mutual funds have had yearly changes of 9.63%, -2.45%, and 8.5%. Calculate the annual average change in her investment.
- In determining the hourly wages of its employees, a company uses a weighted system that factors in local, regional, and national competitor wages. Local wages are considered most important and have been assigned a weight of 5. Regional and national wages are not as important and have been assigned weights of 3 and 2, respectively. If the hourly wages for local, regional, and national competitors are $16.35, $15.85, and $14.75, what hourly wage does the company pay?
- Canadian Tire is having an end-of-season sale on barbecues, and only four floor models remain, priced at $299.97, $345.49, $188.88, and $424.97. What is the average price for the barbecues?
- Calculate the grade point average (GPA) for the following student. Round your answer to two decimals.
| Course | Grade | Credit Hours | Grade | Grade Point | Grade | Grade Point | |
| Economics 100 | D | 5 | A+ | 4.5 | C+ | 2.5 | |
| Math 100 | B | 3 | A | 4.0 | C | 2.0 | |
| Marketing 100 | C | 4 | B+ | 3.5 | D | 1.0 | |
| Communications 100 | A | 2 | B | 3.0 | F | 0.0 | |
| Computing 100 | A+ | 3 | |||||
| Accounting 100 | B+ | 4 |
- An accountant needs to report the annual average age (the length of time) of accounts receivable (AR) for her corporation. This requires averaging the monthly AR averages, which are listed below. Calculate the annual AR average.
| Month | Monthly AR Average | Month | Monthly AR Average | Month | Monthly AR Average |
| January | $45,000 | May | $145,000 | September | $185,000 |
| February | $70,000 | June | $180,000 | October | $93,000 |
| March | $85,000 | July | $260,000 | November | $60,000 |
| April | $97,000 | August | $230,000 | December | $50,000 |
- From January 2007 to January 2011, the annual rate of inflation has been 2.194%, 1.073%, 1.858%, and 2.346%. Calculate the average rate of inflation during this period.
Challenge, Critical Thinking, & Other Applications
- Gabrielle is famous for her trail mix recipe. By weight, the recipe calls for 50% pretzels, 30% Cheerios, and 20% peanuts. She wants to make a 2 kg container of her mix. If pretzels cost $9.99/kg, Cheerios cost $6.99/kg, and peanuts cost $4.95/kg, what is the average cost per 100 g rounded to four decimals?
- Caruso is the marketing manager for a local John Deere franchise. He needs to compare his average farm equipment sales against his local Case IH competitor’s sales. In the past three months, his franchise has sold six $375,000 combines, eighteen $210,000 tractors, and fifteen $120,000 air seeders. His sales force estimates that the Case IH dealer has sold four $320,000 combines, twenty-four $225,000 tractors, and eleven $98,000 air seeders. Express the Case IH dealer’s average sales as a percentage of the John Deere dealer’s average sales.
- You are shopping for shampoo and consider two brands. Pert is sold in a bundle package of two 940 mL bottles plus a bonus bottle of 400 mL for $13.49. Head & Shoulders is sold in a bulk package of three 470 mL bottles plus a bonus bottle of 280 mL for $11.29.
- Which package offers the best value?
- If the Head & Shoulders increases its package size to match Pert at the same price per mL, how much money do you save by choosing the lowest priced package?
- The following are annual net profits (in millions of dollars) over the past four years for three divisions of Randy’s Wholesale:
-
- Cosmetics: $4.5, $5.5, $5.65, $5.9
- Pharmaceutical: $15.4, $17.6, $18.5, $19.9
- Grocery: $7.8, $6.7, $9.87, $10.75
- Rank the three divisions from best performing to worst performing based on average annual percent change.
- You are shopping for a Nintendo Wii gaming console and visit www.shop.com, which finds online sellers and lists their prices for comparison. Based on the following list, what is the average price for a gaming console (rounded to two decimals)?
| NothingButSoftware.com | $274.99 |
| eComElectronics | $241.79 |
| NextDayPC | $241.00 |
| Ecost.com | $249.99 |
| Amazon | $169.99 |
| eBay | $165.00 |
| Buy.com | $199.99 |
| HSN | $299.95 |
| Gizmos for Life | $252.90 |
| Toys ‘R’ Us | $169.99 |
| Best Buy | $169.99 |
| The Bay | $172.69 |
| Walmart | $169.00 |
- Juanita receives her investment statement from her financial adviser at Great-West Life. Based on the information below, what is Juanita’s average rate of return on her investments?
| Investment Fund | Proportion of Entire Portfolio Invested in Fund | Fund Rate of Return |
| Real Estate | 0.176 | 8.5% |
| Equity Index | 0.073 | 36.2% |
| Mid Cap Canada | 0.100 | −1.5% |
| Canadian Equity | 0.169 | 8.3% |
| US Equity | 0.099 | −4.7% |
| US Mid Cap | 0.091 | −5.7% |
| North American Opportunity | 0.063 | 2.5% |
| American Growth | 0.075 | −5.8% |
| Growth Equity | 0.085 | 26.4% |
| International Equity | 0.069 | −6.7% |
2.3 Ratios, Proportions, and Prorating
You and your business partner have a good problem: Consumers are snapping up packets of your new eucalyptus loganberry facial scrub as fast as you can produce them. Each packet of the scrub contains 600 mg of loganberry extract and 80 mg of eucalyptus oil, as well as water and clay and other ingredients. Ratios are invaluable in understanding the relationship among different quantities, such as how much of each ingredient you need.
You have no trouble obtaining the water and clay, but the loganberry extract and eucalyptus oil are in short supply because of poor weather. In any time period, your suppliers can provide seven times as much loganberry extract as eucalyptus oil. To figure out which ingredient is limiting your production, you need proportions.
Sometimes you need to relate a proportion to the total of the quantities. This requires prorating skills. For example, once your business has grown, you start using a production line, which follows the common practice of producing more than one product. The papaya facial scrub you have introduced recently and the eucalyptus loganberry scrub require the same amount of production time. Your equipment capacity is 1,000 units per day. How many units of each type of scrub must you produce to meet market demand in the ratio of nine to two?
Years later, you are splitting the profits of your business partnership in proportion to each partner’s total investment. You invested $73,000, while your partner invested $46,000. With total profits of $47,500, what is your share?
Understanding the relationships among various quantities and how the components relate to an overall total emphasizes the need for understanding ratios, proportions, and prorating.
What Is a Ratio?
A ratio is a fixed relationship between two or more quantities, amounts, or sizes of a similar nature. For a ratio to exist, all terms involved in the ratio must be nonzero. Examine the criteria of this definition more closely:
- There Must Be Two or More Quantities. A ratio does not exist if only one quantity is involved. For example, the fuel tank on your Mustang takes 60 litres of gasoline. This is not a ratio, as there is no relationship to any other quantity, amount, or size. On the other hand, if you compare your fuel tank to the fuel tank of your friend’s Hummer, you now have two quantities involved and could say that her fuel tank has twice the capacity of yours.
- All Terms Must Be of a Similar Nature. In all of the examples provided note that all quantities, amounts, or sizes are based on the same unit. In the cosmetics formulation it was milligrams to milligrams; in the production line, it was units to units; in the investment scenario, it was dollars to dollars. For a ratio to have meaning and to be properly interpreted, all terms of the ratio must be expressed in a similar nature. When you place different units such as kilometres and metres into the same ratio, the result is confusing and will lead to misinterpretation of the relationship.
- All Terms Must Be Nonzero. The numbers that appear in a ratio are called the terms of the ratio. If we have a recipe with four cups of flour to one cup of sugar, there are two terms: four and one. If any term is zero, then the quantity, amount, or size does not exist. For example, if the recipe called for four cups of flour to zero cups of sugar, there is no sugar! Therefore, every term must have some value other than zero.
Let’s continue using the example of four cups of flour to one cup of sugar. Business ratios are expressed in five common formats, as illustrated in the table below.
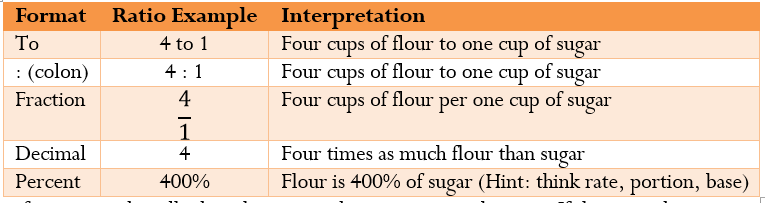
All of these formats work well when there are only two terms in the ratio. If there are three or more terms, ratios are best expressed in the colon format. For example, if the recipe called for four parts of flour to one part of sugar to two parts of chocolate chips, the ratio is 4 : 1 : 2. The fraction, decimal, and percent forms do not work with three or more terms.
Simplification and Reduction of Ratios
When a ratio is used to express a relationship between different variables, it must be easy to understand and interpret. Sometimes when you set up a ratio initially, the terms are difficult to comprehend. For example, what if the recipe called for 62½ parts flour to 25 parts sugar? That is not very clear. Expressing the same ratio another way, you can say the recipe requires 5 parts flour to 2 parts sugar. Note how the relationship is clearer in the latter expression. Either way, though, both ratios mean the same thing; in decimal format this ratio is expressed as a value of 2.5. Recall that Section 2.2 discussed how fractions are expressed in higher and lower terms. We now apply the same knowledge to ratios to make the relationship as clear as possible.
When you reduce ratios to lower terms, remember two important characteristics involving the cardinal rule and integers:
- The Cardinal Rule. Recall from Section 2.5 that the cardinal rule of algebra states, “What you do to one you must do to the other.” In other words, whatever mathematical operation is performed on a term in a ratio must be equally performed on every other term in the ratio. If this rule is violated then the relationship between the terms is broken.
- Maintaining Integers. Integers are easier to understand than decimals and fractions. In reducing a ratio to lower terms, aim to maintain every term as an integer (much as in Section 2.2).
How It Works
The steps involved in reducing ratios to lower terms are listed below. You may not need some steps, so skip them if the characteristic is not evident in the ratio.
Step 1: Clear any fractions that, when divided, produce a nonterminating decimal. Apply the rules of algebra and multiply each term by the denominator being cleared from the ratio. For example, if the ratio is , the first term when divided produces a nonterminating decimal. Clear the fraction by multiplying every term by the denominator of 3, resulting in a ratio of 1 : 6.
Step 2: Perform division on all fractions that produce a terminating decimal. For example, if the ratio is , both terms convert to terminating decimals, resulting in a ratio of 0.4 : 0.3.
Step 3: Eliminate all decimals from the ratio through multiplication. In other words, express the ratio in higher terms by multiplying every term by a power of 10. The power of 10 you choose must be large enough to eliminate all decimals. For example, if the ratio is 0.2 : 0.25 : 0.125, notice that the third term has the most decimal positions. A power of 1,000 (103) is required to move the decimal three positions to the right. Multiply every term by a power of 1,000, resulting in a ratio of 200 : 250 : 125.
Step 4: Find a common factor that divides evenly into every term, thus producing integers. If you find no such factors, then the ratio is in its lowest terms. For example, if the ratio is 10 : 4 : 6 it can be factored by dividing every term by 2, resulting in a ratio of 5 : 2 : 3. There is no common factor that reduces this ratio further; therefore, it is in its lowest terms.
Important Notes
To factor any term, recall your multiplication tables. Assume the ratio is 36 : 24. It is always best to pick the lowest term in the ratio when factoring. Looking at the 24 and recall what multiplies together to arrive at 24. In this case, your factors are 1 × 24, 2 × 12, 3 × 8, and 4 × 6. The goal is to find the largest value among these factors that also divides evenly into the other term of 36. The largest factor that makes this true is 12. Therefore, perform step 4 in our reduction process by dividing every term by a factor of 12, resulting in a ratio of 3 : 2.
Things To Watch Out For
Always ensure that before you apply any of the reduction steps your relationship meets the requirements of being a ratio in the first place. For example, the expression of 10 km : 500 m is not a 1 : 50 ratio since it violates the “similar nature” characteristic of the ratio definition. You need to convert the metres into kilometres, producing 10 km : 0.5 km. Now that you have a ratio, the reduction to lowest terms results in a 20 : 1 ratio. This is very different than 1 : 50! The lesson learned is to make sure you are working with a proper ratio before you manipulate it.
Paths To Success
In the fourth step of the procedure, do not feel compelled to find what is called the “magic factor.” This is the single factor that reduces the ratio to its lowest terms in a single calculation. Although this is nice if it happens, you may as well find any factor that will make the ratio smaller and easier to work with.
- For example, assume a ratio of 144 : 72 : 96. It may not be very apparent what factor goes into each of these terms on first glance. However, they are all even numbers, meaning they can all be divided by 2. This produces 72 : 36 : 48.
- Once again, the “magic factor” may not be clear, but every term is still even. Divide by 2 again, producing 36 : 18 : 24.
- If no magic factor is apparent, again note that all numbers are even. Divide by 2 yet again, producing 18 : 9 : 12.
- The common factor for these terms is 3. Divided into every term you have 6 : 3 : 4. There is no common factor for these terms, and the ratio is now in its lowest terms.
In the above example it took four steps to arrive at the answer—and that is all right. Did you notice the “magic factor” that could have solved this in one step? You can find it if you multiply all of the factors you have: 2 × 2 × 2 × 3 = 24. Dividing every term in the original ratio by 24 produces the solution in one step. If you did not notice this “magic factor,” there is nothing wrong with taking four steps (or more!) to get the answer. In the end, both methods produce the same solution.
Example 2.3 A: Reducing Ratios to Lowest Terms
|
Reduce the following ratios to their lowest terms: a. 49 : 21 b. 0.33 : 0.066 c.
|
||||
|
You have been asked to reduce the ratios to their lowest terms.
|
||||
|
What You Already Know The four ratios to be reduced have been provided in colon format.
|
How You Will Get There Step 1: Clear all fractions that produce nonterminating decimals. Step 2: Perform division on all fractions that produce terminating decimals. Step 3: Eliminate all decimals through multiplication. Step 4: Divide every term by a common factor, reducing it to the lowest terms.
|
|||
|
Step
|
a. 49 : 21
|
b. 0.33 : 0.066
|
c.
|
d. 5⅛ : 6⅞
|
|
1.
|
No fractions
|
No fractions
|
Multiply both terms by 11:
|
No fractions that produce nonterminating decimals
|
|
2.
|
No fractions
|
No fractions
|
Perform division: 49.5 : 3
|
Perform division: 5.125 : 6.875
|
|
3.
|
No decimals
|
Clear decimals by multiplying by 1,000: 330 : 66
|
Clear decimals by multiplying by 10: 495 : 30
|
Clear decimals by multiplying by 1,000: 5,125 : 6,875
|
|
4.
|
Divide by 7: 7 : 3
|
Divide by 66: 5 : 1
|
Divide by 15: 33 : 2
|
Divide by 125: 41 : 55
|
|
In lowest terms, the ratios are 7 : 3, 5 : 1, 33 : 2, and 41 : 55, respectively.
|
||||
 d. 5⅛ : 6⅞
Reducing a Ratio to the Smallest Term of One
Your goal in reducing a ratio is to make it easier to understand. Sometimes, even after you have applied the techniques for reducing the ratio, the end result is still hard to grasp. Look at part (d) of Example 3.3A. You arrived at a final solution of 41 : 55, with no further reduction possible. Think of this as 41 cups of flour to 55 cups of sugar. The relationship is not very clear.
In these circumstances, although integers are preferable in general, you must reduce the ratio further, reintroducing decimals to make the relationship more comprehensible. This means you apply a technique called “reducing the ratio to the smallest term of one.” In this technique, the smallest term in the ratio will have a value of 1 once you perform the ratio reduction and simplification.
How It Works
Follow these steps to reduce a ratio to the smallest term of one:
Step 1: Locate the smallest term in the ratio. (Do not just pick the first term.)
Step 2: Divide every term in the ratio by the selected smallest term. Every other term becomes a decimal number, for which either a clear rounding instruction is provided or you must obey the rounding rules used in this textbook. The smallest term by nature of the division equals one.
Let’s continue with part (d) of Example 3.3A, in which the reduced ratio is 41 : 55.
Step 1: Locate the smallest term in the ratio. It is the first term and has a value of 41.
Step 2: Take every term and divide it by 41 to arrive at 1 :  . The decimal number allows you to roughly interpret the ratio as “one cup of flour to a touch over 1⅓ cups of sugar.” Although not perfect, this is more understandable than 41 : 55.
Important Notes
You may have to make a judgment call when you decide whether to leave a reduced ratio alone or to reduce it to a ratio where the smallest term is one. There is no clear definitive rule; however, keep the following two thoughts in mind:
- For purposes of this textbook, you are provided with clear instructions on how to handle the ratio, allowing everyone to arrive at the same solution. Your instructions will read either “Reduce the ratio to its smallest terms” or “Reduce the ratio to the smallest term of one.”
- In the real world, no such instructions exist. Therefore you should always base your decision on which format is easier for your audience to understand. If the reduced fraction leaves your audience unable to understand the relationship, then use the reduction to a ratio with the smallest term of one instead.
Example 2.3 B: Maintaining Inventory
|
The inventory management system at your company requires you to keep a ratio of 27 to 47 Nintendo Wiis to Sony PlayStations on the shelf. There are 38 Nintendo Wiis on the shelf. a. Express the ratio where the smallest term is one. Round your solution to two decimals. b. Using the ratio, determine how many PlayStations should be in your inventory.
|
|
|
These terms have no common factor (note that 47 is a prime number). The terms in this ratio cannot be reduced in any way, which makes the relationship difficult to assess. Therefore, reduce the ratio to the smallest term of one. Once the relationship is more evident, determine how many PlayStations need to be on the shelf.
|
|
|
What You Already Know The ratio of Wiis to PlayStations is 27 : 47. 38 Wiis are currently on the shelf. Step 1: The smallest term is 27. Step 2: Divide every term by 27. The inventory management requires 1.74 units of PlayStations to be on the shelf for every unit of Wiis. Step 3: 38 × 1.74 = 66.12 units. Since only whole units are possible, round to the nearest integer of 66.
|
How You Will Get There Step 1: Locate the smallest term. Step 2: Divide all terms by the smallest term to get the ratio. Step 3: Use the ratio to calculate the number of PlayStations needed on the shelf.
|
|
The inventory management system requires approximately 1.74 PlayStations for every Nintendo Wii on the shelf. Therefore, with 38 Wiis on the shelf you require 66 PlayStations to also be on the shelf.
|
|
What Are Proportions?
Knowing the relationship between specific quantities is helpful, but what if your quantity happens not to match the specific quantity expressed in the existing ratio? Example 3.3B illustrated that you need to learn how to apply the ratio to meet current conditions. The ratio in the inventory system was expressed in terms of 27 Nintendo Wiis; however, the shelf displayed 38 units. How can we relate an existing ratio to a needed ratio?
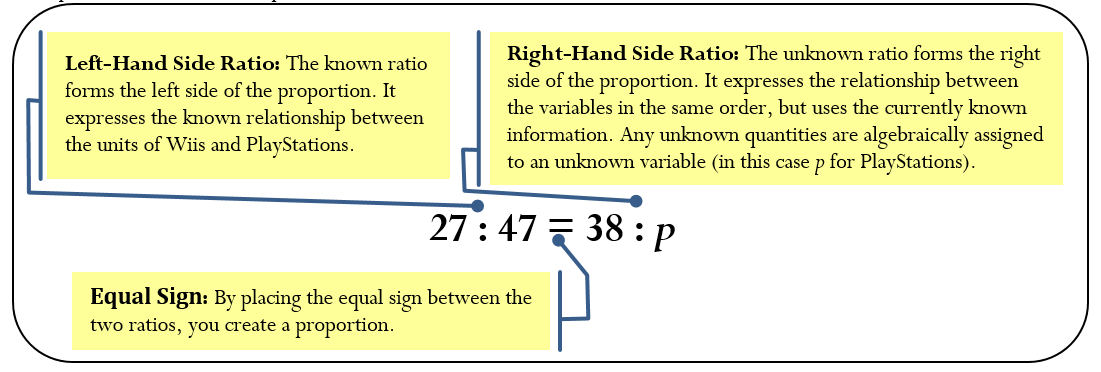
A proportion is a statement of equality between two ratios. Just as we have both algebraic expressions and algebraic equations, there are ratios and proportions. With algebraic expressions, only simplification was possible. When the expression was incorporated into an algebraic equation, you solved for an unknown. The same is true for ratios and proportions. With ratios, only simplification is possible. Proportions allow you to solve for any unknown variable. The Wii and PlayStation example could have been set up as follows:
Proportions
A proportion must adhere to three characteristics, including ratio criteria, order of terms, and number of terms.
- Characteristic #1: Ratio Criteria Must Be Met. By definition, a proportion is the equality between two ratios. If either the left side or the right side of the proportion fails to meet the criteria for being a ratio, then a proportion cannot exist.
- Characteristic #2: Same Order of Terms. The order of the terms on the left side of the proportion must be in the exact same order of terms on the right side of the proportion. For example, if your ratio is the number of MP3s to CDs to DVDs, then your proportion is set up as follows:
MP3 : CD : DVD = MP3 : CD : DVD
- Characteristic #3: Same Number of Terms. The ratios on each side must have the same number of terms such that every term on the left side has a corresponding term on the right side. A proportion of MP3 : CD : DVD = MP3 : CD is not valid since the DVD term on the left side does not have a corresponding term on the right side.
When you work with proportions, the mathematical goal is to solve for an unknown quantity or quantities. In order to solve any proportion, always obey the following four rules:
- Rule #1: At Least One Value for Any Term Is Known. At least one of the left side or right side values for each term must be known. For example, x : 5 = y : 10 is not a solvable proportion since the corresponding first terms on both sides are unknown. However, 15 : 5 = y : 10 is solvable since at least one of the first corresponding terms (the 15 and the y) is known.
- Rule #2: One Pair of Corresponding Terms Must Be Known. At least one pair of corresponding terms on the left side and right side must have both quantities known. For example, 3 : x : 6 = y : 4 : z is not a solvable proportion since there is no pair of first terms (3 and y), second terms (x and 4), or third terms (6 and z) that produces a pair of known values. However, 3 : x : 6 = 9 : 4 : z is a solvable proportion since the first terms on both sides (the 3 and 9) are known.
- Rule #3: Obey BEDMAS and Perform Proper Algebraic Manipulation. To manipulate a proportion, you must satisfy the rules of BEDMAS (Section 2.1) and all of the rules of algebra (Sections 2.4 and 2.5). Violating any of these rules breaks the equality of the ratios and produces an incorrect proportion.
- Rule #4: Use the Fractional Format. The fractional format for ratios is recommended for solving a proportion. The other four formats generally make solving the proportion much more difficult, and the mathematical operations required become unclear.
How It Works
Follow these steps in solving any proportion for an unknown variable or variables:
Step 1: Set up the proportion with the known ratio on the left side. Place the ratio with any unknown variables on the right side.
Step 2: Work with only two terms at a time, and express the two terms in fractional format. This is not a problem if the proportion has only two terms on each side of the equation, for example, 27 : 47 = 38 : p. This is expressed as  . If the proportion has three or more terms on each side, you can pick any two terms from each side of the proportion so long as you pick the same two terms on each side. In making your selection, aim to have a pair of terms on one side of the equation where both values are known while the other side of the equation is made up of one known term and one unknown term. For example, assume the proportion 6 : 5 : 4 = 18 : 15 : y. The selection of the first and third terms only on each side of the equation produces 6 : 4 = 18 : y. Notice that this is now a proportion with only two terms on each side, which you can express as
Step 3: Solve for the unknown variable. Obey the rules of BEDMAS and perform proper algebraic manipulation.
Step 4: If the proportion contained more than one unknown variable, go back to step 2 and select another pairing that isolates one of the unknown variables. Although one of the unknown variables is now known as a result of step 3, do not use this known value in making your selection. The danger in using a solved unknown variable is that if an error has occurred, the error will cascade through all other calculations. For example, assume the original proportion was 3 : 7 : 6 : 8 = x : y : z : 28. From step 2 you may have selected the pairing of 3 : 8 = x : 28, and in step 3 you may have erroneously calculated x = 11.5 (the correct answer is x = 10.5). In returning to step 2 to solve for another unknown variable, do not involve x in your next pairing. To isolate y, use 7 : 8 = y : 28 and not 3 : 7 = 11.5 : y, which will at least ensure that your calculation of y is not automatically wrong based on your previous error.
Things To Watch Out For
You must always pick terms from the same positions on both sides of the proportion. Otherwise, you will violate the equality of the proportion, since the terms are no longer in the same order on both sides and Characteristic #2 is not satisfied. For example, in working with the proportion 6 : 5 : 4 = 18 : 15 : y from above, you cannot select the first and third terms on the left side and also select the second and third terms on the right side. In other words, 6 : 4 ≠ 15 : y since 1st term : 3rd term ≠ 2nd term : 3rd term.
Paths To Success
It is always easiest to solve a proportion when the unknown variable is in the numerator. This characteristic requires minimal algebra and calculations to isolate the variable. If you find yourself with an unknown variable in the denominator, you can mathematically invert the fraction on both sides, since this obeys the cardinal rule of “what you do to one, you must do to the other.” When you invert, the numerator becomes the denominator and vice versa. For example, if the proportion is  , inversion then produces a proportion of 2.09 and later!

Notice that isolating the unknown variable in the inverted proportion requires only a multiplication of 12 on both sides. This is a lot less work!
Give It Some Thought
- Some of the following proportions violate the characteristics or rules of proportions. Examine each and determine if all the rules and characteristics are met. If not, identify the problem.
| a. 4 : 7 = 6 : y | b. 5 : 3 = 6 : a : b | c. 6 km : 3 m = 2 m : 4 km | d. 6 : k = 18 : 12 |
| e. 4 : 0 = 8 : z | f. 9 = p | g. 4 : 7 : 10 = d : e : f | h. y : 10 : 15 = x : 30 : z |
- In the following solved proportions, which person properly executed step 2 of the proportion steps?
| 6 : 5 : 4 : 3 = x : y : z : 9 | ||
| Person A: 6 : 5 = x : y | Person B: 4 : 3 = y : 9 |
|
Solutions:
- a. OK
- Not the same number of terms on each side (Characteristic #3)
- Terms are not in same units; terms are not in the same order (Characteristics #1 and #2)
- OK
- Does not meet ratio criteria; there is a term of zero (Characteristic #1)
- Does not meet ratio criteria; must have at least two terms on each side (Characteristic #1)
- There is no corresponding known term on both sides; every pair of terms contains an unknown (Rule #2)
- The first corresponding term is not known on both sides; at least one needs to be known (Rule #1)
- Person C did it right. Person A failed to isolate a variable, and different terms were extracted by Person B (3rd term : 4th term ≠ 2nd term : 4th term).
Example 2.3 C: Estimating Competitor Profits
|
A recent article reported that companies in a certain industry were averaging an operating profit of $23,000 per 10 full-time employees. A marketing manager wants to estimate the operating profitability for one of her company's competitors, which employs 87 full-time workers. What is the estimated operating profit for that competitor?
|
|
|
There is a relationship between the number of full-time employees and the operating profit. This is a ratio. If you set up a similar ratio for the competitor, you create a proportion that you can solve for the competitor's estimated operating profit, or p.
|
|
|
What You Already Know You know the industry and competitor information: Industry operating profit = $23,000 Industry full-time employees = 10 Competitor operating profit = p Competitor full-time employees = 87
|
How You Will Get There Step 1: Set up the proportion. Step 2: Express in fractional format. Step 3: Isolate the unknown variable, p. Step 4: Since there is only one unknown, this step is not needed.
|
|
Step 1: industry profit : industry employees = competitor profit : competitor employees 23,000 : 10 = p : 87 Step 2: Step 3: p = $200,100
|
|
|
If the industry is averaging $23,000 in operating profits per 10 full-time employees, then the competitor with 87 full-time employees has an estimated $200,100 in operating profits.
|
|


What Is Prorating?
Ratios and proportions are commonly used in various business applications. But there will be numerous situations where your business must allocate limited funds across various divisions, departments, budgets, individuals, and so on. In the opener to this section, one example discussed the splitting of profits with your business partner, where you must distribute profits in proportion to each partner’s total investment. You invested $73,000 while your partner invested $46,000. How much of the total profits of $47,500 should you receive?
The process of prorating is the taking of a total quantity and allocating or distributing it proportionally. In the above example, you must take the total profits of $47,500 and distribute it proportionally with your business partner based on the investment of each partner. The proportion is:
your investment : your partner’s investment = your profit share : your partner’s profit share
This proportion has two major concerns:
- You don’t know either of the terms on the right side. As per the rules of proportions, this makes the proportion unsolvable.
- There is a piece of information from the situation that you didn’t use at all! What happened to the total profits of $47,500?
Every prorating situation involves a hidden term. This hidden term is usually the sum of all the other terms on the same side of the proportion and represents a total. In our case, it is the $47,500 of total profits. This quantity must be placed as an extra term on both sides of the proportion to create a proportion that can actually be solved.
How It Works
Prorating represents a complex proportion. As such, the steps involved in prorating are similar to the steps for solving any proportion:
Step 1: Set up the proportion with the known ratio on the left side. Place the ratio with any unknown variables on the right side.
Step 2: Insert the hidden term on both sides of the proportion. Usually this term represents the total of all other terms on the same side of the proportion.
Step 3: Working with only two terms at a time, express the two terms in fractional format. Ensure that only one unknown variable appears in the resulting proportion.
Step 4: Solve for the unknown variable. Ensure that the rules of BEDMAS are obeyed and proper algebraic manipulation is performed.
Step 5: If the prorating contains more than one unknown variable, go back to step 3 and select a pairing that isolates another one of the unknown variables.
To solve your profit-splitting scenario, let y represent your profit share and p represent your partner’s share:
Step 1: your investment : your partner’s investment = your profit share : your partner’s profit share
$73,000 : $46,000 = y : p
Step 2: Insert the hidden total term on both sides:
| your investment | : | your partner’s investment | : | total investment | = | your profit share | : | your partner’s profit share | : | total profits |
$73,000 : $46,000 : $119,000 = y : p : $47,500
Step 3: Set up one proportion: 
Step 4: Solve for y. Calculate y = $29,138.66.
Step 5: Set up the other proportion: 
Solve for p. Calculate p = $18,361.34.
Your final proportion is:
$73,000 : $46,000 : $119,000 = $29,138.66 : $18,361.34 : $47,500.00
So you will receive $29,138.66 of the total profits and your partner will receive $18,361.34.
Important Notes
To make prorating situations easier to solve, it is always best to insert the hidden term as the last term on both sides of the equation. This forces the unknown variables into the numerator when you select pairs of terms. It then takes less algebra for you to isolate and solve for the unknown variable.
Things To Watch Out For
Ensure that when you insert the hidden term you put it in the same position on both sides of the proportion. A common error is to put the total on the “outsides” of the proportion:
A : B = C : D when prorated becomes
Total : A : B = C : D : Total
This violates the proportion characteristics, since the terms are not in the same order on both sides. The correct insertion of the hidden total term makes the proportion look like this:
A : B : Total = C : D : Total
Paths To Success
Another way of approaching prorating is to calculate a “per unit” basis and then multiply each term in the proportion by this base. For example, assume you are distributing $100 across three people, who have shares of three, five, and two. This is a total of 10 shares (the hidden term). Therefore, $100 divided by 10 shares is $10 per share. If the first person has three shares, then $10 × 3 = $30. The second and third people get $10 × 5 = $50 and $10 × 2 = $20, respectively. Therefore,
3 : 5 : 2 : 10 = $30 : $50 : $20 : $100.
Example 2.3 E: A Refund on Your Car Insurance Premiums
|
You paid your annual car insurance premium of $1,791 on a Ford Mustang GT. After five complete months, you decide to sell your vehicle and use the money to cover your school expenses. Assuming no fees or other deductions from your insurance agency, how much of your annual insurance premium should you receive as a refund?
|
|
|---|---|
|
You need to figure out how much of your annual insurance premium should be refunded. This will be based on the amount of time that you did not require the insurance. Let's denote this amount as r, the refund.
|
|
|
What You Already Know You have some information on premiums and time frames: Total insurance paid = $1,791 Total months paid for = 12 Months used = 5
|
How You Will Get There Step 1: Set up the proportion. Step 2: Insert the hidden term. Step 3: Pick two terms containing one unknown variable and express in fractional format. Step 4: Isolate the unknown variable. Step 5: Pick another two terms containing the other unknown variable and express in fractional format before isolating the unknown variable.
|
|
Step 1: insurance used : refund = months used : months not used insurance used : r = 5 : months not used Step 2: insurance used : r : $1,791 = 5 : months not used : 12 Two variables remain undefined. We deduce that you did not use your car for 7 months (12 − 5). We do not know the insurance used and assign it the variable u. u : r : $1,791 = 5 : 7 : 12 Step 3: Step 5:
|
|
|
You have used $746.25 of the $1,791 annual insurance premium. With seven months left, you are entitled to a refund of $1,044.75.
|
|

 u = $746.25
Exercises
Mechanics
For questions 1–4, reduce the ratios to their smallest terms.
- a. 66 : 12 b. 48 : 112 : 80 c. 24 : 36 : 84 : 108
- a. 7.2 : 6 b. 0.03 : 0.035 : 0.02 c. 0.27 : 0.18 : 0.51 : 0.15
- a.
 b.
b.  c.
c. 
- a.
 b.
b.  c.
c. 
- Reduce the following ratios to the smallest term of one. Round to two decimals as needed. a. 48 : 53 b. 5
 c.
c. 
- Solve the following proportions for the unknown variable. Round to two decimals as needed. a. 7 : 12 = 109 : y b. 3.23 : 4.07 : 2.12 = x : 55.9625 : 29.15 c.

- Solve the following proportions for all of the unknown variables. a.$12.15 : $38.30 : r = x : $59,184.53 : $26,998.93 b. 16 : 5 : 9 : 30 = g : h : i : $397,767
For questions 8 and 9, prorate the total as indicated by the ratio.
- Ratio = 3 : 2, Total = $11,368.25
- Ratio = 7 : 5 : 3, Total = $46,923.90
Applications
- EB Games sells gaming consoles. Last month, it sold $22,500 worth of Nintendo Wii consoles, $31,500 worth of Microsoft Xbox consoles, and $18,000 worth of Sony PlayStation consoles. Express the ratio of Wii to Xbox to PlayStation sales in its lowest terms.
- The manufacturing cost of a deluxe candle is made up of $2.40 in paraffin, $1.20 in dye, $1.60 in overhead, and $4.40 in direct labour. Express the ratio between these costs respectively in their lowest terms.
- If one Canadian dollar buys $1.0385 of US dollars, how much US money can you spend so that you do not exceed the maximum duty-free amount of $800 Canadian on your next US vacation?
- For every $100 of retail spending, the average Canadian spends approximately $19.12 at motor vehicle dealerships and $18.35 at grocery stores. If the average Canadian spends $49,766 per year on retail spending, how much more does a Canadian spend annually at motor vehicle dealerships than at grocery stores?
- Marina has a three-sevenths interest in a partnership. If she sells one-quarter of her interest for $8,250, what is the implied value of the partnership?
- You are making a punch for an upcoming party. The recipe calls for 2½ parts ginger ale to ⅘ parts grenadine to 1⅜ parts vodka. If your punch bowl can hold 8.5 litres, how much (in litres) of each ingredient is needed? Round the answers to two decimals as needed.
Challenge, Critical Thinking, & Other Applications
- A manufacturing facility requires one member of the board of directors for every 10 executives. There are five managers for every executive and eight workers for every manager. The average salary paid to directors is $105,000 along with $80,000 to executives, $55,000 to managers, and $30,000 to workers. If the facility has 1,383 employees, what is the total labour cost?
- It is common for strip mall owners to allocate to their tenants general overhead costs such as snow clearing, security, and parking lot maintenance in one of two ways. The first method involves allocating these costs on the basis of the square metres each tenant operates. The second method involves allocating these costs on the basis of the number of annual transactions made by each tenant. At Charleswood Square, there are three tenants. The 7-Eleven takes up 150 square metres, Tim Hortons takes up 235 square metres, and Quiznos takes up 110 square metres. Last year, 7-Eleven had 350,400 transactions, Tim Hortons had 657,000 transactions, and Quiznos had 197,100 transactions. Total overhead costs for Charleswood Square last year were $25,980. Determine which method of allocation each tenant would prefer and how much of a savings in percentage its preferred method would represent relative to the other allocation method.
- The average annual Canadian cellphone plan covers 780 minutes of voice time, 600 text messages, and 8 video messages with a total annual cost of $500.63. However, some Canadians are high-usage consumers and average 439 minutes per month.
- Assuming the same proportion of usage and that each component shares the cost equally on a per-unit basis, how many text messages and video messages do these high-usage Canadian consumers average per year? How much should they pay annually for their cellphone usage?
- A similar typical cellphone plan in the Netherlands has a total annual cost of $131.44. How much would a high-usage plan cost annually in the Netherlands?
- Procter & Gamble (P&G) is analyzing its Canadian sales by region: 23% of sales were on the West coast; 18% were in the Prairies, 45% were in central Canada, and 14% were in Atlantic Canada. Express and reduce the ratio of P&G’s respective sales to the smallest term of one. Round to two decimals.
- A company has 14 managers, 63 supervisors, and 281 workers. After a record profit year, the company wants to distribute an end-of-year bonus to all employees. Each worker is to get one share, each supervisor gets twice as many shares as workers, and each manager gets twice as many shares as supervisors. If the bonus to be distributed totals $1,275,000, how much does each manager, supervisor, and worker receive?
The Language of Business Mathematics
average A single number that represents the middle of a data set.
geometric average A typical value for a set of numbers that are meant to be multiplied together or are exponential in nature. This may take the form of a series of percent changes.
hidden term In prorating, this is the sum of all the other terms on the same side of the proportion and represents a total.
percent change An expression in percent form of how much any quantity changes from a starting period to an ending period.
proportion A statement of equality between two ratios.
prorating The process of taking a total quantity and allocating or distributing it proportionally.
rate of change over time A measure of the percent change in a variable per time period.
ratio A fixed relationship between two or more quantities, amounts, or sizes of a similar nature where all terms are nonzero.
simple average An average where each piece of data shares the same level of importance and frequency but does not represent percent changes or numbers that are intended to be multiplied with each other.
terms of the ratio The numbers appearing in a ratio.
weighted average An average where not all pieces of data share the same level of importance or they do not occur with the same frequency; the data cannot represent percent changes or numbers that are intended to be multiplied with each other.
The Formulas You Need to Know
Symbols Used
∆% = percent change
∑ = summation symbol, which means you add everything up
GAvg = geometric average
n = a count of something, whether a total number of periods or a total quantity
New = the value that a quantity has become; the number that is being compared
Old = the value that a quantity used to be; the number to compare to
RoC = rate of change per time period
SAvg = simple average
x = any individual piece of data
w = weighting factor
WAvg = weighted average
Chapter 2: General Business Management Applications (Answers to textbook questions)
-
2.1 Percent Change
- 5.0023%
- $549.25
- 5.346%
- 5.0005%
- $17.99
- $2,500
- 7.1773%
- $218.34
- 16.2624%
- Δ% = −26.2937%; RoC = −3.0048%
- a. −2.7248%, b. $246,308.72, c. 10.4833%
- −28.5714%
- a. 10%, b. −9.5801%, c. −0.5381%
- 5.1452%
- 15 years
- 2.5148%
- Amount saved = $193.18; Δ%=−70.0004%
- −0.6155%
- 61.9048% less time.
- a. 8. 3̅%, b. 4.083̅% per period.
-
2.2 Averages
- 15
- $1,779
- 10
- $3,795
- 6.7910%
- 2.6888%
- $0.00802/ml
- $6.46
- 5.0821%
- $15.88
- $314.83
- 2.74
- $125,000
- 1.8666%
- $0.8082
- 99.0805%
- a.Pert better; Pert=$0.005916̅/ml; H&S=$0.006680/ml, b. Pert saves $1.74
- Grocery 11.2853%; Cosmetics 9.4493%; Pharmaceuticals 8.9208%
- $213.64
- 10.2809%
-
2.3 Ratios, Proportions and Prorating
- a. 11:2; 1b. 6:13:10; 1c. 2:3:7:9
- a. 6:5; 2b. 6:7:4
- a. 35:4; 3b. 5:6:7; c. 17:9:27:8
- a. 24:5; 4b. 5:2:12; 4c. 12:28:21:15
- a. 1:1.10; 5b. 2.14:1:1.12; 5c. 1:16.64:8.33:3.12
- a. y=1.87; b. x=44.55; c. q=0.92
- a. r=$17.47; x=$18,775.25; b. g=212,142.40; h = $66,294.50; i=$119,330.10
- $6,820.95:$4,547.30
- $21,897.82:$15,641.30:$9,384.78
- 5:7:4
- 6:3:4:11
- m=$778.88
- $383.20
- $44,916.67
- Gingerale = 4.08L, Grenadine =2.176L; Vodka = 2.244L
- $46,965,000
- 7-11: transactions, 4% savings; Tim Horton’s: square metres, 12.963% savings; Quizno’s: transactions, 26.3636% savings
- a. Texts = 4,052; Video = 54, Cost =$3,381.18; 18b. $887.73.
- 1.64 : 1.29 : 3.21 : 1
- Manager = $11,015.12; Supervisor = $5,507.56; Worker = $2,753.78
