8 School-to-Work Transitions

Learning Objectives
After reading this chapter, you will be able to
- Define knowledge economy and how it is related to educational attainment in Canada.
- Explain what is meant by opportunity cost and human capital with regard to pursuing education.
- Identify how “gappers” and “second chancers” experience the transition from school to work.
- Explain what is meant by the “forgotten half.”
- Identify the strategies used by youth when trying to find a job after completing education.
- Describe how the transition to work varies by credentials and field of study.
- Define job–education mismatch and explain what is meant by vertical and horizontal mismatch.
- Summarize how experiential learning assists with school-to-work transitions.
- Describe the major stages in the transition to adulthood and how these have changed in recent generations in Canada.
- Describe the main differences in school-to-work transitions and explain how transition to adulthood varies between country typologies.
Introduction
In previous chapters, the function of school as a socializing agent has been discussed. School also gives students skills and knowledge that they need to be successful citizens and provides the groundwork for any additional education or training that they may desire. The purpose of education is not only to socialize students and make them into knowledgeable and productive citizens, but also to prepare them for the labour market. In the past, a high school education has been the gateway to many desirable jobs, but this is less true in today’s economy. Vocational training, college, and university pathways are increasingly being chosen by youths after high school graduation due to the shifting demands of today’s job markets.
Education and the Canadian Work Force
A major reason why people pursue post-secondary education is so that they will attain marketable skills that will result in increased employment opportunities. The numbers of Canadians with post-secondary education have been increasing, as discussed in the previous chapter. For example, according to the Canadian census, about 13 percent of Canadians had university degrees in 1981, which more than doubled to around 28 percent in 2006. Similar increases in other forms of post-secondary education have occurred as well.
There are several reasons for the increase in post-secondary credentials. Since the 1950s, there has been an expansion of “white-collar” positions that target educated semi-professionals in administrative or office positions, for example (Owram 1996). The rise in white-collar positions coincided with a decrease in “blue-collar” work, which is characterized by manual labour in the service sector. The middle-class population began to view post-secondary education as a necessary stage for personal economic success. Recently, discussions about the knowledge economy have become commonplace in education policy and research. The knowledge economy refers to a continuously adapting society characterized by a large proportion of jobs based upon the skills of highly educated and technically proficient employees. Many Western governments use the term to talk about education, life-long learning, and employment and skills training programs (Gibb and Walker 2011). A key feature of such economies is that the workers must be able to continuously adapt to and learn new technologies. Workers in the knowledge economy are in the situation of having to update their skills in order to keep up with the changing demands of their jobs. Gibb and Walker (2011) point out that although many governments, including Canada’s, discuss Canada as being a knowledge economy, “knowledge workers” actually make up only a relatively small proportion of jobs in Canada.
The Cost of Education
Post-secondary education is costly in that it requires not only government expenditure, but also personal investments. In terms of government expenditure, in 2006 Canada devoted 6.1 percent of the GDP (gross domestic product) to educational institutions, and 2.6 percent of this to post-secondary institutions. Among the OECD countries,1 Canada and the USA allocate the largest share of education spending on post-secondary (Canadian Education Statistics Council 2010).
Source: Adapted from various province-specific links on www40.statcan.ca/l01/cst01/educ50a-eng.htm
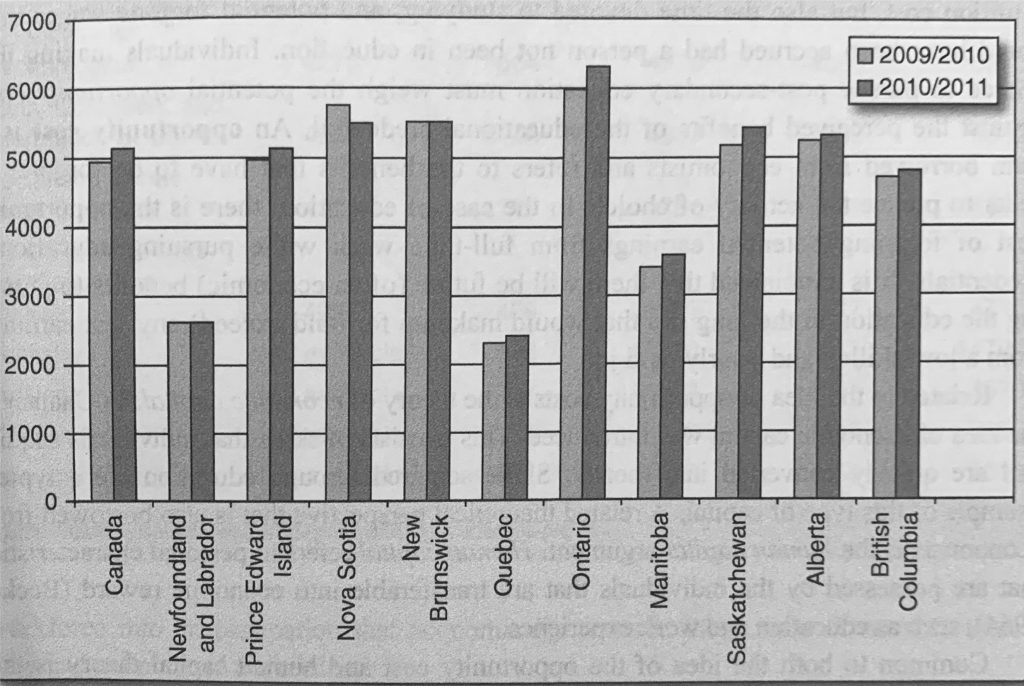
Most students must pay tuition fees in order to attend a post-secondary institution. The tuition fees of post-secondary institutions have been steadily rising over the years. In terms of tuition, the national average university tuition was around $5100 a year in 2010/2011, although this varies considerably by program of study and region. In the same year, tuition fees at Ontario universities were the highest at $6307, followed by fees in New Brunswick, which were just over $5500. The lowest tuition fees in Canada were found in Quebec and Newfoundland and Labrador, which had average fees of around $2500. Figure 8.1 shows the changes in average full-time university tuition fees at the undergraduate level by province from 2009–2010 to 2010–2011. Nearly all provinces experienced an increase except for Newfoundland and Labrador and New Brunswick. Nova Scotia, in contrast, experienced an average decrease of around 4.5 percent. Unlike the situation in the United States, education is heavily funded by the territorial and provincial governments; tuition fees obtained from students account for around 20 percent of the total costs of education, while federal funding accounts for under 10 percent.
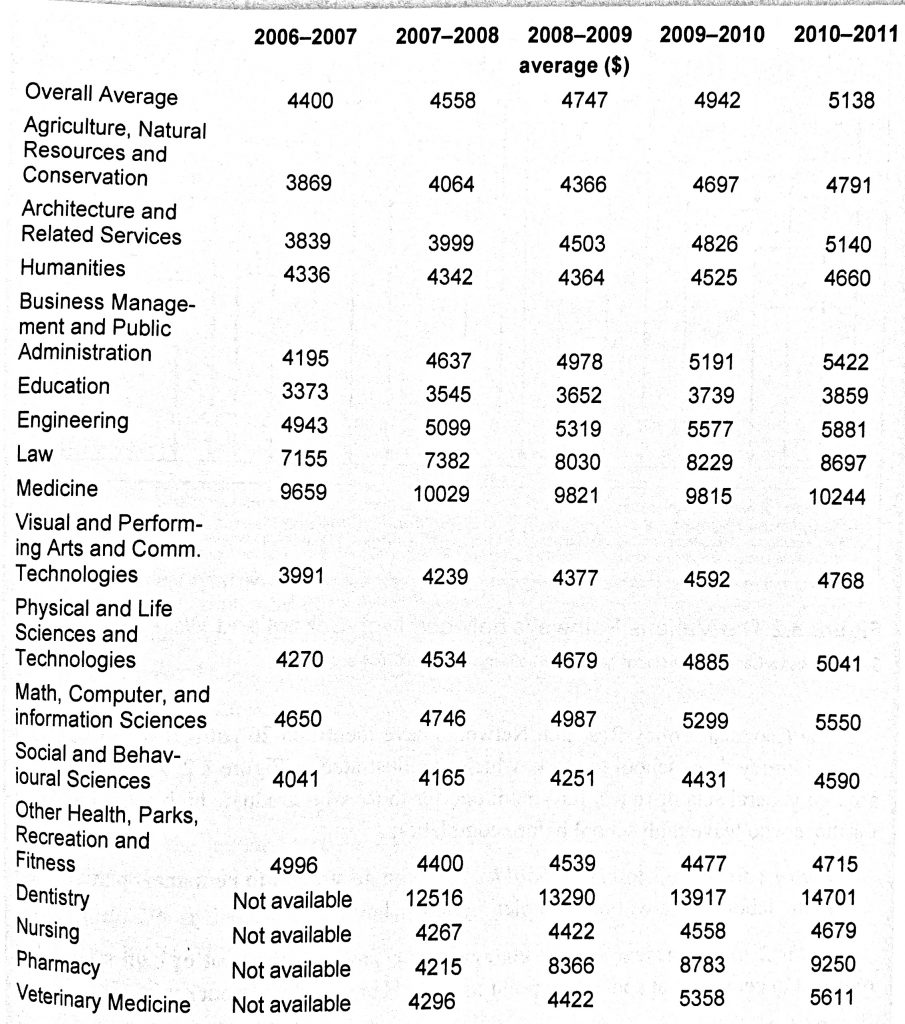
Table 8.1 shows that tuition has been steadily rising over the years and that there are stark differences in tuition rates based on program of study. For example, in 2010–2011, one year of dentistry tuition was $14 701, compared to $3859 for tuition in education fields. In fact, dentistry students pay the highest tuition across Canada, followed by students in medicine and pharmacy at the undergraduate level. At the post-graduate level, however, the most expensive programs in Canada are the master of business (MBA) programs. The “executive” MBA had an average tuition of nearly $29 000 in 2010–2011, while the regular MBA had an average tuition of just over $21 000.2 In contrast, graduate tuitions for most other disciplines such as agriculture, education, engineering, nursing, pharmacy, and the social sciences are around $4500 to $5500 per year. The average student finances his or her education through a combination of means, including employment, government loans, savings, family support, private loans, and grants (Berger, Motte and Parkin 2007).
In terms of personal costs, the pursuit of post-secondary education requires not only a tuition cost, but also the time devoted to studying, and potential forgone wages that could have been accrued had a person not been in education. Individuals making the choice to pursue post-secondary education must weigh the potential opportunity cost against the perceived benefits of the educational credential. An opportunity cost is a term borrowed from economists and refers to the benefits that have to be forgone in order to pursue the activity of choice. In the case of education, there is the opportunity cost of forgoing potential earnings from full-time work while pursuing educational credentials. It is anticipated that there will be future (often economic) benefits to pursuing the education in the long run that would make up for (and exceed) any lost earnings from a low-skilled and poorly paid job.
Related to the idea of opportunity costs is the theory of economic capital. In Chapter 2, the idea of economic capital was introduced. This consists of skills that individuals acquire that are quickly converted into money. Skills acquired through education are a typical example of this type of capital. A related theoretical perspective that is also borrowed from economists is the human capital argument. Human capital refers to personal characteristics that are possessed by the individuals that are transferable into economic reward (Becker 1964), such as education and work experience.
Common to both the idea of the opportunity cost and human capital theory is that individuals make a rational choice when they enter education and training. The choices they make are linked to future perceived economic benefits. Students are students because they hope that upon completion of their degrees, diplomas, or certificates they will enter the workforce into an occupation that economically rewards them more favourably than if they had not pursued the credential.
Source: Statistics Canada, www40.statcan.ca/l01/cst01/educ50a-eng.htm
Source: Statistics Canada, www.statcan.gc.ca/pub/81-595-m/81-595-m2007054-eng.pdf
There are many possible school-to-work pathways that a youth may follow. It may seem that the most promoted route is high school post-secondary studies job, but there are many young adults who have deviated from this set of stages.
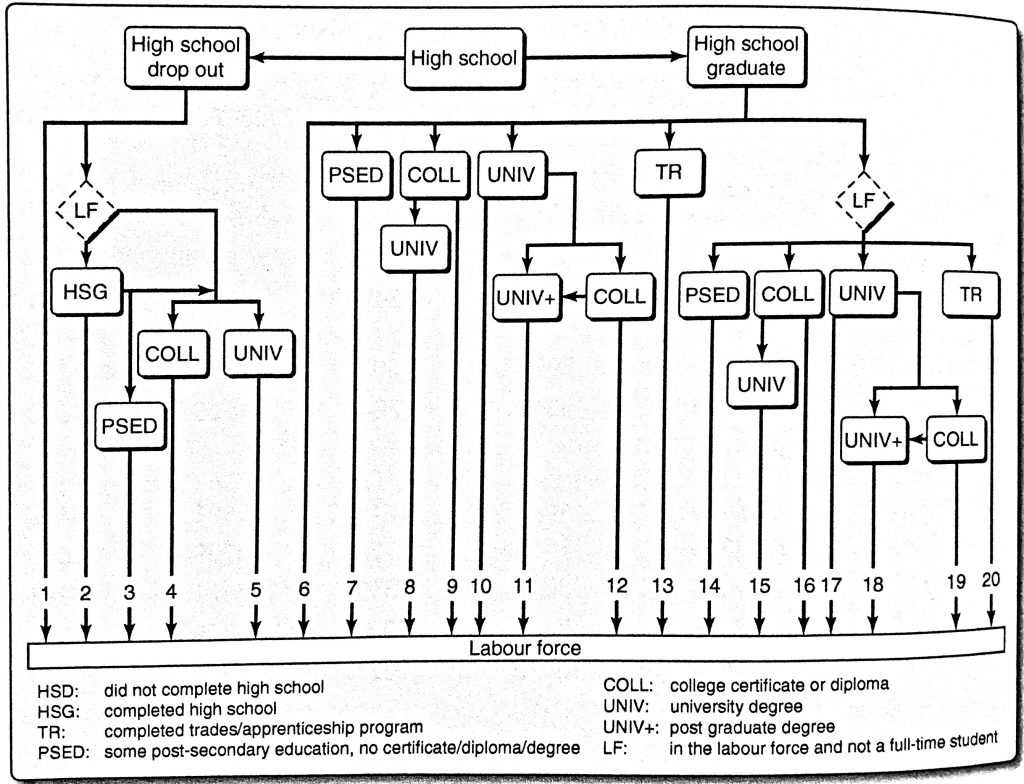
The Canadian Policy Research Networks have identified 20 paths that can be taken on the journey from school to work, which are illustrated in Figure 8.2. As shown, there are two general sets of routes for youth: one for those who graduate high school and one for those who leave high school before completion.
- Path 1 corresponds to high school leavers who go straight to permanent participation in the labour force without completing high school.
Paths 2 to 5 represent second chancers who have dropped out of high school, but returned to education at some later point in time (Hango and de Broucker 2007).
- Path 2 members have spent some time in the labour force, followed by high school graduation, then a return to the labour force.
- Path 3 members enter the labour force, finish high school, then pursue some education (without completing the credential), before returning to the labour force.
- In Paths 4 and 5, dropouts spend time in the labour force and then return to high school, and proceed to university or college, or they enter college or university directly from the labour force. Those without high school diplomas can enter post-secondary institutions as mature students. Mature students are generally age 21 or older and are assessed for admission in a different manner than regular applicants, with work experience and academic potential taken into account.
In the remaining paths, youth have graduated high school. There are two general points of departure after graduating high school: (1) immediate transition to additional education and (2) entering the labour force.
- In Path 6, high school graduates transition immediately to the labour market and remain there.
- In Paths 7 to 10, the high school graduate moves into education of some sort, which eventually leads to the labour market. In Path 8, the high school graduate enters college and then transfers to a university program. Paths 11 and 12 involve starting with university immediately after high school, then getting a post-graduate degree (Path 11) or getting a college diploma after completing university (Path 12).
- Path 13 involves going straight from high school into a trades program and then entering the labour market.
Paths 14 to 20 are characterized by a group of gappers who complete high school, and then enter the labour force for some time before continuing with their education.
- Path 14 is characterized by going from high school to the labour force, and then returning for some studies (which do not lead to certificate/diploma or degree), and then returning to the labour market.
- Paths 15 and 16 involve going from high school to the labour force, then to college, but in Path 15, the student moves from college to university and then into the labour force again.
- In Paths 17 to 19, the initial time after high school is spent in the labour force and is followed by attending university. In Path 17, university is completed, followed by a return to the labour force. In Path 18, university is followed by a post-graduate degree, and in Path 19 university is followed by a college designation.
- In Path 20, an individual goes into a trades program after an initial stint in the labour force, returning to the labour force upon completion of the apprenticeship or program.
Given so many possible paths, it is natural to be curious about which ones are most often selected by Canadian youth. Detailed information about the life courses of youth over many years into adulthood would be necessary to answer such a question. While the vertical lines in Figure 8.1 are drawn as uniform, the actual time that each person takes to get from the top of the figure to the bottom (entering the labour force) can vary between an immediate transition (dropping out and entering the labour market permanently, as in Path 1), or literally take decades if an individual pursues Path 18 or 19. It is also important to recognize that although post-secondary education is stressed in secondary schools (and in society in general), around half of Canadian youth do not desire post-secondary education or do not finish programs that they begin. This half of the population that is rarely discussed has been dubbed the forgotten half. See Box 8.1 for a discussion of the forgotten half.
Box 8.1 – The Forgotten Half
Education researchers and policy-makers have argued that educational attainment in Canada is highly polarized. By this, they mean that there is an emphasis by secondary teachers to plan for academic education while failing to give equal consideration to other options. As argued by Schuetze (2003):
While there is a clearly defined and demarcated path to university and academic programs in colleges for students who are academically gifted and inclined, there is no equivalent pathway in Canada for those who are not interested in continuing formal academic education after compulsory schooling. This group is arguably, like that in the United States . . . “the forgotten half,” since almost half the youth cohort, who are either not college-bound or leave college without any formal qualification, are suffering from a lack of clear sign-posts and opportunities for a solid preparation for employment and working life. (p. 66)
This failure to give information about other options has the effect of having youth enrolling in high school courses that are not appropriate to their interests or skills, and can lead to youth getting poor grades and dropping out of school in frustration (Ontario Association of Youth Employment Centres 2005).
The Ontario Association of Youth Employment Centres (2005) has argued that there is a stigma against “non-academic” pathways in education, which results in a lack of information being provided to students about options that do not involve college or university. They suggest that Canadian schools need to be “re-cultured” so that college and university are not stressed as the “preferred” pathway and that the benchmark of the success of a school is not the proportion of students that are enrolled in university preparation courses. They argue that the emphasis must be placed on encouraging students in what they do well, not what teachers think they should do.
While some provinces have tried to integrate apprenticeship programs into their schools by linking students with employers, these programs are marginal. In Chapters 2 and 6, recent attempts to combine the vocational and academic trajectories together in high school were discussed. Students, however, expressed that, based upon the feedback they received from teachers, academic trajectories were preferred and that vocational paths were not desirable (Taylor 2010).
Alberta is unique in that it has been the most consistent in linking schools and industry through its youth apprenticeship program. This is likely due to Alberta’s generally industry-friendly policy environment (Taylor 2010), but also because there has traditionally been higher than average participation in apprenticeship training in this part of the country. As such, building such programs around existing infrastructure is a more straightforward process than completely inventing it (Lehmann 2005).
Lehmann (2005) found that Canadians in high school apprentice positions, however, appear to get considerably less training and have less knowledge about their trades than their counterparts in Germany, where the apprenticeship system is highly developed.
Source: Statistics Canada, www.statcan.gc.ca/pub/81-595-m/81-595-m2007054-eng.pdf
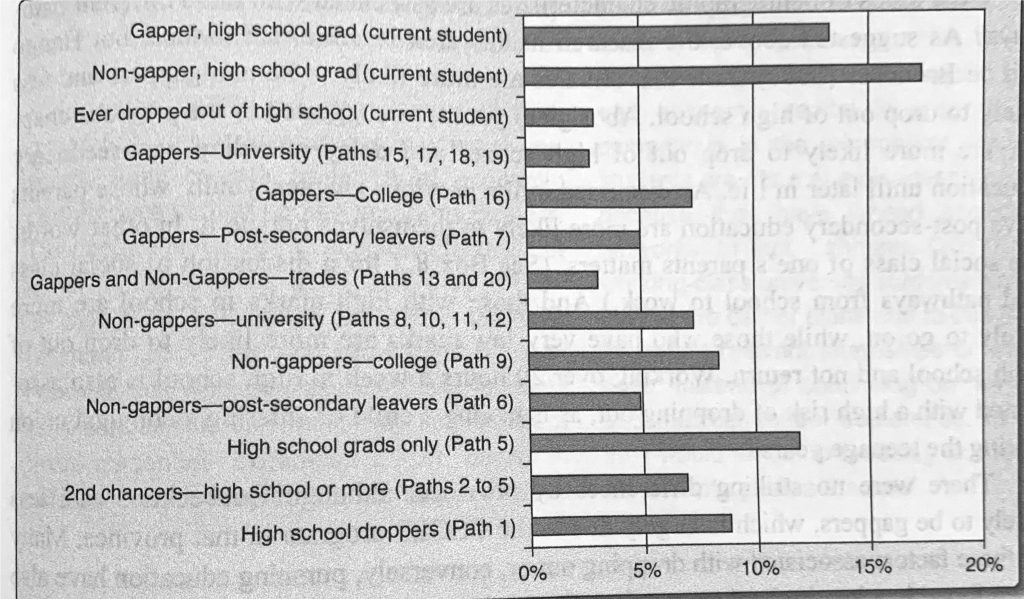
Of current students, 3 percent had dropped out of school at some point in the past and 7 percent of the sample were second-chancers, returning to school to earn their high school diplomas. The most popular pathway for those who were not currently students at the time of the study was to get a college diploma. This represented just over 8 percent of the sample. The pathway with the lowest uptake was gappers with a university degree. Also, about 10 percent of the cohort (gappers and non-gappers) had started, but left, a post-secondary education program.Hango and de Broucker (2007) have begun to look at the different school-to-work routes in recent generations of Canadian youth. Figure 8.3 summarizes findings of an analysis of the Youth in Transition Survey, a longitudinal study of Canadian youth in which the same group of people have been studied since 2000, and who were 22 to 24 years of age in 2003. Figure 8.3 reveals that the most frequent path at this point for almost 12 percent of this group was having only a high school diploma. However, this does not mean that students in Canada are most likely to stop their education at the high school level. Looking at Figure 8.3, it is important to recall that post-secondary schooling levels are divided into their own separate categories, which are further divided into gappers and non-gappers. And because the sample is relatively young, many members were still in education (about 33 percent of the sample) at the time that the data were collected. Also, as the pathways described earlier suggest, many who are not in school now will return for additional credentials later in life.
What kinds of demographic characteristics are associated with these different pathways? As suggested above, the research in this area is somewhat limited, but Hango and de Broucker (2007) show that females are more likely to be non-gappers and less likely to drop out of high school. Aboriginal youth, as suggested in the previous chapter, are more likely to drop out of high school and delay attending post-secondary education until later in life. As discussed in the previous chapter, youth whose parents have post-secondary education are more likely to themselves pursue it. In other words, the social class of one’s parents matters. (See Box 8.2 for a discussion of social class and pathways from school to work.) And those with high marks in school are more likely to go on, while those who have very low marks are more likely to drop out of high school and not return. Working over 20 hours a week in high school is also associated with a high risk of dropping out, as is having a child or entering a conjugal union during the teenage years.
There were no striking differences by province, although Quebeckers were less likely to be gappers, which is largely due to the CEGEP program in that province. Many of these factors associated with dropping out or, conversely, pursuing education have also been found in a longitudinal study of youth in Alberta (Krahn and Hudson 2006).
Box 8.2 – First Generation University Students: Class Matters
In Chapter 7, the relationship between social class and educational attainment and outcomes was discussed. Canadian research has repeatedly shown the socioeconomic status of a youth’s family to be one of the strongest indicators of a child’s educational outcomes, which are, of course, strongly tied to occupational outcomes (Gorard, Fitz, and Taylor 2001; Ma and Klinger 2000).
Canadian sociologist Wolfgang Lehmann has explored the issue of social class and school-to-work transitions extensively using qualitative interview techniques. He begins one research article with the following two quotations (Lehmann 2004:379):
I think if I did have a parent who went to university it’d be a lot more comfortable, because they’d know what you need to do. (Nadine, Edmonton high school student)
[M]y mom and dad both teach. . . . And my mom . . . by the time she retires, I’ll be pretty much into that field. I’d love to take over her class, maybe team-teach with her for a couple of years. . . . We were talking about that, my mom and I, and we thought that would be so neat. (Lisa, Edmonton high school student)
These quotations begin to illustrate what Lehmann (2004) goes on to describe as the class-specific orientations of youth and the habitus (see Chapter 2) with which they make decisions about education and the types of work they see themselves doing in the future. Lehmann (2004) illustrates that there is much social-class-specific thinking about what young people see themselves doing, which is largely contingent on the type of work their parents did. When youth are encouraged to transcend class and achieve higher than what their parents did, they are often uncertain and feel socially and culturally unprepared, as illustrated in the first quotation above. Decisions to free themselves of the manual labour experienced by their parents through university seem to be both liberating and burdensome at the same time.
Lehmann (2007) has also found that “first generation” university students may leave university early despite having solid academic performance in their degree programs thus far. They do not leave due to academic failure, but rather because they don’t feel they “fit in” or that they can relate to other students. Lehmann (2011) has also found that the social networks that working-class university students have can also severely limit their acquisition of “extra-credential experiences.” In order to differentiate themselves from others, university students have found that acquiring career-related work experience is a necessary investment that they must make in their social and economic capital in order to be more competitive in the job market. Working-class students are often at a disadvantage, however, because they have limited access to such networks. In fact, Lehmann (2011) found that working-class university students would rethink their entire career plans due to this lack of ability to find relevant internships or work experience. Instead of continuing on law, dentistry, and medical school trajectories, for example, they would switch to teaching or continue their studies into graduate school.
Transitioning into the Labour Market
Upon completion of education, most young adults transition into the labour market, seeking part-time or full-time employment. Unemployment rates among young adults, however, are much higher than in the average adult workforce—often double or even higher. Young adults may face difficulty finding a suitable job or even a job at all. The rate of unemployment among young people varies considerably according to level of education completed, however. Bayard and Greenlee (2009) demonstrated (Figure 8.4) that the unemployment rates of young adults who hold bachelor’s degrees is lower than the rates of those who have post-secondary diplomas or certificates. Individuals whose highest level of completed education is high school face the highest unemployment rates. These differences by educational attainment have remained rather steady over the years, even in times of economic downturn, such as the early 1990s and the period starting in late 2008.
There are many strategies that young adults use to find a job. The National Graduates Survey of 1995 revealed the many challenges that young adults faced when trying to find employment related to their education, indicating that finding a job with acceptable pay was a major difficulty (28 percent) followed by finding a job that was related to their education (25 percent) (Clark 1999). Nearly one-third of graduates found their job through “networking” through their contacts with family and friends, while a smaller number got jobs through former employers and by making “cold calls” to prospective employers. Individuals who had experience, such as through volunteer work or through co-operative education placements, had an easier time finding career-related work. These findings suggest that social capital (Chapter 2) was an important factor in finding a job.
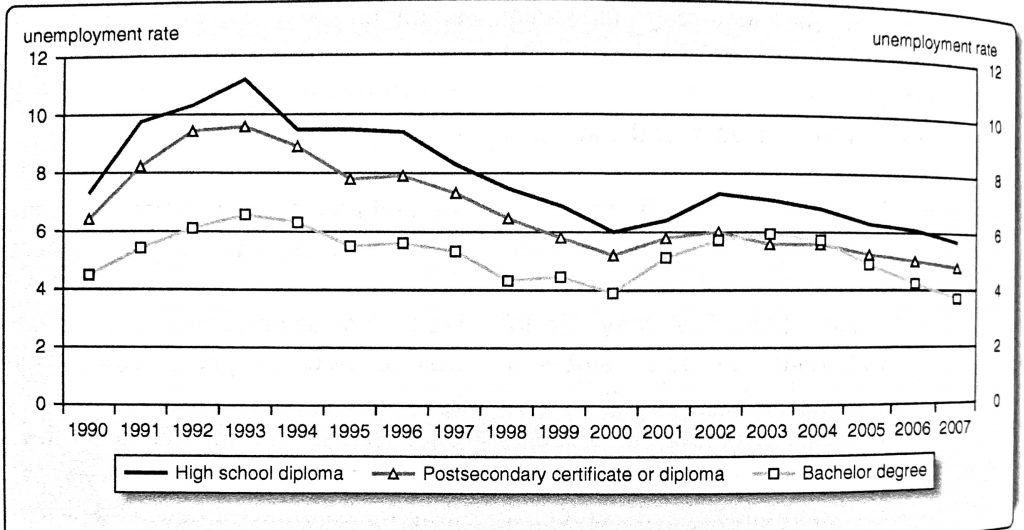
Source: Bayard, J., and Greenlee, E. (2009). Graduating in Canada: Profile, labour market outcomes and student debt of the class of 2005. Statistics Canada, Catalogue no. 81-595-M, no. 074, p. 16
Outcomes, however, vary a lot by many of the factors discussed in the previous chapter. Region is one example of how school-to-work transitions vary across Canada. Analyzing the Youth in Transition Survey, researchers found that the number of university graduates varied significantly by province (Shaienks and Gluszunski 2009). For example, Alberta and Quebec had the lowest percentage of university graduates, while Ontario and Atlantic Canada had the highest. The researchers explain that this may be related to the economic conditions of the area where the individuals were living when they were making education choices. For instance, in recent years there have been many jobs relating to oil-patch work in Alberta.
Field of Study
What people study in their educational pursuits is also linked to their employment rates and earnings after they graduate. There are fields of study in which graduates are more likely to be employed. There are no definite rules about what areas and levels of study more directly lead to jobs, but there is some indication from the 2007 National Graduate Survey (a Canadian study of graduates from 2005, two years after graduation) that graduates in engineering and architecture have relatively high levels of full-time employment directly out of school, whether they obtained the qualification from college or university (Bayard and Greenlee 2009). However in some fields, employment favours those with university over college degrees. Nursing is an example of this distinction, where 86 percent of nurses with a bachelor’s degree are employed full-time compared to just 72 percent of nurses with a college credential.
Other findings reveal that college graduates in education have the lowest level of full-time employment, and that this has dropped markedly in recent years. In 2002, 75 percent of college graduates in education found full-time work; in 2007, this number dropped sharply to just 61 percent. Bachelor’s degree holders in education fared better, with full-time employment rates of 77 percent. In general, employment rates for university degree holders are higher than for the college graduates in the same fields of study.
Post-Graduate Education
Just as more young adults of recent generations are pursuing post-secondary education, so too are more graduates pursuing additional degrees and diplomas. Instead of going directly into the workforce, around one-third of graduates go on to further education (Bayard and Greenlee 2009) and this figure has increased gradually over recent years. Many graduates from undergraduate degrees go on to master’s degrees, which are typically one- or two-year programs. Graduates of master’s degrees may also continue on to doctoral studies, which can take an additional four to seven years of study. Occasionally, doctoral graduates pursue an additional doctoral degree, although this is relatively rare. The largest proportion of those pursuing additional education are graduates of university programs, followed by graduates of master’s degree programs.
The proportion of graduates who pursued further education varies by field of study. College graduates in the humanities were found to be the most likely to pursue additional education, while at the bachelor and master’s levels, natural sciences and technologies graduates were most likely to continue. College graduates in health sciences as well as education degree holders at the undergraduate and master levels were the least likely to pursue additional qualifications.
In terms of employment prospects after pursuing additional qualifications, the highest proportions of graduates working were those who had recently completed a master’s program. In fact, the percentage of master’s degree holders who were in employment (about 97 percent) was higher than for college, bachelor, or doctoral graduates. Of particular note is that the employment gap between males and females at the master’s level has almost disappeared (Bayard and Greenlee 2009).
Earnings after Graduation
One reason that young people pursue post-secondary education is because most jobs that require no additional education are low-skilled and low-paying. Across Canada, the average (median) annual earnings of graduates from 2005 who were working in 2007 were $35 000 for college graduates, $45 000 for bachelor’s graduates, $60 000 for master’s graduates, and $65 000 for doctoral graduates. Earnings of graduates varied considerably by field of study, however. At the bachelor level, those in the legal professions average $65 000 per year, while those in the visual and performing arts had an annual average income of $33 000. Education graduates at the bachelor level had average earnings at $45 000, while college education graduates earned substantially less at around $32 000 (Bayard and Greenlee 2009).
Differences in earnings also vary by sex. Females tend to study in areas that are associated with lower pay, like social sciences and humanities. Across all levels of education, however, males typically earn more than females.
In general, among college graduates, earnings are the highest for those who graduate from engineering and architecture college degrees and lowest for social and behavioural sciences. For graduates with bachelor degrees, the lowest earnings were associated with visual and performing arts and communications, while the highest earnings were among graduates in parks and recreation, fitness, and health degrees (Bayard and Greenlee 2009).
Job–Education Mismatch
Most post-secondary educational pursuits come with no guarantee of employment at their completion. Ideally, graduates find work in their area of study, but this is not always the case. Job–education mismatch refers to employment situations where the education and training of the employee do not match his or her qualifications. Researchers investigating this phenomenon have often focused on the case of overqualification, or cases where the educational attainment of the employee exceeds that required for the job. When an individual’s skills exceed those needed for the job, his or her education may not be fully used. In such cases, the employee may be overskilled for the particular position.
Researchers have looked at the issue of job–education mismatch in two ways. One is by examining years of education needed for a job relative to years of education possessed by the employee, also known as vertical mismatch. Another way is by looking at field of study and inappropriate matching that may occur at a horizontal level (Robst 2007). Horizontal mismatch refers to a situation in which an employee’s field of study and job do not match.
Job–Education Mismatch in Canada
Boudarbat and Chernoff (2010) estimate that approximately one in three Canadians are in jobs that are not matched to their educational training. In terms of what factors predict having a close education–job fit, being in the health and natural sciences and engineering predicted greater likelihood of having a job–education match. Fields of study that had rather low matches to employment were the humanities and arts. Having good grades also improved the odds of having a job that matched one’s education. Sex and parental class background had no effect on the matching of education to job.
Yeun (2010) found that 23 percent of Canadians indicated that there was no relationship between their education and job, while 19 percent indicated it was somewhat related and 58 percent indicated a close fit. One consequence of having a poor fit with one’s education and job was that it tended to be represented in terms of a wage gap. People with no match between their education and job had much lower wages than those who had a close or somewhat related fit, particularly in the case of university graduates. See Box 8.3 for a discussion of education–job mismatch among Canadian immigrants.
Box 8.3 – Is the Taxi-Driving Doctor a Canadian Myth?
Many newcomers have trouble finding work that allows them to fully use their skills and experience. Their unemployment and underemployment represent more than just a drag on Canada’s productivity. It is a human tragedy, and basic decency dictates that it not be allowed to continue.
—Monte Solberg, Minister of Citizenship and Immigration, 20 March 20063
Much media attention has been given to the difficulty that new immigrants to Canada have obtaining work that is related to their training. The underutilization of their skills has also become an important public policy topic (Wald and Fang 2008). Under the “skilled workers and professional” class of immigration, applicants must have work experience and training in a managerial, professional occupation or technical/skilled trade to be eligible to apply.4 While under the Point System points are awarded for those who have arranged an offer of employment in advance of arriving, there is no requirement for having prearranged employment. Often, immigrants arrive to Canada and find it difficult to find employment that relates to their training. Often this is because they have no “Canadian experience” or because their credentials are simply not recognized here (Reitz 2005).
The 2006 Canadian census reported that recent immigrants are twice as likely as native-born Canadians to have a university degree. Their rates of employment and underemployment, however, are substantially higher (Frenette and Morissette 2003). Underemployment refers to the situation where someone is employed for fewer hours than he or she desires. For example, a person may be working part-time but really desires full-time work.
The failure of immigrants’ credentials to be recognized is demonstrated in the large proportion of immigrants working in jobs with low educational requirement, like driving taxis, working in retail, and driving trucks (Galarneau and Morissette 2008). This underutilization of the skill sets of new immigrants is sometimes referred to as brain waste. Other related terms are brain drain and brain gain. Brain drain refers to the phenomenon of highly educated graduates leaving and emigrating from their countries of origin elsewhere, whereas brain gain refers to an immigrant-receiving country benefiting from the entry of highly educated immigrants. Canadian policy-makers suggest that not recognizing the credentials of new immigrants puts us in a position of “brain waste” while we could be enjoying the benefits of “brain gain.”
A wide variety of studies have in fact confirmed that there is a greater proportion of job–education mismatch among immigrants than among the native-born (Wald and Fang 2008). In addition to potential employers failing to recognize their credentials, immigrant underemployment has also been attributed to their lack of understanding of the Canadian labour market and lack of social capital and networks. If that were true, however, we would expect to see that the longer the immigrants were in Canada, the better their education–job match (see assimilation theory in the previous chapter).
This is, however, not the case. In fact, the education–job mismatch gap between established immigrants and native-born Canadians has increased over time. According to Galarneau and Morissette, in 2006, the percentage of males who had arrived in Canada between 1990 and 1994 with university degrees and were working in low-skill jobs was 21 percent—compared to 11 percent for native-born Canadians. In previous cohorts such as those that arrived between the mid and late 1970s, the rate was 12 percent versus 8 percent for native-born Canadians.
But why is this occurring? Galarneau and Morissette (2008) suggest that these shifts to higher rates of education–job mismatch for immigrants are due to the changing face of immigration. Compared to earlier cohorts, newer cohorts of immigrants are more likely not to speak English or French as a first language, are older on average than previous generations of immigrants, and are more likely to be members of visible minorities. All of these characteristics work against immigrants in terms of the likelihood that their job will match their education. In addition to Asian credentials being viewed with trepidation by prospective employers who are not familiar with the educational quality of such countries (Green and Worswick 2004), work experience in other countries is not always recognized in the Canadian labour market (Aydemir and Skuterud 2005). Older immigrants who have a considerable amount of work experience in their countries of origin, have foreign credentials, and do not speak an official language as a mother tongue may potentially have a host of factors working against them in terms of their appeal to potential employers.
In terms of the outcomes of education–job mismatch, it is not surprising that overqualification has been shown to lead to job dissatisfaction and turnover (Wolbers 2003). Overqualification is also associated with a lower wage-return to education. In other words, people who are overqualified for their jobs often make less money than people of similar education in jobs that are appropriately matched to their level and area of education (Boudarbat and Montmarquette 2009).
A Mismatch between Education and Employer Expectations?
An underlying assumption in the “knowledge economy” is that the more education a person has, the more competitive he or she will be in the labour market. As such, a much greater proportion of individuals have a university degree than in previous generations—in 2010, for example, 31 percent of 25- to 44-year-olds had a university degree compared to 22 percent of 45- to 64-year-olds. While the general perception may exist that a baccalaureate degree is the “new high school diploma,” policy-makers have expressed concern over the need for more graduates from business and engineering (Government of Canada 2001). Others (Canadian Council on Learning 2008a) have argued that the skills acquired in many post-secondary programs, particularly university degrees, bear little resemblance to the types of skills required by employers. It has also been argued that the requirement for applicants to have the minimum of a baccalaureate degree is a current instance of credentialism (see Collins in Chapter 2), wherein the credential itself gives status although it is only loosely linked to the actual skills required to perform the job. Credentialism is the means by which employers stratify access to jobs by requiring certain academic designations prior to entry.
Liberal arts education in particular has received recent attention because of its perceived poor fit with the demands of employers in a knowledge economy (Walters and Frank 2010). Instead of teaching highly specialized skills, it is argued that students in liberal arts programs are not given enough, if any, marketable technical skills. If the goal of education is to prepare future workers for the labour market, liberal arts programs can be viewed as severely deficient in preparing new workers for jobs requiring highly specialized skills. Others argue, however, that liberal arts programs provide students with a different skill set that precisely makes them more adaptable to the changing needs of a knowledge economy (Axelrod, Anisef, and Lin 2001). Strictly training students in technical skills may actually make student skill sets obsolete quicker when technology changes. Liberal arts programs, it is argued, may give students the problem-solving skills they need to adapt to changes in the work environment (Walters 2004). Others, in contrast, argue that it is vocational education that better prepares students for employment and offers the best match of skills to potential employers (Finnie 2001).
Canadian researchers have found that employers desire not only academic and job-specific skills in their employees, but also a set of occupational skills known as soft skills (Canadian Council on Learning 2008a). Soft skills refer to skills in communication, leadership, teamwork, interpersonal skills, and problem solving. Some programs of study allow occupational skills, including soft skills, to be developed through experience in the workplace. In the training of teachers, for example, there are mandatory teacher-education programs that require the student to complete a teacher practicum. The most “hands-on” learning programs are found within the trades, where apprenticeships include some in-class learning but are dominated by on-the-job training.
One way of preparing graduates with occupational skills that cannot be easily taught in the classroom is through experiential learning. Experiential learning is a term given to a set of educational practices that involve work placements that allow the student to obtain a set of skills that can be acquired only through exposure to the work environment. Often such programs of study are referred to as co-operative education.
The Canadian Association for Co-operative Education is a national organization whose mission is to promote co-operative education at the post-secondary level (www.cafce.ca). There are 77 post-secondary institutions in Canada that are members of CAFCE. According to the Association:
Co-operative Education Program means a program which alternates periods of academic study with periods of work experience in appropriate fields of business, industry, government, social services and the professions in accordance with the following criteria: (i) each work situation is developed and/or approved by the co-operative educational institution as a suitable learning situation; (ii) the co-operative student is engaged in productive work rather than merely observing; (iii) the co-operative student receives remuneration for the work performed; (iv) the co-operative student’s progress on the job is monitored by the co-operative educational institution; (v) the co-operative student’s performance on the job is supervised and evaluated by the student’s co-operative employer; (vi) the time spent in periods of work experience must be at least thirty per cent of the time spent in academic study.5
Despite the wide range of co-operative education that is available in Canada, data indicate that only a small percentage of post-secondary students—particularly university students—are enrolled in any form of co-operative education. Of about one million undergraduate students, only about 80 000 are enrolled in this form of experiential learning (Canadian Council on Learning 2008a).
Research on co-operative education has shown that students who participate in it generally rate their experiences as favourable. Data from recent New Brunswick graduates, for example, indicate that co-operative work placements allowed them to develop occupational and job-related skills that they found valuable in future employment (Canadian Council on Learning 2008a). See Box 8.4 for examples of experiential learning opportunities at Canadian post-secondary institutions.
Box 8.4 – Experiential Learning in Canadian Institutions
The University of Waterloo in Ontario not only has the largest co-operative education program in Canada, but is home to the largest post-secondary co-operative program in the world.6 About 14 000 students are enrolled in co-operative education programs that partner with around 3500 employers. Enrolment into the co-operative education program requires students to have 16 months of relevant work experience in order to complete their academic program, which means that the length of the undergraduate program is just under five years. Their program has led the way for the creation of around 100 other co-operative education programs at colleges and universities across the country.
In addition to colleges and universities using co-operative education, “technical universities” have also recently been created that combine the theoretical education of the university with the applied education of colleges. Walters and Zarifa (2008) have shown that co-op programs, particularly at the university level, significantly enhance the earnings and employment prospects of Canadian graduates. One particular program is at the University of Guelph–Humber, which has a combined curriculum of the University of Guelph and the Humber Institute of Technology and Advanced Learning. The four-year programs are in a range of subjects from business, computer, media studies, and childhood studies. Evers and Wolstenholme (2007) explain that
the joint diploma-degree programs match complementary strengths at Humber and Guelph. The programs are specifically designed to compress the time for students to graduate with diplomas and degrees so that the programs can be completed in four years. . . . The programs seamlessly integrate the diploma and degree experience. Students save time and money through tuition and living costs, and employers can hire uniquely skilled graduates sooner. (pp. 83–84)
What is the Value of a Liberal Arts Degree?
Above, the debates around the skills offered by liberal arts degrees were discussed. In general, critics argue that liberal arts degrees do not provide students with the technical skills required by employers in today’s knowledge economy. Proponents, in contrast, argue that liberal arts degrees prepare students in other ways, making them into employees equipped with critical thinking and problem-solving skills who actually may be more flexible in terms of the changing needs of the knowledge economy, and therefore more desirable. Still, others argue that the objective of a liberal arts degree is not to train future workers per se, but to foster the intellectual growth and social awareness of citizens.
Looking at the employment transitions of liberal arts graduates, many studies have demonstrated that students in such programs face the largest earnings disadvantage compared to students in other fields of study (Walters and Frank 2010). Recent liberal arts graduates have been found to earn less than graduates in technical and applied fields. These findings suggest that the “knowledge economy” does favour those with technical skills over those with soft skills (Walters and Frank 2010). University liberal arts graduates, however, tend to earn more than their counterparts from college programs as well as some college graduates in the business and health fields. Therefore, investing in the more costly university route (in terms of tuition fees) may have benefits in terms of employability for liberal arts graduates (Walters and Frank 2010). Related research has found that while liberal arts graduates earn less during the initial transition to the labour market, there is evidence that they eventually “catch up” and even surpass the earnings of their counterparts from more “applied” fields (Adamuti-Trache et al. 2006; Giles and Drewes 2001). These gains in earning over time have been attributed to the flexible skill set of liberal arts graduates and their greater likelihood of pursuing additional education (Walters and Frank 2010).
Student Employment
Many students work during the school year in addition to attending high school or post-secondary school, and the numbers of students working throughout the year have risen steadily over the past decades (Marshall 2010). Researchers have been interested in how in-school employment, or employment that students juggle with their academic schedules, impacts on academic performance. Much research suggests that long hours of work can interfere with student academic performance and increase stress levels (see, for example, DeSimone 2008; Motte and Schwartz 2009). In 2009–2010 the in-school employment rate of full-time post-secondary students was around 45 percent, compared to 39 percent 20 years earlier. The rates tend to be higher for women than men—51 percent for women in 2009–2010 compared to 41 percent of men in the same year. Students tend to work 16 hours per week on average, a figure that has remained fairly steady since the late 1990s (Marshall 2010). In 2009–2010, the average weekly earnings of full-time post-secondary students were around $200.
Tuition fees have increased at a faster rate than inflation during the last 20 years (Marshall 2010), creating a greater need for students to work in order to cover the costs of attending post-secondary education. Larger economic forces influence the employment patterns of students, however. Economic downturns result in higher youth unemployment rates, which researchers have linked to increases in student loan borrowing (Usher and Dunn 2009). Specifically, previous recessions in Canada have translated to an additional 6 percent in student loan borrowing per one percent increase in youth unemployment rates. The latest major economic downturn in late 2008 corresponded to a significant drop—around two and a half percent—in student employment in between the academic years 2007–2008 and 2009–2010 (Marshall 2010), although each successive term has seen small gains in employment of full-time students since.
Summer time has typically been a period when students work to earn money toward their continuing education. The three-month period from June to August is often planned out well in advance of the end of the school term by students who begin looking for prospective work during the winter term. The summer employment rate for students was also affected by the economic downturn of 2008, falling from 70 percent to 63 percent, although like the in-school employment rate, recent figures suggest a slow but steady recovery. Although specific figures are not available, the majority of summer jobs taken by post-secondary students are considered low-skilled and not career-related.
The Youth Employment Strategy (YES) was created in 1997 by the Canadian federal government to assist youth in finding employment. The Summer Work Experience program provides subsidies to employers for hiring students who are returning to full-time education in the fall. The Career Focus program, in contrast, is aimed at new graduates who require assistance in finding their first career-related work experience. The program links new graduates to potential “contributors” (those who will provide the work experience), who receive financial assistance from the government for supporting a portion of the salary costs for employing a new graduate for periods of six months to one year.7
The Transition to Adulthood
The shift from education to work is one major step in a larger process of youth development known as the transition to adulthood. The trajectory from childhood to adulthood makes an individual progressively more autonomous. Children are entirely dependent upon adults; youths move into a state of semi-autonomy, and eventually transition into fully autonomous adults. Youths are semi-autonomous and gradually develop their own independence through experiences in various social situations, fluctuating backwards and forwards in this trajectory (Franke 2010). Transitions during youth are also regarded as potentially impermanent and reversible (Mitchell 2006).
There are various aspects of life that the transition to adulthood can be focused upon, including those relating to leaving the home of their family of origin, those that focus on their integrating into the labour force, and those that correspond to financial independence. Of course, all of these aspects of life are intricately woven together. Having financial independence depends heavily on completing education and finding employment. Leaving the family home to live independently (or with a partner) also depends on having financial security. And the points at which these transitions occur are not “clean.” While leaving the home of the family of origin is associated with completing education and new career-related employment as well as forming partnerships with spouses, not leaving the parental home can also reflect economic challenges faced by young adults, or even the need to provide care for aging parents.
Researchers have found that the transition from adolescence to adulthood has lengthened in recent years. Compared to their parents, young adults today stay in the parental home longer and spend more years in education. (See Box 8.5 for a discussion of the terminology used to describe different generations.) This results in a later age of marriage and first birth. Demographers often look at five key transitions (Clark 2007) that are made by young people:
- completing education
- leaving the parental home
- completing one year of full-time employment
- entering a spousal or “conjugal” partnership; and
- having children.
Box 8.5 – Generations of Birth Cohorts
Much discussion around today’s young adults involves comparing them with previous generations. As such, it is useful to define what is meant by these different age cohorts. An age cohort is a group of people in society who were born at around the same time.
- Generation Y is the name that is given to people born between 1977 and 1986. Sometimes this cohort is also referred to as Echo-boomers (the children of Boomers) or Millennials
- Generation X refers to individuals born between 1967 and 1976
- Wave 2 Boomers were born between 1957 and 1966
- Wave 1 Boomers were born right after the end of the Second World War, between 1947 and 1956
- The War/Depression Cohort was born during the Great Depression and the Second World War, which stretched from 1932 to 1946
But what about people born after 1986? There is no commonly agreed-upon name that has been coined for this generation as of yet, although the terms Generation Next, Generation Z, and the Internet Generation are sometimes used to refer to young adults born in the 1990s and early 2000s. Only time will tell what “catches on.”
These five “markers” represent entry points into adulthood (Clark 2007) and often occur in the order in which they have been represented in Figure 8.5. Figure 8.6 shows the movement through the different makers by age group. As expected, the 18- to 20-year-old group has a relatively low percentage of completing many of these milestones, particularly leaving home, being in a relationship, or having children. Progressively through the different age bands, however, we can see that as more young adults finish their education, experiencing other life transitions occurs as well.
Previous generations, however, moved through these five milestones at a faster pace than more recent ones. For example in 2001, a 25-year-old had gone through as many transitions (about two) as a 22-year-old in 1981 and a 21-year-old in 1971. These changes are largely attributable to the extended time that young adults now spend in education compared to previous cohorts. Young adults typically graduate from a bachelor’s degree at age 23, for example. By the mid-30s, however, the gap between the generations in number of transitions completed closes. Figure 8.7 illustrates the different cohorts and the number of transitions completed between the ages of 18 and 34.
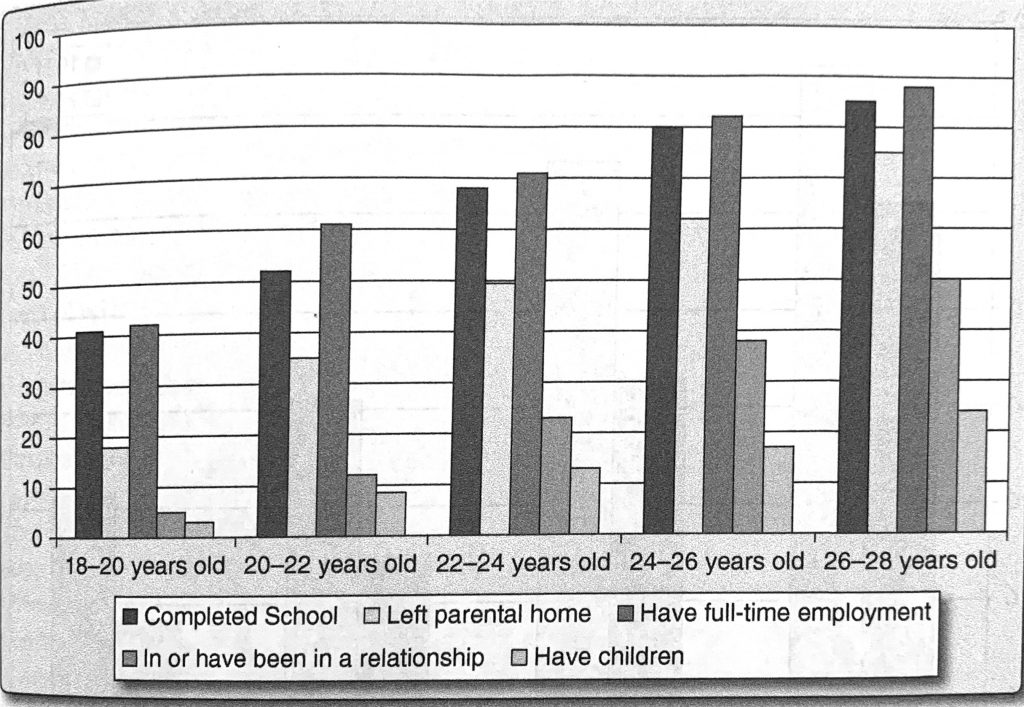
Source: Shaienks, D., and Gluszynski, T. (2009). Education and Labour Market Transitions. In Young Adulthood. Statistics Canada, Catalogue no. 81-595-M, no. 075, p. 22. www.statcan.gc.ca/bsolc/olc-cel/olc-cel?catno=81-595-MWE2009075&lang=eng
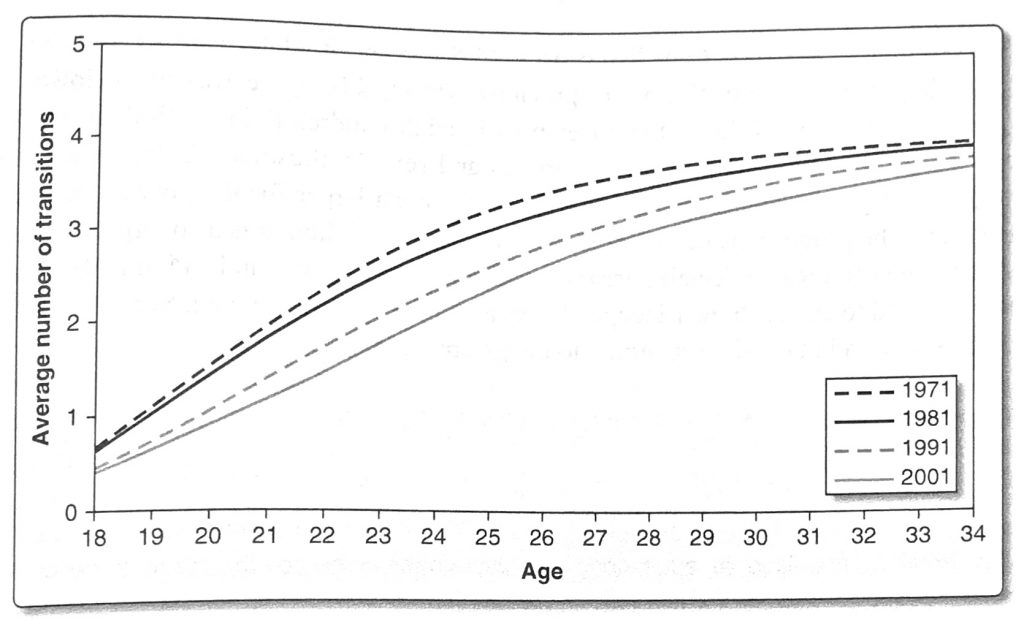
Source: Taken from Chart 2 in www.statcan.gc.ca/pub/11-008-x/2007004/pdf/10311-eng.pdf
Source: Data from www4.hrsdc.gc.ca/.3ndic.1t.4r@-eng.jsp?iid=77#M_1
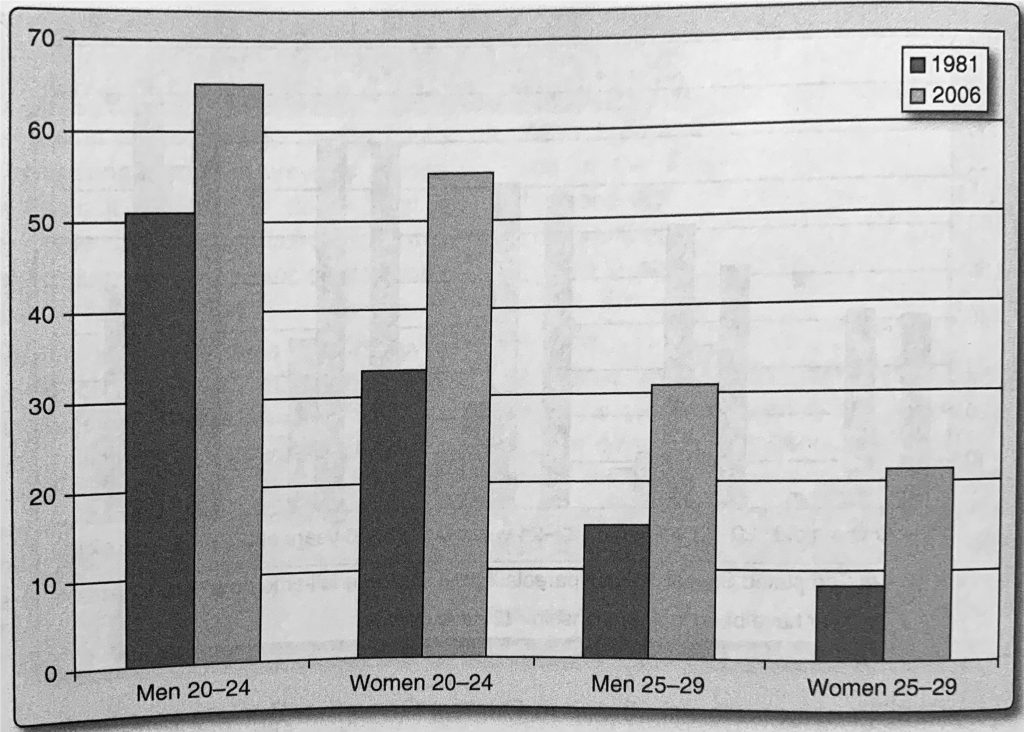
According to the 2006 Canadian census, 43.5 percent of adults aged 20 to 29 lived with their parents. Twenty-five years previous (1981), this figure was much lower at 27.5 percent. Figure 8.8 shows the differences in adult children living with their parents from 1981–2006, broken down by age groups and sex. As illustrated in the figure, the proportion of young people still living at home is much larger for the younger (20–24) age group. The proportions of males living at home into adulthood is also larger than the corresponding figures for females across the time and age cohorts, indicating that women generally tend to establish their independence at a younger age than men. See Box 8.6 for a discussion of adult children returning to the parental home.
Box 8.6 – Kidults, Adultescents, and Boomerangers
Much research and media attention has been given to the lengthier transition to adulthood experienced by recent generations compared to the life trajectory of earlier cohorts. New terms, such as kidults, adultescents, and Boomerangers have emerged to describe these new trends. Kidulthood and adultescence are words that have been coined by the media to describe the blurring of the boundaries between adolescence and adulthood and the extended time that young people live in the parental home and otherwise depend on their parents.
While more young adults are staying in the parental home longer, many are returning after having left home for a period of time. These returners to the parental home have been referred to as Boomerangers, or the Boomerang Generation. In 2001, about a quarter of adult children living with their parents were Boomerang kids.8 There are many reasons for this growing trend of returning to the parental home. One reason has been suggested in this chapter already: the pursuit of higher education is taking up more time in a young adult’s life than ever before. Strapped with the financial burden of student debt and the difficulty of finding desirable work after graduation, young people are moving back home when it makes economic sense. Financial difficulties were given as a reason for why a quarter of Boomerangers moved back home. Canadian data have shown that 19 percent of Boomerang kids indicated they had finished school for the academic year, while 8 percent moved back home after they had finished (or dropped out of) their schooling. Another reason is that there has been an increase in the acceptance of common-law relationships. These relationships are more likely to break up than marriages, and when they do, one response by adult children is to move back home. This was the reason that 10 percent of Boomerangers indicated that they had returned home (Beaupré, Turcotte, and Milan 2006).
Other countries have also joined in the creation of new terms to refer to the changing path to adulthood. In Japan, the term Freeter is used to describe young adults who do not have full-time work. In Italy, the term Mammoni is used to describe adult men who do not leave the family home and are cared for by their mothers. In Germany, an adult who takes a longer-than-usual time to leave the parental home is called a Nesthocker. In the United Kingdom, much attention has also been given to KIPPERS (Kids in Parents’ Pockets Eroding Retirement Savings), as research has shown that adult children, either living “at home” or not, place a remarkable financial strain on their parents, ranging from tuitions costs to down payments on their first homes.
The reasons why young adults leave the parental home for the first time have also changed over the generations. Figure 8.9 shows the reasons for leaving home broken down by birth cohort. As shown in the figure, the biggest reason for leaving home in earlier generations was to get married, but this eventually became replaced with wanting to be independent and to attend school in successive generations.
For example, as discussed earlier, youth do not typically wait until they finish their education to enter the labour market. A large proportion of high school (and some middle school) and post-secondary students work while in school. Most of this work is in low-paying and low-skilled jobs, but co-operative education and internships make it possible for some post-secondary students to pursue career-related training while in school.
Arnett (2000, 2004; Arnett and Tanner 2005) has suggested that the transition to adulthood in today’s society is better understood as emerging adulthood. Unlike past generations, youth has been extended into a particular lifestyle within which individuals explore their identities, focus on themselves, and experience much instability in their lives. This stage is essentially “in between” being an adolescent and an adult. Emerging adulthood, according to Arnett, is a lifestyle that has evolved due to the erosion of previously rigid social and institutional structures that characterized adulthood. Nowadays, youth are able to explore different lifestyles over an extended period of time.
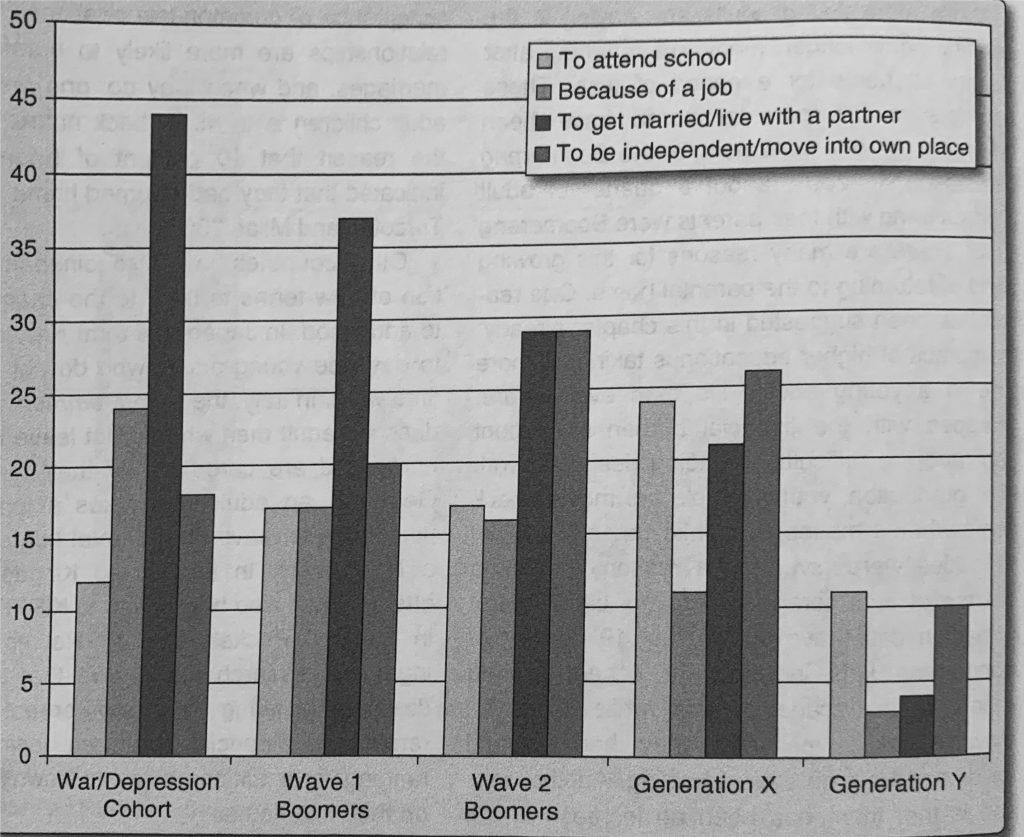
Sources: From Beaupré, Pascale; Pierre Turcotte and Anne Milan. 2006. Junior comes back home : trends and predictors of returning to the parental home. Canadian Social Trends, 82: 28-34, chart 2, page. 30. www.statcan.gc.ca/pub/11-008-x/2006003/pdf/9480-eng.pdf
Canadian sociologist James Côté (2002) has argued that rather than an “emerging adulthood” understanding of how today’s youth experience the transition to adulthood, an identity capital model better explains the changing social and economic conditions to which young people must adapt. At the centre of the identity capital theory is that the transition to adulthood is now a very individualized experience. In past generations, a more standardized set of transitions was experienced by the majority of the population. Côté attributes these changes to larger social changes that are characteristic of late-Modern Westernized societies in which old norms have become obsolete and society is in a stage of reorganization. Transitions to adulthood therefore become characterized by a series of personal preferences and choices.
There are also ways for youth to “repair” deficiencies that they may have in their stocks of social and economic capital (see Chapter 2) by making “identity investments.” Identity capital is focused on the sense of self that individuals construct from their technical and social skills, behaviours, networks, and personality traits.
There are two general paths that individuals may follow in their individualized life course: default individualization or developmental individualization. Default individualization results when individuals are passive about decisions made about their life trajectories and allow others (possibly parents) to make decisions for them. In contrast, developmental individualization is a path characterized by active and strategic pursuit of individual adult identity.
According to Côté, the most successful individuals have portfolios of identity capital that comprise tangible and intangible assets. Tangible assets are those that are socially visible for all to see, like credentials, network memberships, and “personal deportment”—that is, how a people carry themselves, how they dress, and the manner in which they speak. These tangible assets work as “passports” into the worlds of various groups with whom a person desires membership. In contrast, intangible assets within identity capital largely relate to psychological factors, such as the ability to self-regulate, strength of ego, and critical thinking skills. These assets allow individuals to understand and negotiate the various circumstances with which they will be presented in their occupational, social, and personal lives. For example, a young person may feel that his or her social networks are weak and may therefore invest in joining groups such as sororities or fraternities in order to invest in identity capital. This ability to address deficiencies, however, will be linked to the individual’s tangible and intangible assets, such as the social class of his or her parents and the psychological characteristics that the individual has to impress the gatekeepers of such membership groups.
Researchers have also identified a youth divide in the transition to adulthood. There are those who make the successful transition to adulthood, and there are those who have a series of risk factors (such as those discussed in Chapter 7) who are more likely to drop out of school, engage in crime, and experience chronic unemployment. The youth divide therefore describes the polarization of “successful transitioners” and those who transition into lives characterized by social exclusion (Bynner 2007). The majority of youth experience the typical delayed transition to adulthood characterized by later leaving of the parental home and integrating into full-time employment, while a minority of youth who have limited access to key resources transition to adulthood earlier by leaving the parental home at an early age and dropping out of school. This latter group, having transitioned earlier (and atypically) is less likely to succeed in the labour market due to their limited set of skills (Beaujot and Kerr 2007). See Box 8.7 for a discussion of the transitions to adulthood for marginalized youth.
It should be noted that while researchers tend to agree that there is a sharp difference between the school-to-work transitions of young people today compared to previous years, Goodwin and O’Connor (2005) have argued that current researchers have tended to oversimplify how transitions occurred in earlier generations. They argue that this “golden age” of straightforward transitions into the labour market by earlier generations has been assumed although there is much evidence that young people in those days also were faced with many choices and periods of uncertainty. Thus, this comparison to earlier generations who experienced a smooth and linear transition may be exaggerated, particularly when so many transitions today are predictable by factors of gender, race, and social class. Critics argue that while young people may feel they are in control of choosing their individualized transitions, they are still heavily constrained by social structures (Furlong and Cartmel 2007; Raffe 2011), whether they recognize it or not.
Box 8.7 – Marginalized Youth and the Transition to Adulthood
In Chapter 7, many factors associated with stratification in educational outcomes were discussed. Children in care were one of the groups that were discussed for the numerous challenges they faced. Many factors are associated with stratification in educational outcomes. Children in care are one of the groups that face numerous challenges compared to children raised in stable families. As discussed in this chapter, the transitions from school to work and to other markers of adulthood are taking longer they have in the past, with most adult children living with their parents into their mid-20s. Children in foster care, however, “age out” of the foster care system at 18 and must live independently from that point forward.9 Research from Canada and from many other countries has shown that youth moving out of the child welfare system face a wide variety of problems: they are more likely to drop out of secondary school, be unemployed, have mental health problems, be on social assistance, and be in trouble with the law (Reid 2007).
Reid (2007:33–34) explains that “[f]or the majority of youth, the transition to adulthood represents a process that takes place over a period of time with the support of family and friends. In Canada and around the rest of the world, it is becoming commonplace for youth to depend on their parents well into their twenties. . . . Youth in state care are considered at risk, yet they are the ones most unlikely to be receiving support from family or the state. They do not have a sturdy safety net to catch them as they waiver on the brink of adulthood.”
Tweddle (2007) has examined initiatives in Canada that have been targeted at improving the outlook for youth moving out of the child welfare system. For example, Alberta has created a Youth in Transition initiative targeted at youth who “do not have all of the necessary supports, skills or developmental abilities to manage transition toward healthy adulthood.”10
In Ontario, “transition year” programs at University of Toronto and York University assist youth who have experienced social and financial barriers by giving them academic and non-academic skills they need to be prepared for university.
Many Aboriginal youth also face particular difficulty in the transition from school to work. The unemployment rates for Aboriginals across Canada are much higher than the national average, and this has become even more pronounced since the economic crisis of 2008. Aboriginal unemployment increased to 13.9 percent in 2009 from 10.4 percent in 2008, while the corresponding rates for non-Aboriginal people were 8.1 and 6.0 percent.11
The difficulty for Aboriginals in obtaining work is closely tied to their lower levels of educational attainment and higher rates of high school dropout, which were discussed in Chapter 7. Because trades careers have been a major school-to-work transition path for Aboriginal youth, many provinces have established apprenticeship programs specifically targeted at Aboriginal youth (e.g., The Aboriginal Youth Initiative in Alberta, The Aboriginal Apprenticeship Board of Ontario, and The Manitoba Aboriginal Apprenticeship Trades Strategy). These apprenticeship programs are argued to reduce the disadvantages faced by Aboriginal people in the labour market, particularly given the current need for skilled labour in the trades (Brigham and Taylor 2006). It is also argued that such training is “culturally appropriate” because apprenticeship training—or learning skills from elders—has been a historically important part of educating people in Aboriginal cultures and that it matches the preferred learning styles of many Aboriginal youth.
Transition from School to Work in Other Countries
The transition to adulthood is dependent on many economic, cultural, and historical factors in a society, and therefore it varies considerably from culture to culture. Before discussing differences between countries, it is useful to begin by addressing the common features of school-to-work transitions across countries. Raffe (2011) suggests that there are some common features of the school to work transition that many developed countries around the world share.12
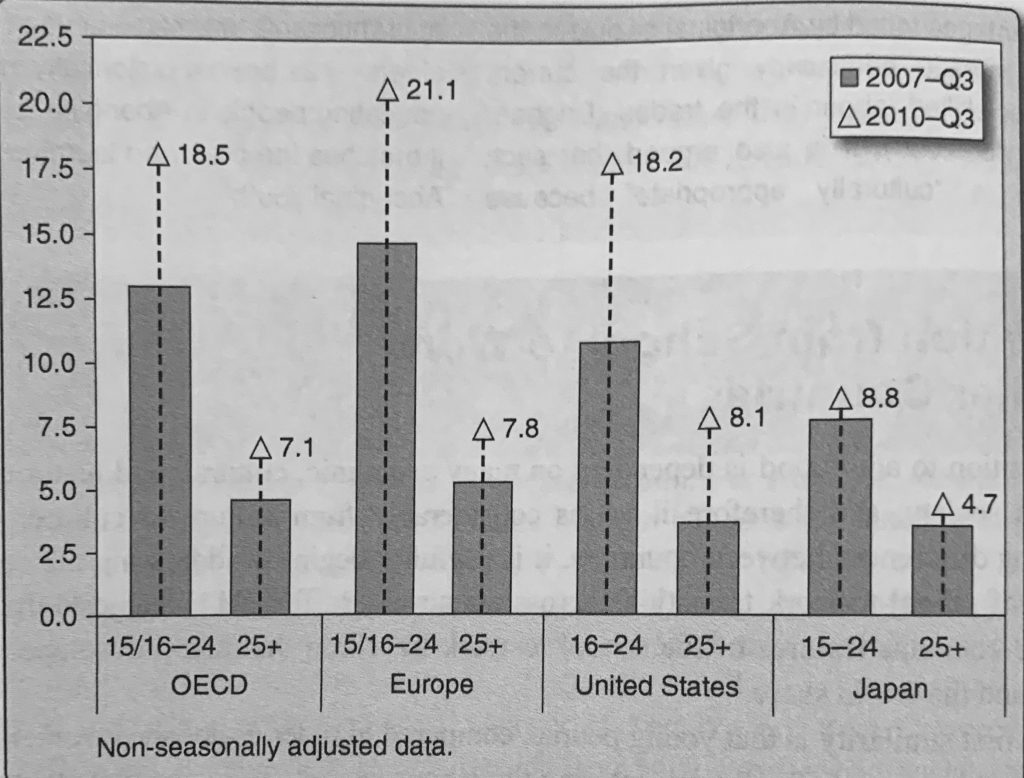
The first similarity is that young people, compared to older established workers, have a considerably more difficult time entering the labour market. The unemployment rate of youth in OECD countries is often double that of the adult rate and has become even more pronounced in recent years. In the period between 2007 and 2010, unemployment of youths (age 16 to 24) has increased on average by 5.5 percentage points across the OECD countries (Sonnet and OECD 2010). Across Europe, the unemployment rate for youths was 21.1 percent, compared to 7.1 percent for those aged 25 and over. The corresponding figures for the United States were 18.2 percent and 8.1 percent. For Japan, youth unemployment was at 8.8 percent compared to just 4.7 percent in the 25-plus age group. Figure 8.10 illustrates these rates (denoted by the triangle marker) and their changes from earlier years (denoted by the end of the bar). See also Box 8.8 on “NEETs.”
Jobs into which youth transition are generally less stable and are poorly paid compared to those occupied by older workers. And young people often move between periods of employment and unemployment and between similar-level jobs. According to Raffe (2011), one reason for this gap between the younger workers and more established workers is due to the higher employment risks perceived by employers when contemplating hiring a younger worker. Older workers often require less training and are less likely to change jobs as quickly as younger workers.
The second commonality across countries is that education systems play an important role in preparing individuals for the labour market. While the processes themselves vary widely between different countries, there is a general pattern that education systems in each country are vital to worker preparation.
The third feature of school-to-work transitions that is common to all countries is that the transition process itself varies widely among individuals. There are many different trajectories that individuals may take that are based upon many factors, but they mostly relate to the education choices made by the individual. Like in Canada, educational levels of young people have grown across all OECD countries. This has resulted in a “downgrading of educational credentials” (Raffe 2011:314) wherein the same diploma or degree leads to less desirable jobs than it did in earlier generations. The OECD countries all share the common feature that university graduates tend to do better than those who terminate their education at high school (or the country equivalent).
Source: OECD (2010), Off to a Good Start? Jobs for Youth, OECD Publishing. http://dx.doi.org/10.1787/9789264096127- en
Box 8.8 – Who Are the NEETs?
The initialism NEET stands for Not in Education, Employment, or Training. This label has been used in recent years, particularly in the EU countries, to describe economically inactive youth and young adults. Economically inactive means that the person is not in employment, nor does he or she have any other economic activity, like being a student. In 2010, across the OECD nations, around 12.5 percent of young people (or 16.7 million) between the ages of 15 and 24 were NEETs, which had increased from 10.8 percent just two years earlier. This group of young people is of particular concern to policy-makers because this low-skilled and poorly educated group faces very limited employment prospects. The recognition that spending time as a NEET can damage future employment prospects has been dubbed scarring by some experts. There is concern that a scarred generation may jeopardize the economic recovery of many nations if governments do not take action to improve the employment outlook for today’s young people.
Related to the previous point is the fact that, in all OECD countries, education-to-work transitions vary widely by sex. Despite the rising educational qualifications of females, the processes that shape the work transitions for women operate much differently for them than for men. The nature of the differences varies from country to country, but the commonality among countries is that gender matters in influencing school-to-work transitions.
The final similarity in school to work transitions shared by countries is that there is a consensus that we are observing “new” pathways being followed by young people that differ from the experiences of previous generations. The transition period, usually considered to be between the ages of 15 and 25—beginning when a young person is no longer in “compulsory” schooling and ending when he or she finds relatively stable employment—is generally taking a much longer time than it has in the past. The “emerging adult” and “identity capital” theories discussed earlier in this chapter are being used in discussions of school-to-work transitions around the world.
Differences among Countries in School-to-Work Transitions
One way of assessing how successful a country is at school-to-work transitions is to examine its youth unemployment rates; the higher the unemployment rate, the more difficulty youth face when trying to enter the labour market. These rates, however, do not help when trying to figure out why such differences exist among countries. Explaining these differences is not easy as there are many factors at play that are closely tied to the cultural, social, historical, and institutional characteristics of each country.
Many transition typologies have been offered by sociologists. Transition typologies refer to the ways of organizing or dividing up countries by particular features that may help in explaining the different process of school-to-work transitions. These typologies are generally ideal types—they make sense theoretically but in practice rarely work to explain things so tidily. Explaining country differences is a complex problem that is assisted by typologies but not completely solved by them. Raffe (2008) explains that most transition typologies focus on three dimensions of the school-to-work transition: (1) how closely “coupled” the links are between education and employment, (2) the extent to which educational pathways are standardized, and (3) the degree of stratification and diversity of outcomes.
One family of typologies focuses on the differences among countries in terms of how education and employment are linked together (Raffe 2011). In some countries, such as Germany, there is a very strong linkage between education and employment, and employers and schools both participate in the delivery of training. In countries with a strong linkage between education and employment, there tends to be established apprenticeship programs. Apprenticeship programs are oriented toward training people in the skills of a trade, and in such programs a young person works for an employer while being taught the skills of the trade on the job. On the other end of the spectrum are countries like the United States and Canada where there is a “decoupled” system with few formal ties between industry and education. Then there are countries in the middle, like the Netherlands, where employers play a strong role in shaping vocational education curriculum, but have no part in the delivery of education. Other countries, such as the UK and France, are characterized by responding quickly to market forces in deciding what types of courses to offer, while Japan has a strong tradition of school placements that foster ties between employers and education institutions.
Marsden (1990) identified two major transition systems that are also based on the linkages between education and employment. Occupational labour markets (OLM), as the name suggests, are organized around occupations. In OLMs, there are clear occupational requirements and training schemes that are largely regulated by the occupations themselves, with extensive “coupling” between education and employment. Apprenticeship systems are an example of such an arrangement. Countries characterized by internal labour markets (ILM) are rather different because instead of education being occupation-specific, the labour market is organized around enterprises where occupational boundaries are more fluid and where more general sets of skills are required. Countries with strong apprenticeship traditions, such as Germany, Austria, and Switzerland, are usually associated with OLMs, whereas France, the United States, Canada, and the UK typify the ILM category.
Kerckhoff (2000) has also suggested that countries can generally be split into two general types based on the linkages between school and work. Type 1 countries are those that are characterized by highly structured and standardized education systems that stream individuals into specific occupations. In contrast, Type 2 countries are characterized by less standardization and more flexibility, with looser connections between education and employers.
Interestingly, the Type 1 and Type 2 classification scheme highly overlaps with the other transition typologies discussed above. In Type 1 countries, there are strong connections to the labour market and training, whereas in Type 2 countries, this linkage is weak. In Type 1 countries, completing education is associated with a quick integration into a job and a low risk of being unemployed. The highly structured nature of Type 1 systems means that trajectories are very predictable and seemingly guaranteed. The downside, however, is that the educational streaming system (Chapter 5) in such countries is very strong as well, and once you are on a specific pathway, it is difficult to change directions. Type 1 countries are usually OLMs, while Type 2 countries are almost always ILMs. When youth in Type 1 countries complete their education, they can move into higher-level skill-based occupations, but there will be little upward mobility in their jobs over their lives.
In contrast, Type 2 countries have less standardized education systems, with weak tracking that focus more on general skills rather than those that are occupation specific. As such, there is a weak linkage to the labour market. Upon completing education, young people have more difficulty integrating into the labour markets of Type 2 countries and face a high risk of unemployment. They typically start at low-level jobs, but have more flexibility in choosing their work and have a high possibility for career mobility. Table 8.2 summarizes the differences between Type 1 and Type 2 transition systems and the relationships with characteristics of the other typologies discussed above.
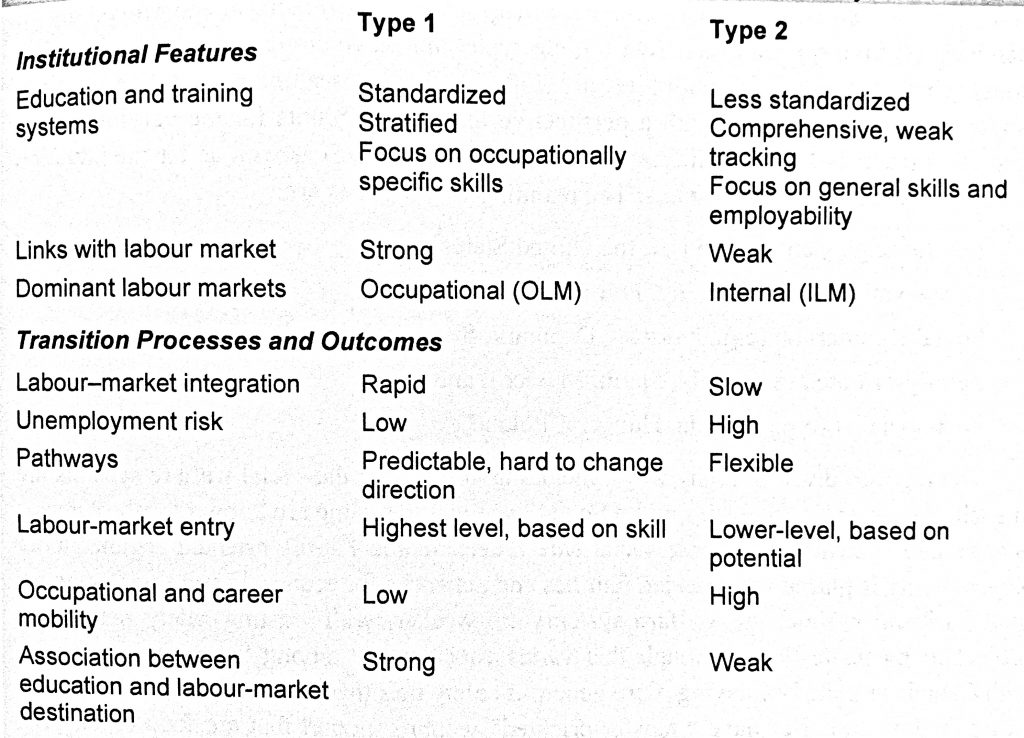
Source: From Table 22.4, p. 321 Raffe, D. (2011) Cross-national differences in education-work transitions, in London, M. (ed.) The Oxford Handbook of lifelong Learning. New York: Oxford University Press. Used with permission.
Differences among Countries in the Transition to Adulthood
In most cultures, there is a general consensus that the transition to adulthood, like school-to-work transitions, is taking longer than in previous generations. Recent research has examined how processes of globalization are influencing the transitions to adulthood in modern societies. Globalization refers to the increasing economic, technological, cultural, and migratory linkages of countries throughout the world.
Esping-Andersen (1990) was one of the first sociologists to suggest a multi-country classification system of “welfare regimes,” which generally classifies countries into those with similar models of social policy (which are characterized by specific social, political, and economic arrangements). Since then, many researchers (including Esping-Andersen) have critiqued the model and adapted it to examine specific outcomes, such as transitions to adulthood.
In a detailed overview of globalization processes and how these factors contributed to social inequalities in OECD countries, a group of researchers at the University of Bamberg (Germany) identified five regime types that have similar cultural and institutional characteristics (Buchholz et al. 2009). These researchers modified Esping-Andersen’s (1990) regimes with a perspective that also accounts for the varying family formation patterns found in different countries (Ferrera 1996) as well as for the situation of more recent post-socialist states. The resulting five regimes are:
- Liberal (e.g., Canada, the UK, the United States);
- Conservative (e.g., Germany, France);
- Social Democratic (e.g., Norway, Denmark, Sweden, Finland);
- Family-oriented (e.g., Italy, Spain, Mexico); and
- Post-socialist (e.g., Estonia, Hungary, Poland).
The regimes differ in many ways, including how strong the social welfare systems are in each. For example, countries in the Social Democratic regime are known for their generous welfare systems and strong social safety nets. In the Family-oriented regime, more responsibility is placed on extended families and networks for economic and social support. In the Liberal regime, the welfare systems are weaker, with existing safety nets being subject to means-testing (although this varies considerably among “member countries,” with Canada and the UK having more generous safety nets than the United States). Conservative regime countries have “transfer-oriented” welfare support that are focused on protecting the living standards of those not in the labour force, largely based on employee contributions. Unlike the Social Democratic regimes, however, this welfare support in Conservative regimes is limited to specific spheres that do not extend, for example, to child-care provisions. In the Post-socialist regime, much transformation is still occurring.
In terms of leaving home, youth in Social Democratic countries have typically been “early departers,” while members of the Family-oriented regimes tend to stay at home the longest (Iacovou 2002). For example, recent data have shown the average age of leaving the parental home to be 20 for Finnish females and 30 for Italian men (Newman and Aptekar 2007). In Social Democratic countries, there is a pattern of early home-leaving as well as non-traditional family formation (entering into common-law unions and not marrying). The strong support of the welfare state encourages early autonomy and experimentation (Buchmann and Kriesi 2011). In contrast, the longest home-leaving ages are observed in the Family-oriented countries, where weak state support necessitates stronger reliance on families.
Table 8.3 summarizes some key differences among the welfare regimes. (Note: Active labour-market policies are characterized by government interventions that are used to help the unemployed find work such as through training schemes or employment services, whereas passive policies do not have as many of these features.)
Buchholz et al. (2009) note that what all youth in all countries share in common is that there is increased uncertainty around employment, which has resulted in the postponement of family formation. Because there are fewer guarantees of employment after completion of education, youth in many countries experience precarious (temporary) bouts of employment. This leads to instability, which the authors indicate has knock-on effects for other adult transitions, like getting married and having children, which are occurring at an increasingly later average age. Buchmann and Kriesi (2011) also note that country differences tend to be the greatest at around age 25, but they are quite small before 20 and after 35.
Table 8.3 Highlights of Major Differences Tied to Transition to Adulthood, by Regime
Source: Adapted from Buchholz et al. (2009)
| Liberal | Conservative | Social Democratic | Family-oriented | Post-socialist | |
| School-work linkages | Weakly regualted | Strongly regulated | Moderately regulated | Strongly regulated | Transitioning to market economy |
| Labour market policies | Passive
Moderate support for those outsidemeans-tested benefits |
Active
Strongly oriented to those already “inside” |
Active
High taxes, generous social security sytem |
Passive
Reliance on family and networks |
Various
Moving in different directions |
| Gender | High integration of women | Lack of benefits can require women to stay home to care for children | High rate of female employment | Occupational career perceived as conflicting with family tasks for women, which has led to bery low rates of fertility | Has become more of an issue after fall of Communism |
| Age at leaving home | Increasing | Increasing | Youngest | Oldest | Increasing |
Chapter Summary
This chapter began by discussing how education serves many purposes in society and noting that one of the major purposes it serves is to prepare youth for the labour market. The Canadian workforce is more highly educated than it ever has been and Canada has one of the highest rates of post-secondary education, particularly university degrees, among the OECD nations. The costs of education were also discussed in terms of tuition and the investment that an individual must make in himself or herself, at the cost of potentially lost earnings.
After completing education, most young adults transition into the workforce. The path from education to work, however, can take many forms. Numerous pathways were described and the paths which a recent cohort of Canadian youth had taken (or were currently on) were described. While there appears to be a preference in high schools for promoting university and college paths, the reality that around half of high school students pursue vocational or other careers was discussed. This group is referred to as the “forgotten half,” as much research in education tends to focus only on young adults who go on to college or university. Important social class backgrounds that factor into such decisions were revisited.
The transition to the labour market can be difficult, and the increasing youth unemployment rates in recent years have increased the challenges that new graduates face when trying to find work. Research was reviewed that has highlighted how field of study and college/university program are strongly linked to the ease at which new graduates find work. Continuing on in post-secondary studies to the post-graduate level was also discussed. Earnings and how they are associated with field of study, college diploma or university degree, and post-graduate education were also reviewed. The “fit” between the jobs that graduates get and their actual education was next explored. Potential mismatches can be in terms of level of education or in field of study. The concern that employers have different expectations of the skills sets of recent graduates was also addressed.
One possible way of giving students more occupation-specific skills has been through involving them in experiential learning. Often regarded as limited to trades and apprenticeship career-paths, experiential and “co-operative” learning has been expanded to many colleges and universities across Canada. Next, the debate around the actual “value” of a liberal arts degree was explored. Trends in student in-school and summer employment were also discussed.
School-to-work transitions were conceptualized as being one part of the larger experience of transitioning to adulthood, of which there are five general “stages.” Theorists have argued that recent generations are experiencing a different transition to adulthood compared to older cohorts. The experience now has lengthened considerably, largely due to the higher levels of education acquired by younger generations. The pursuit of these qualifications has the effect of lengthening the time they stay in the parental home, increases the age at which they get their first career-related job, and delays marriage and childbearing. The additional difficulties experienced by children in care and Aboriginal youth were also discussed.
At the end of the chapter, the similarities and differences in the school-to-work transitions among other countries were examined. Different transition typologies were suggested for assisting in understanding why youths in certain groups of countries have similar experiences to one another. Finally, country similarities and differences in the larger experience of transitioning to adulthood were explored, using regime theory to assist in grouping together similar country-types.
Review Questions
1. Define knowledge economy. How is the knowledge economy related to levels of educational attainment in Canada?
2. Define gappers and second chancers.
3. Explain what is meant by the “forgotten half.”
4. Explain three main ways that the transition to work varies by credential (e.g., college diploma or university degree) and field of study.
5. What is meant by job–education mismatch? Explain the two types of mismatch described in the chapter.
6. Define experiential learning and explain how it assists with school-to-work transitions. Identify two types of experiential learning techniques used in education.
7. Describe current Canadian trends in in-school and summer employment;
8. Explain the five major stages in the transition to adulthood.
9. Explain what is meant by Boomerangers and kidults.
10. Compare and contrast emerging adulthood and identity capital.
11. Identify three reasons why the transition to adulthood can be more difficult for marginalized youth.
12. Identify three different transitions typologies and explain how they understand work-to-school transition differences by country.
13. Identify the five different regimes and explain how two major factors characterize transition to adulthood in each regime.
Exercises
- Does your college or university offer co-operative education? If so, explain how co-operative education works within the degree or diploma program and in what fields of study it is offered. If your college or university does not offer co-operative education, look at the Canadian Association for Co-operative Education website (www.cafce.ca) and find a nearby school that does offer co-operative education and answer the previous questions.
- Interview a parent and a grandparent (or a senior citizen) about the different stages in their transition to adulthood. For example, at what age did they leave home? At what age did they get their first job? How does this compare to your own experiences?
- Referring to Figure 8.1, identify the current “path” that you are on. Think of friends or relatives of yours who have taken different paths. What were they? What were the life circumstances that surrounded their decisions to take these paths? How were their circumstances similar or different from yours?
- What kind of job do you see yourself in when you complete your education? What skills have you acquired (or do you hope to acquire) during your education that will help you in your desired job? Identify the different skills as being soft skills, academic skills, and job-specific skills.
- If you are reading this textbook, it is likely that you are a social science or education student. Have you ever thought of having a vocational career? If so, what kind? If not, why not?
Film Recommendation
- Wards of the Crown, 2005, National Film Board of Canada, Directed by Andrée Cazubon.
Documentary about four youth in foster care transitioning out of the system and the difficulties that they face.
Key Terms
developmental individualization
Term referring to the continuously adapting society characterized by a large proportion of jobs based upon the skills of highly educated and technically proficient employees; often invoked to discuss education, life-long learning, employment, and skills training programs.
The benefits that have to be forgone in order to pursue the activity of choice, such as forgoing potential earnings from full-time work while pursuing educational credentials.
Individuals who have dropped out of high school but return to education at some later point in time.
Individuals aged 21 or older without high school diplomas who enter post-secondary institutions such as college and university; assessed for admission in a different manner than regular applicants, with work experience and academic potential taken into account.
Individuals who complete high school and then enter the labour force for some time before continuing with their education.
The approximate half of Canadian youth who do not desire post-secondary education or who do not finish the programs they began.
Employment situations where the education and training of the employee do not match his or her qualifications.
Situation in which years of education needed for a job relative to years of education possessed by the employee do not match.
A situation in which an employee’s field of study and job do not match.
The underutilization of the skill sets of new immigrants.
The phenomenon of highly educated graduates leaving and emigrating from their countries of origin elsewhere
The situation of an immigrant-receiving country benefiting from the entry of highly educated immigrants.
Skills in communication, leadership, teamwork, interpersonal skills, and problem solving.
A set of educational practices that involve work placements, allowing students to obtain a set of skills that can be acquired only through exposure to the work environment; also referred to as co-operative education.
Employment that students juggle with their academic schedules and that often impacts on academic performance.
A group of people in society who were born at around the same time.
Term used to describe the transition to adulthood in today’s society, whereby youth has been extended into a particular lifestyle in which individuals explore their identities, focus on themselves, and experience much instability in their lives.
A term associated with the work of Côté about current trends in the transition to adulthood that regards the current process as a very individualized experience, characterized by a series of personal preferences and choices.
Occurs when individuals are passive about decisions made about their life trajectories and allow others (possibly parents) to make decisions for them.
A path characterized by active and strategic pursuit of individual adult identity.
Those assets that are socially visible for all to see, such as credentials, network memberships, and “personal deportment.”
Those assets within identity capital that largely relate to psychological factors, such as the ability to self-regulate, strength of ego, and critical thinking skills.
The ways of organizing or dividing up countries by particular features that may help in explaining the different process of school-to-work transitions. These typologies are generally ideal types in the sense that they make sense theoretically but in practice rarely work to explain things so tidily.
Programs oriented toward training people in the skills of a trade; a young person works for an employer while being taught the skills of the trade while learning on the job.
The increasing economic, technological, cultural, and migratory linkages of countries throughout the world.
