7 Efficacy of Learning and Teaching with LinkedIn Learning in Student-Led Reading Courses
Sheida Shahi and Moien Giashi
Abstract
The efficacy of student-directed research and reading courses can be increased with the accessible and coherent fundamental knowledge base offered by LinkedIn Learning. In the structure of a student-directed research or reading course, new topics are commonly investigated on an individual basis. The benefits of implementing LinkedIn Learning for acquiring background knowledge in a self-directed post-graduate reading course are examined. This case demonstrates how LinkedIn Learning can be used as a learning tool for curriculum development and skill-building support in independent studies, drawing on its fundamental skill-building assets for non-conventional and individual-oriented teaching scenarios. LinkedIn Learning can be used as a framework and a reliable source for acquiring necessary base knowledge. It has extensive resources and learning paths defined for various topics. Existing paths cover a selective range of topics and do not include all courses related to a topic. Available LinkedIn Learning resources are analyzed for two common independent study topics in engineering and data science. It is anticipated that by offering fundamental skills and resources and an overall framework to students, they will be encouraged to undertake self-directed and research-oriented courses in their postgraduate studies. Increasing efficacy of independent research can yield direct benefits to individual research projects and fill gaps in the availability of specialty post-graduate courses.
Key Words
student-led learning, independent research, curriculum development
Background
Student-led independent study courses demand independent research in a specific topic in collaboration with an academic advisor. In a student-led course, students often get the chance to develop their own individual syllabus catered to their interests and their larger research projects at hand, or develop skills required in their relevant industries. A reading course allows students to develop a knowledge advantage in a specialized topic of their choice and encourages direct ownership of the educational experience. Students are empowered by pursuing their areas of interest and being at the centre of their learning experience (Marvell, Simm, Schaaf, & Harper, 2013). While students are in control of their knowledge acquisition, academic advisors act as facilitators. The advisor’s role is focused on ensuring work is being done within academic frameworks (Marvell et al., 2013). Student-led learning is known to have high impact and efficacy as it promotes reflection and critical thinking and increases motivation through empowerment. For undergraduate students conducting student-led courses, post-graduate studies and innovative career opportunities will be a likely prospect (Walkington, Hill, & Kneale, 2017).
The authors have experience with undertaking self-designed independent courses in science and engineering. In the process, LinkedIn Learning proved to be an effective resource to ensure the base knowledge for pursuing independent topics was addressed. This case will primarily explain and analyze the experience of the authors in undertaking independent study courses with LinkedIn Learning as a primary resource. It will outline the use of LinkedIn Learning as a learning tool in a research reading course. LinkedIn Learning’s ancillary support materials for general topics, software, and techniques are helpful for the development of independent post-graduate studies. In this process, the methodology for creating independent study plans will be explained and a framework will be proposed. These typical outlines will be helpful in breaking the barrier of knowledge for undertaking self-directed research, allowing independent research to be more accessible to a larger body of students.
Structure of Student-Directed Learning
Student-led courses are defined as individual research studies in a field of special interest, designed and implemented by independent undergraduate or graduate students. Students work independently and are supervised by a faculty member. Students must discuss ideas for independent-study with a supervisor of interest and develop the study plan in line with their guidance. The content, scope, and end results are determined by students and agreed on with the supervisor. The outcome of student-led courses is typically either a research paper, written report, or conducted project. These typically outline, analyze, and interpret a single topic in depth. Regular check-in meetings between students and supervisors are recommended for progress tracking and feedback. Independent research classes in most institutions are limited to one with a single supervisor for a total of two for the duration of study. Preliminary research is required by students to determine scope, objectives, and methodologies for the research or topic to be investigated. After approval by a faculty member, the course will be examined and approved by the department enabling student enrollment (University of Toronto, 2017). In this process, the students are therefore responsible for developing their own learning paths and curriculum. In instances of increased interest in a single topic, a group of students can also conduct student-led research as part of a group, enabling peer-to-peer learning.
Benefits of Student-Directed Learning
Contemporary post-secondary education has shifted from a focus on a traditional advisory approach to one that is centred on student-led and collaborative models. The focus on student-led learning and research trains students as scholars and innovators and prepares them for academic endeavours and careers (Smyth et al., 2016). In a student-directed course, instead of conducting research within a defined research umbrella by faculty, students are given the chance to develop their own topics of interest and research questions. In this way, students can adopt novel expertise and skills (Ho et al., 2013). Within a student-led learning structure, individual creativity in knowledge creation and self-empowerment is strengthened. Student-led learning can also foster an exploratory learning environment in a safe, resourceful, and experimental atmosphere. It is an alternative to faculty-driven education, which is traditionally lecture-driven and pre-determined (O’Grady, Shahi, & Przybylski, 2014).
Student-led and peer-to-peer learning has strong roots within the University of Waterloo. Collaborative learning is fostered through Waterloo’s co-operative education program, where undergraduates alternate between taught academic terms and paid professional internships. The co-operative program allows the dissemination of knowledge between practice and ongoing theoretical investigations. During academic terms, there are many student clubs and initiatives that foster student-led learning. For example, F_RMlab is a student-led group focused on computational design. F_RMlab acknowledges the high speed of change in computational design and encourages a student-led and peer-to-peer learning atmosphere. Co-founded by Sheida Shahi at the University of Waterloo School of Architecture, F_RMlab engages in a lateral model of self-taught and peer-to-peer learning methodologies. Groups of students gather and share their urgency in learning required skills and finding applications relatable to the industry (Ho et al., 2013).
The Role of LinkedIn Learning in Higher Education
With LinkedIn Learning’s monthly subscription model students have unlimited, on-demand access to all courses within the platform. The subscription model makes LinkedIn Learning a flexible learning platform where students can be exposed to a large range of different reference materials, making this platform ideal as a referencing and supplemental learning tool. LinkedIn Learning’s pool of topics ranges from design to business and technology to personal skill building. The written and video content is developed by industry experts. The breadth of knowledge available on LinkedIn Learning makes it a useful tool for gaining general knowledge on a variety of topics (Yagil, 2018). Most courses are available at beginner and intermediate levels and are ideal for skill building.
LinkedIn Learning offers almost 6,000 courses in four main categories: (1) development, IT, business, and web; (2) 3D, animation, and CAD; (3) design, marketing, photography, music, and video; and (4) education and learning. The range of available topics makes LinkedIn Learning ideal for supplementing existing professional and educational endeavours (Chen, 2018). It has an accessible learning technology with reliable content and teaching methods. LinkedIn Learning’s strength is also in the user’s ability to explore new topics, sidestep segments, and focus on particular parts of a topic. While LinkedIn Learning’s library provides a range of topics, the course examples highlighted in this case demonstrate how the resources can be used to set up playlists and study plans to gather all facets of a singular topic (Samuels, n.d.).
Case Objective
This case demonstrates the efficacy of LinkedIn Learning as a series of comprehensive and consistent resources for providing a reliable basis for independent studies. This case addresses the opportunities that LinkedIn Learning provides for facilitating more accessible student-led reading courses. The use of LinkedIn Learning provides students with the ability to ensure that basic knowledge can be addressed. The objectives of this study are to outline examples of using LinkedIn Learning in independent research work, and to develop a framework to be used by other students in future reading courses.
Case Methodology
The methodology for this case will include case study analysis of using LinkedIn Learning in the early stages of an independent reading course structure. The role of LinkedIn Learning as a learning tool will be illustrated in two examples of student-led courses. Through the case studies, frameworks for utilizing the resources available on LinkedIn Learning to help structure an independent study will be outlined. The focus will be to highlight the use of LinkedIn Learning for determining specific topics in an area of study on which to focus, for development of curriculum, and for ancillary support of concepts. The use of LinkedIn Learning in independent-study curriculum development will be demonstrated and implementation assisted in making independent studies more accessible and improving the quality of the experience for independent students. It is anticipated that through more accessible and higher quality independent education, there can be direct benefits for individual research projects as well as addressing the increasing need for developing specialized and applicable post-graduate courses.
LinkedIn Learning’s resources are focused on industry-relevant and cutting-edge software. While a range of software applications are covered throughout the platform, typically the focus is on the most in-demand software in each discipline (Figure 7.4 and Figure 7.9). With a considerable number of courses and videos available for each software application, all developed by industry experts, LinkedIn Learning becomes an effective technical resource for advancing these skills. With the help of LinkedIn Learning’s ever-growing library of resources, students can continuously develop their skills in areas that are either not offered by the university or outside the expertise of faculty. The following two student-led courses will demonstrate strategies that can be adopted by students for undertaking independent studies with LinkedIn Learning as a primary resource for both curriculum development and skill building.
In the first example, the efficacy of LinkedIn Learning in providing effective base resources and a suitable reference for independent studies will be examined using experience of the authors in the topics of Building Information Modelling (BIM), a major area of research in construction management. In 2018, 10 students showed interest in undertaking independent studies relating to BIM foundations, scripting, and implementation in the industry at the Department of Civil and Environmental Engineering, University of Waterloo. The second example will illustrate how LinkedIn Learning was used to address the industry need for data science knowledge, specifically data visualization. These two topics were chosen due to growing interest and applicability to both academic studies and industry applications. From this light, the use of LinkedIn Learning in the implementation of one independent study curriculum and study support will be highlighted.
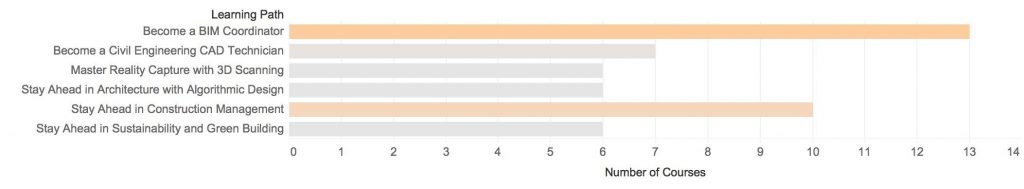
One of the main benefits of LinkedIn Learning is in providing solid background for reliable, self-directed, post-graduate reading courses. Content in LinkedIn Learning can be accessed through its Learning Paths, a series of playlists organized to categorize specialties being offered. While the Learning Paths provided by LinkedIn Learning are a helpful starting point, it is important to complete a thorough study of available resources. As an example, the “Stay ahead in Construction Management” learning path highlights 10 courses related to the topic (Figure 7.3), while analysis into available resources reveals 19 courses available on LinkedIn Learning that are directly related to Construction Management using BIM technologies (Figure 7.2). The following framework is proposed for completing a thorough survey of existing resources on specific topics.
Developed Framework
A general framework has been developed by the authors for examining, organizing, and using LinkedIn Learning’s resources on specific topics. It was developed in the process of developing the independent-study courses highlighted in this case (Figure 7.1) and can be used for study plan development of future courses.
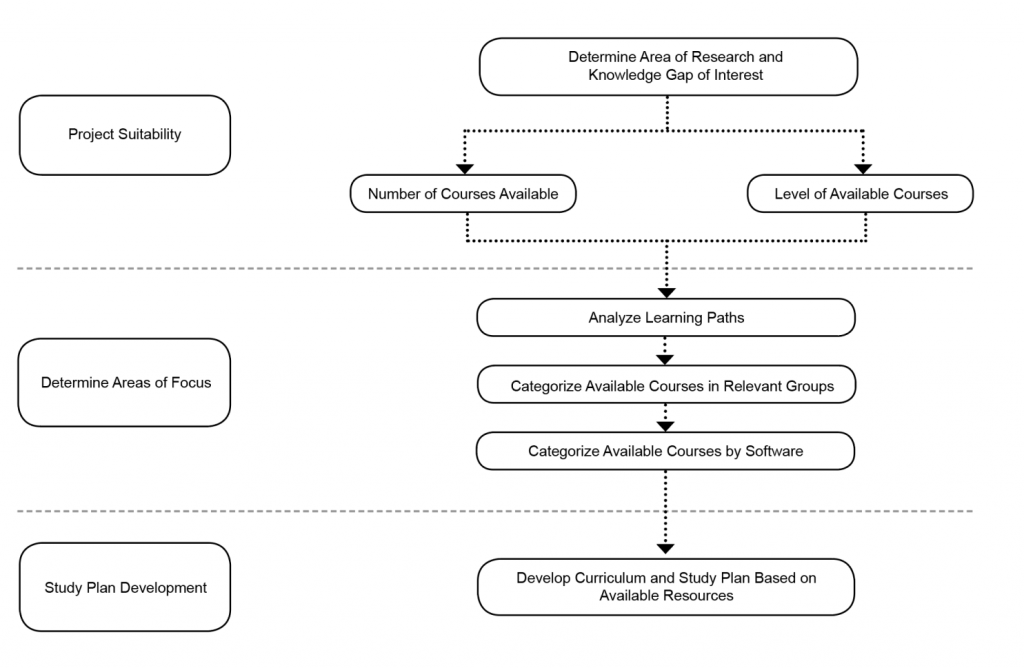
The framework proposed for student-led independent study planning using LinkedIn Learning resources can be divided in to the three stages of determining project suitability, determining area of focus, and development of study plan.
1. Determine Project Suitability
1.1 Research area of interest and breakdown of specific topics related to that field.
1.2 Determine if number of resources available within LinkedIn Learning are adequate for the specific topic.
1.3 Match level of student with available number of courses in the desired levels.
2. Determine Area of Focus
2.1 Analyze the existing learning paths within LinkedIn Learning regarding the desired topic.
2.2 Categorize available courses in the desired topic under relevant groups of topics.
2.3 Determine the software building aspects of topic.
2.4 Determine number of courses available per software program.
3. Development of Study Plan
3.1 Develop a study plan of the different topics determined.
3.2 Determine the software skills to focus on.
3.3 Create playlists of general topics and skill building courses to follow.
3.4 Schedule and fit five hours of online course time per week for the duration of the study.
Course Example 1: Construction Industry
Building Information Modeling (BIM) is highlighted as one of the growing trends in the Architecture and Construction industries, with 88% of construction stakeholders believing that BIM is powerful in delivering improved design and construction results (Davidson, 2018). The highly collaborative system has impacted various aspects of the construction industry, ranging from the design and engineering process to construction implementation and management. Therefore, it is increasingly important to be adept in software, workflows, methodologies, and management strategies as related to BIM.
Sheida Shahi’s post-graduate research focuses on construction management and specifically on the quantified analysis of various adaptive reuse strategies in the residential context. In order to gather required data, 5D BIM models for various simulation software are required. This includes a 3D dimensional model information, scheduling, and cost information for a comparative study. In order to complete aspects of the research project, it was important to identify resources to assist with knowledge building in scripting, BIM management and construction management. While Sheida is experienced with BIM software for architectural applications, a knowledge gap was identified in modelling accurate engineering-based aspects. Topics of interest included advancements in BIM technology and using adjacent and supplementary software to undertake various engineering simulations. Revit, as the most prominent BIM software in the North American industry, was chosen as the basis of investigation. LinkedIn Learning was used as a resource to advance specific software skills. Other topics of interest included incorporating BIM for construction management, including scheduling and cost-related items not typical in an architectural practice.
In order to determine project suitability, the resources available for BIM on LinkedIn Learning were identified (Figure 7.2). A total of six Learning Paths, 193 courses, and 298 Videos were identified as relating to BIM.
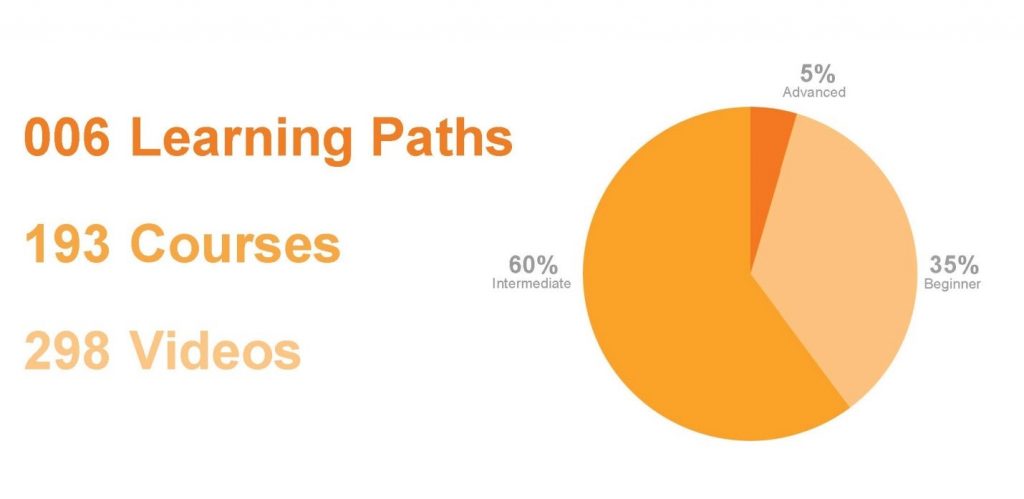
Within these videos, skill level was oriented to the body of resources available, including beginner, intermediate, and advanced. It was anticipated that mainly the advanced videos (5%) and some of the intermediate ones (60%) would be helpful for this investigation.
For determining feasible areas of focus, the learning paths were identified and the available courses were further categorized and organized by software. The learning paths for BIM identified by LinkedIn Learning were referenced (Figure 7.3). The largest number of courses was clustered in “BIM Coordination,” which covers a number of BIM management courses. The learning paths that were most relatable to the topics included “Architecture with Algorithmic Design” (six courses) and “Construction Management” (10 courses).
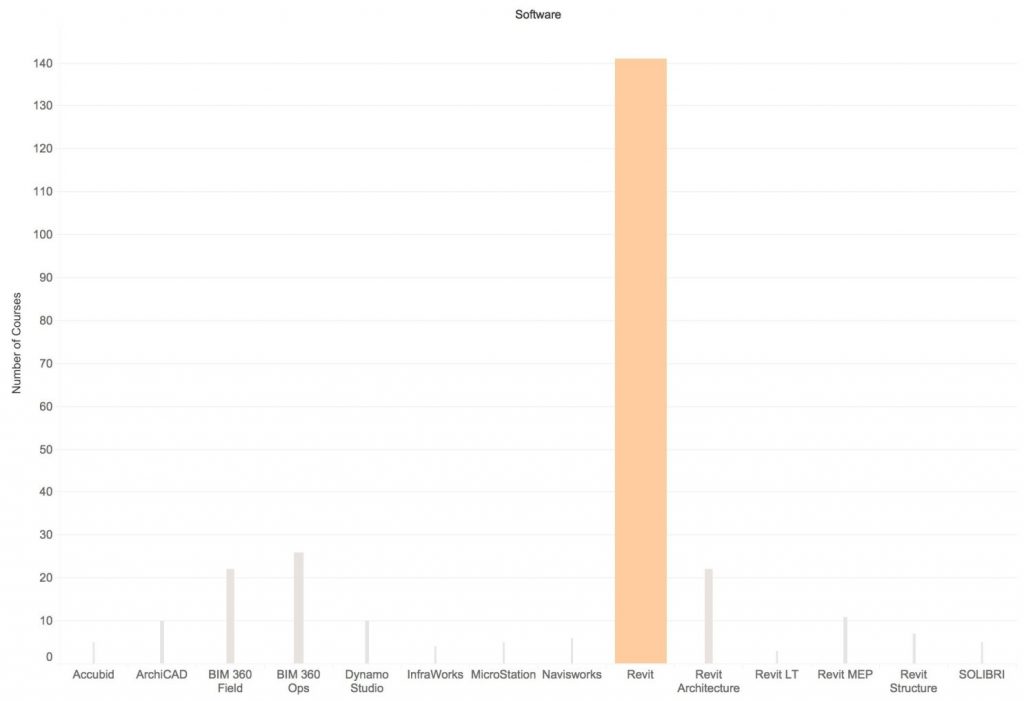
The construction management learning path was mainly used as a starting point for compiling an outline and courses from the algorithmic design. The courses related to software skill building were identified and categorized according to their relevance to the software. It was apparent that most of the courses in LinkedIn Learning were either relevant to or directly involved Revit, the software under consideration; therefore, it would be helpful to use LinkedIn Learning as a resource for this study (Figure 7.4).
From the 193 courses relating to BIM on LinkedIn Learning, only 48 courses are categorized in the six identified learning paths. Therefore, a thorough study of all courses led to the categorization of all courses in five streams that would be helpful for the individual study: (1) BIM Essential Training; (2) Supplementary Skills, (3) Construction Management with BIM, (4) Scripting with BIM, and (5) BIM Management (Figure 7.5). Essential BIM training included courses relating to software skill building and essential concepts of BIM.
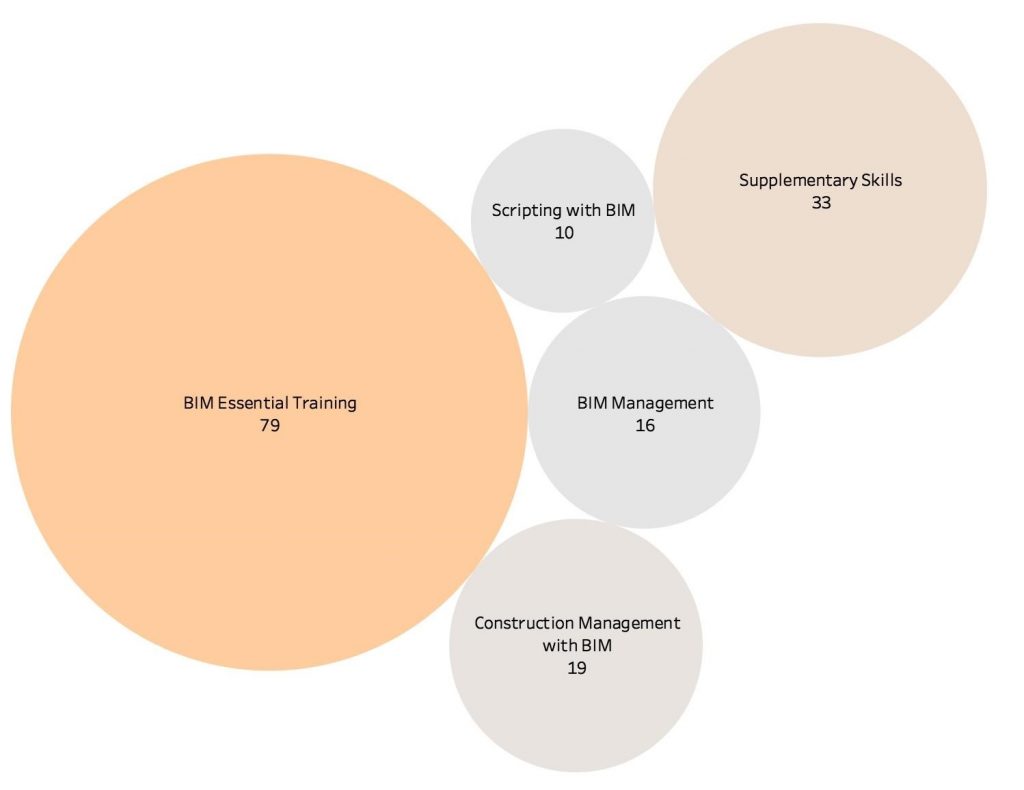
The supplementary skills category included courses that provided resources for supplementary skills related to BIM, including software and techniques for improving workflow and specialization software. As BIM supports collaborative methodologies, a range of open-source and specialty plug-ins are available, some of which are covered in this category. The construction management category includes courses that highlight the role of BIM in the construction management industry, including techniques and relevant software. Scripting within BIM is highlighted in a number of courses for the introduction of scripting within BIM, in order to customize and further develop existing courses. The BIM management category included the courses that address general project management and collaborative working strategies to improve BIM workflow. Lastly, the study plan was developed based on the results of the analysis.
Course Example 2: Data Science
A study done through job listings in various job searching sites found that data visualization is in high demand, with about 30% of data engineering job postings requiring Data Visualization as a core skill (Hale, 2018). LinkedIn Learning’s focus on Tableau as a major data visualization platform (Figure 7.9) is in line with the industry, as Tableau is the most requested data visualization software on job listings in 2018 (Hale, 2018). The field of Data Science has been advancing at a rapid pace, with the demand for Data Scientists in the industry projected to increase by 28% by 2020 (Columbus, 2017). Since the market demand for this skill is rising, the applications in academic studies and research are becoming ubiquitous. When large amounts of data are generated in any typical research project, being able to process and visualize the data is of paramount importance.
The following section will focus on Moien Giashi’s use of LinkedIn Learning for understanding the different resources available for data science and will outline his use of LinkedIn Learning. This includes use for curriculum development and as a reference tool for independent studies of data visualization. Moien’s approach follows a similar framework structure demonstrated in the previous example.
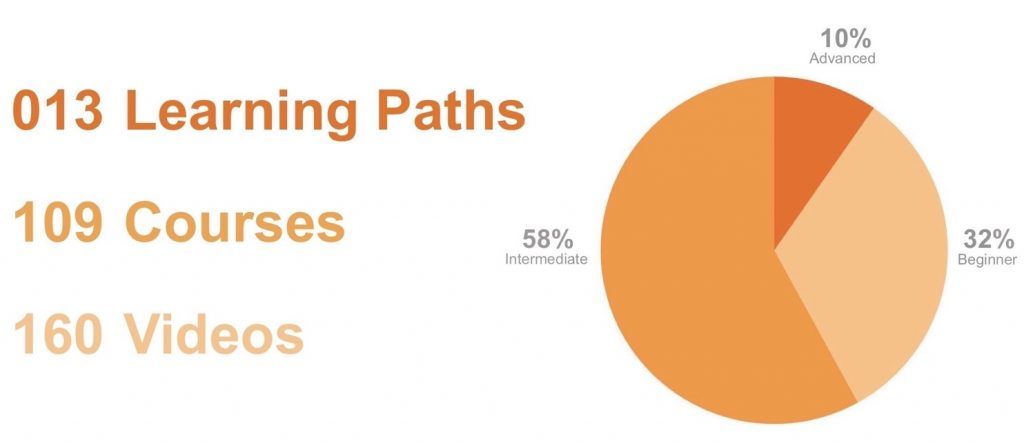
In order to determine project suitability, the resources available for Data Science on LinkedIn Learning were identified (Figure 7.6). A total of 13 learning paths, 109 courses, and 160 videos were available on the general topic. Data science topics in LinkedIn Learning are structured to provide a substantial amount of introductory content for a beginner in a topic (32%), with the majority of the content focused on skill building at the intermediate level (58%) and about 10% of content focused on specialty and advanced topics.
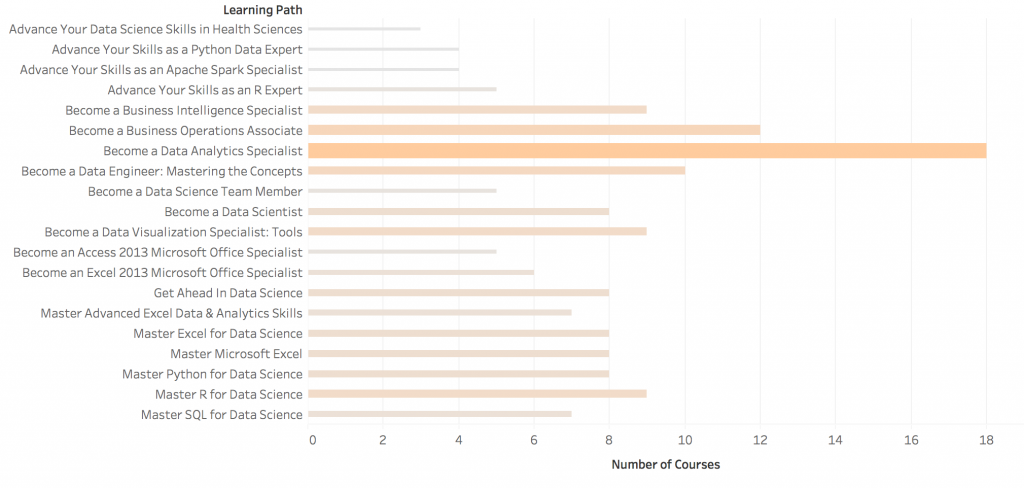
The large number of beginner and intermediate courses was suitable for an introductory course. Next, in order to determine areas of focus, the learning paths relating to data science were identified and analyzed. While most of the learning paths focused on data analytics and business (Figure 7.7), a learning path on data visualization was identified and used as a starting point.
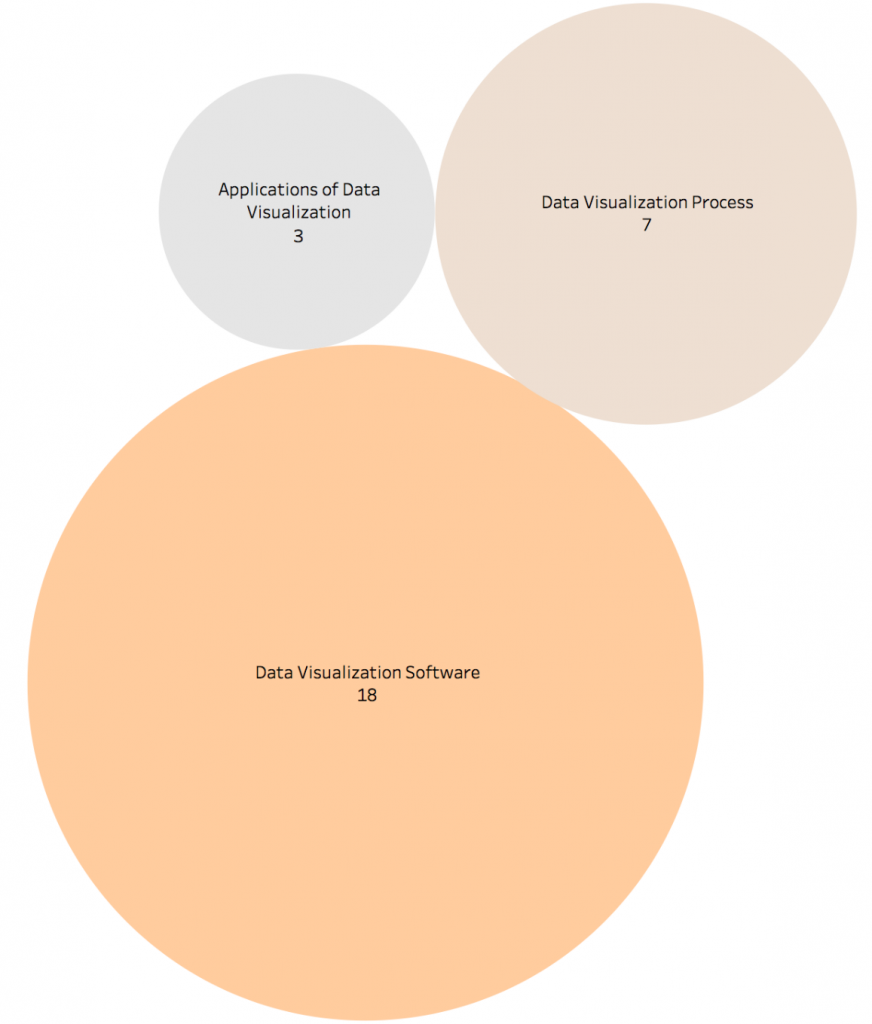
Though nine courses have been identified by LinkedIn Learning’s Learning Paths as relating to Data Visualization, there are 28 different courses that focus on the different aspects of learning about data visualization. The available courses were organized in the following groups: learning data visualization software, understanding the data visualization process, and learning about the applications of data visualization. Courses related to data visualization were broken down to the three categories: data visualization software (18), data process visualization (seven courses), and application of data visualization (three courses).
Moien Giashi’s study plan for learning data visualization was therefore based on the three identified categories. Starting with the data visualization process topics, the courses were used as introductory material for learning about background information, overview of concepts, and general introduction into working methodologies. In the second stage, Moien focused on specific software skills. All the relevant courses were surveyed and different data visualization software was identified (Figure 7.9).
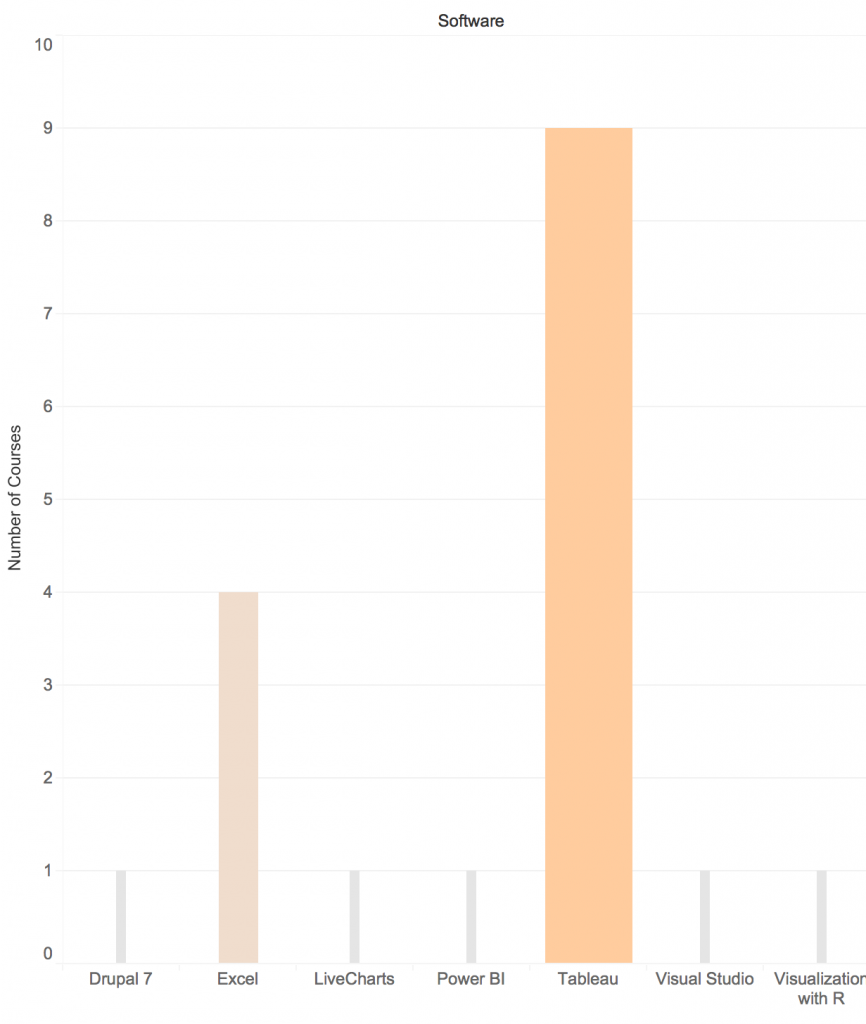
The courses available for each software category relating to data visualization throughout LinkedIn Learning were identified. While a range of software was introduced, the two major tools include Excel and Tableau, with Tableau having a greater number of available courses. Moien therefore decided to focus on learning Tableau as the main data visualization platform in his investigation and decided to use the Excel courses as reference to complement learning as required.
Pedagogical Considerations
The framework identified in this case was developed in order to facilitate and ensure efficient use of LinkedIn Learning’s resources in student-led independent studies. It can be used for examining, organizing, and using LinkedIn Learning’s resources on specific topics. The framework can be used to determine the suitability of a topic in relation to available resources, to determine feasible areas of focus as relating to a specific topic, and to develop a study plan for undertaking independent courses. The need for this tool arises from the breadth of topics and resources available in LinkedIn Learning while acknowledging the effort required to search for and collect resources effectively. In the experience of the authors, the development of the framework assisted in evaluation of topics and in expediting the process of study plan development, ensuring the quality of independent studies.
Facilitating student-led learning is important for post-graduate studies as it promotes reflection and critical thinking and increases motivation through empowerment. With an overall framework for making online resources more accessible, it is anticipated that students will be encouraged to undertake self-directed and independent courses in their studies. It was demonstrated in this case that the efficacy of student-directed courses can be increased with the accessible and coherent fundamental knowledge base offered by LinkedIn Learning. The increased accessibility can have direct benefits to individual research projects and can fill gaps in the lack of available specialty post-graduate courses.
It was demonstrated in this case that the structure of student-led courses, together with available LinkedIn Learning resources, can play a large part in the improving quality of student engagement. The large range of available topics makes it ideal for experimenting with new topics and supplementing existing professional and educational endeavours. The use of LinkedIn Learning in independent-study curriculum development assisted in making independent studies more accessible and improving the quality of the experience for independent students. It is anticipated that student-led studies can act as a test bed for generating new knowledge, leading to new curriculum development in universities. LinkedIn Learning’s extensive topics and well-versed resources are a reliable starting point for this endeavour.
Conclusion
There is a need to highlight the importance of independent research and individual learning. A large part of the independent research process is creating an individualized learning plan to manage the wealth of resources available through LinkedIn Learning. Through the authors’ experiences, it became clear that creating a comprehensive and coherent framework for assessing and accessing foundational knowledge allowed independent research and reading courses to become more accessible and manageable. The authors have created a framework for students partaking in an independent research or individual learning program that allows them to efficiently create a body of dependable and comprehensive foundational knowledge regardless of the subject matter. The authors found that the use of the framework made independent studies and research more inviting and accessible.
List of LinkedIn Learning Videos
Aubin, P. (2018, February 1). Dynamo: Practical [Video]. Retrieved from https://www.lynda.com/Dynamo-Studio-tutorials/Dynamo-Practical/677101-2.html?srchtrk=index%3a1%0alinktypeid%3a2%0aq%3aDynamo%3a+Practical%0apage%3a1%0as%3arelevance%0asa%3atrue%0aproducttypeid%3a2
Balliett, A. (2017, August 8). Data visualization: Best practices [Video]. Retrieved from https://www.lynda.com/Design-tutorials/Data-Visualization-Best-Practices/585239-2.html?srchtrk=index%3a1%0alinktypeid%3a2%0aq%3aData+Visualization%3a+Best+Practices%0apage%3a1%0as%3arelevance%0asa%3atrue%0aproducttypeid%3a2
Carney, W. (2018, October 22). Advanced Revit and Dynamo for interior design [Video]. Retrieved from https://www.lynda.com/Dynamo-tutorials/Advanced-Revit-Dynamo-Interior-Design/748573-2.html?srchtrk=index%3a1%0alinktypeid%3a2%0aq%3aAdvanced+Revit+and+Dynamo+for+Interior+Design%0apage%3a1%0as%3arelevance%0asa%3atrue%0aproducttypeid%3a2
Dutton, C. (2018, November 16). Excel data visualization Part 1: Mastering 20+ charts and graphs [Video]. Retrieved from https://www.lynda.com/Excel-tutorials/Excel-Data-Visualization-Part-1-Mastering-20-Charts-Graphs/791339-2.html?srchtrk=index%3a1%0alinktypeid%3a2%0aq%3aExcel+Data+Visualization+Part+1%3a+Mastering+20%2b+Charts+and+Graphs%0apage%3a1%0as%3arelevance%0asa%3atrue%0aproducttypeid%3a2
Dutton, C. (2018, November 19). Excel data visualization Part 2: Designing custom visualizations [Video]. Retrieved from https://www.lynda.com/Excel-tutorials/Excel-Data-Visualization-Part-2-Designing-Custom-Visualizations/791340-2.html?srchtrk=index%3a1%0alinktypeid%3a2%0aq%3aExcel+Data+Visualization+Part+2%3a+Designing+Custom+Visualizations%0apage%3a1%0as%3arelevance%0asa%3atrue%0aproducttypeid%3a2
Francis, M. (2017, April 21). Tableau 10 for data scientists [Video]. Retrieved from https://www.lynda.com/Tableau-tutorials/Tableau-10-Data-Scientists/476621-2.html?srchtrk=index%3a1%0alinktypeid%3a2%0aq%3aTableau+10+for+Data+Scientists%0apage%3a1%0as%3arelevance%0asa%3atrue%0aproducttypeid%3a2
Frye, C. (2017, April 18). Tableau 10: Mastering calculations [Video]. Retrieved from https://www.lynda.com/Tableau-tutorials/Tableau-10-Mastering-Calculations/585002-2.html?srchtrk=index%3a1%0alinktypeid%3a2%0aq%3aTableau+10%3a+Mastering+Calculations%0apage%3a1%0as%3arelevance%0asa%3atrue%0aproducttypeid%3a2
Frye, C. (2017, May 10). Tableau 10 essential training [Video]. Retrieved from https://www.lynda.com/Tableau-tutorials/Tableau-10-Essential-Training/500540-2.html?srchtrk=index%3a1%0alinktypeid%3a2%0aq%3aTableau+10+Essential+Training%0apage%3a1%0as%3arelevance%0asa%3atrue%0aproducttypeid%3a2
Frye, C. (2018, July 12). Tableau essential training [Video]. Retrieved from https://www.lynda.com/Tableau-tutorials/Tableau-Essential-Training/618727-2.html?srchtrk=index%3a1%0alinktypeid%3a2%0aq%3aTableau+Essential+Training%0apage%3a1%0as%3arelevance%0asa%3atrue%0aproducttypeid%3a2
Graham, J. (2018, November 7). Revit: Creating C# plugins [Video]. Retrieved from https://www.lynda.com/course-tutorials/Revit-Creating-C-Plugins/740363-2.html?srchtrk=index%3a1%0alinktypeid%3a2%0aq%3aRevit%3a+Creating+C%23+Plugins%0apage%3a1%0as%3arelevance%0asa%3atrue%0aproducttypeid%3a2
Graham, J. (2018, December 14). Dynamo for Revit: Python scripting [Video]. Retrieved from https://www.lynda.com/course-tutorials/Dynamo-Revit-Python-Scripting-REVISION/779745-2.html?srchtrk=index%3a1%0alinktypeid%3a2%0aq%3aDynamo+for+Revit%3a+Python+Scripting%0apage%3a1%0as%3arelevance%0asa%3atrue%0aproducttypeid%3a2
Makdad, N. (2016, December 2). Creating interactive dashboards in Tableau 10 [Video]. Retrieved from https://www.lynda.com/Tableau-tutorials/Creating-Interactive-Dashboards-Tableau-10/518172-2.html?srchtrk=index%3a1%0alinktypeid%3a2%0aq%3aCreating+Interactive+Dashboards+in+Tableau+10+%0apage%3a1%0as%3arelevance%0asa%3atrue%0aproducttypeid%3a2
McCrone, C. (2017, June 20). Paneling with dynamo for Revit [Video]. Retrieved from https://www.lynda.com/Dynamo-Studio-tutorials/Paneling-Dynamo-Revit/587599-2.html?srchtrk=index%3a1%0alinktypeid%3a2%0aq%3aPaneling+with+Dynamo+for+Revit%0apage%3a1%0as%3arelevance%0asa%3atrue%0aproducttypeid%3a2
Modglin, J. (2017, March 10). Learning AutoLISP and Visual LISP [Video]. Retrieved from https://www.lynda.com/AutoCAD-tutorials/Learn-AutoLISP-Visual-LISP/542374-2.html?srchtrk=index%3a1%0alinktypeid%3a2%0aq%3aLearning+AutoLISP+%26+Visual+LISP%0apage%3a1%0as%3arelevance%0asa%3atrue%0aproducttypeid%3a2
Poulson, B. (2013, 22 April). Creating projects for interactive data visualization [Video]. Retrieved from https://www.lynda.com/Processing-tutorials/Projects-Interactive-Data-Visualization-Processing/116952-2.html?srchtrk=index%3a1%0alinktypeid%3a2%0aq%3aCreating+Projects+for+Interactive+Data+Visualization%0apage%3a1%0as%3arelevance%0asa%3atrue%0aproducttypeid%3a2
Shander, B. (2015, March 26). Designing a data visualization [Video]. Retrieved from https://www.lynda.com/Illustrator-tutorials/Designing-Data-Visualization/175720-2.html?srchtrk=index%3a1%0alinktypeid%3a2%0aq%3aDesigning+a+Data+Visualization%0apage%3a1%0as%3arelevance%0asa%3atrue%0aproducttypeid%3a2
Shander, B. (2016, August 31). Data visualization: Storytelling [Video]. Retrieved from https://www.lynda.com/Excel-tutorials/Data-Visualization-Storytelling-Essentials/435230-2.html?srchtrk=index%3a1%0alinktypeid%3a2%0aq%3aData+Visualization%3a+Storytelling%0apage%3a1%0as%3arelevance%0asa%3atrue%0aproducttypeid%3a2
Siegel, I. (2016, November 7). Dynamo: Revit workflow [Video]. Retrieved from https://www.lynda.com/Revit-tutorials/Dynamo-Revit-Workflow/494383-2.html?srchtrk=index%3a1%0alinktypeid%3a2%0aq%3aDynamo%3a+Revit+Workflow%0apage%3a1%0as%3arelevance%0asa%3atrue%0aproducttypeid%3a2
Siegel, I. (2017, June 30). Dynamo for Revit project setup [Video]. Retrieved from https://www.lynda.com/Dynamo-Studio-tutorials/Dynamo-Revit-Project-Setup/586670-2.html?srchtrk=index%3a1%0alinktypeid%3a2%0aq%3aDynamo+for+Revit+Project+Setup%0apage%3a1%0as%3arelevance%0asa%3atrue%0aproducttypeid%3a2
Siegel, I. (2017, September 26). Dynamo 1.x essential training [Video]. Retrieved from https://www.lynda.com/Revit-tutorials/Dynamo-Essential-Training/455724-2.html?srchtrk=index%3a2%0alinktypeid%3a2%0aq%3aDynamo+Essential+Training%0apage%3a1%0as%3arelevance%0asa%3atrue%0aproducttypeid%3a2
von Courter, G. (2018, September 5). Power BI essential training [Video]. Retrieved from https://www.lynda.com/Power-BI-tutorials/Power-BI-Essential-Training/688534-2.html?srchtrk=index%3a1%0alinktypeid%3a2%0aq%3aPower+BI+Essential+Training%0apage%3a1%0as%3arelevance%0asa%3atrue%0aproducttypeid%3a2
References
Bencze, J.L., & Sperling, E.R. (2012). Student teachers as advocates for student-led research-informed socioscientific activism. Canadian Journal of Science, Mathematics and Technology Education, 12(1), 62-85.
Chen, C. (2018, January 4), Online learning may be the future of education — We compared 4 platforms that are leading the way. Business Insider. Retrieved from https://www.businessinsider.com/online-learning-platform-comparison-udemy-skillshare-lynda-courserahttps://www.businessinsider.com/online-learning-platform-comparison-udemy-skillshare-lynda-coursera
Columbus, L. (2017, May 13). IBM predicts demand for data scientists will soar 28% by 2020. Forbes. Retrieved from https://www.forbes.com/sites/louiscolumbus/2017/05/13/ibm-predicts-demand-for-data-scientists-will-soar-28-by-2020/#19869abf7e3b
Davidson, P. (2018, October 2). Top 10 construction technology trends for 2019. GenieBelt. Retrieved from https://geniebelt.com/blog/top-10-construction-technology-trends-for-2019
Hale, J. (2018, October 12). The most in demand skills for data scientists. Towards Data Science. Retrieved from https://towardsdatascience.com/the-most-in-demand-skills-for-data-scientists-4a4a8db896db
Ho, M., Shahi, S., O, C., & Beesley, P. (2013). F_RMlab: Peer to peer learning for emerging computational design. 7th International Conference of the Association of Architecture Schools of Australasia, National Library of Australia, Melbourne, 2013 Oct 3-5, pp. 198-211.
Marvell, A., Simm, D., Schaaf, R., & Harper, R. (2013). Students as scholars: Evaluating student-led learning and teaching during fieldwork. Journal of Geography in Higher Education, 37(4), 547-566.
O’Grady, C., Shahi, S., & Przybylski, M. (2014). Association of Collegiate Schools of Architecture Fall 2014 Conference. ACSA Press, Halifax, NS, 2014 Oct 16-18, p. 637-648.
Oproiu, G.C. (2015). A study about using e-learning platform (Moodle) in university teaching process. Procedia — Social and Behavioral Sciences, 180, 426-432.
Rickard, W. (2010). The efficacy (and inevitability) of online learning in higher education (White paper). Pearson Learning Solutions. Retrieved from www.pearsonlearningsolutions.com/.
Samuels, O. (n.d.). An in-depth guide to choosing the best online learning sites. Doist. Retrieved from https://doist.com/blog/guide-to-online-learning-sites/https://doist.com/blog/guide-to-online-learning-sites/
University of Toronto. (2017). Independent Research Courses. Retrieved from http://sociology.utoronto.ca/st-george-campus/courses-3/independent-research-course/
Walkington, H., Hill, J., & Kneale, P.E. (2017). Reciprocal elucidation: A student-led pedagogy in multidisciplinary undergraduate research conferences. Higher Education Research & Development, 36(2), 416-429.
Yagil, A. (2018, March 29). Udemy vs Coursera vs Lynda — The ultimate comparison. Medium. Retrieved from https://medium.com/@adiyagil/udemy-vs-coursera-vs-lynda-the-ultimate-comparison-70586665dca5https://medium.com/@adiyagil/udemy-vs-coursera-vs-lynda-the-ultimate-comparison-70586665dca5
