Chapter 4.5: Geometric Distribution
There are three main characteristics of a geometric experiment.
- There are one or more Bernoulli trials with all failures except the last one, which is a success. In other words, you keep repeating what you are doing until the first success. Then you stop. For example, you throw a dart at a bullseye until you hit the bullseye. The first time you hit the bullseye is a “success” so you stop throwing the dart. It might take six tries until you hit the bullseye. You can think of the trials as failure, failure, failure, failure, failure, success, STOP.
- In theory, the number of trials could go on forever. There must be at least one trial.
- The probability, p, of a success and the probability, q, of a failure is the same for each trial. p + q = 1 and q = 1 − p. For example, the probability of rolling a three when you throw one fair die is
 . This is true no matter how many times you roll the die. Suppose you want to know the probability of getting the first three on the fifth roll. On rolls one through four, you do not get a face with a three. The probability for each of the rolls is q =
  , the probability of a failure. The probability of getting a three on the fifth roll is
  = 0.0804
X = the number of independent trials until the first success.
You play a game of chance that you can either win or lose (there are no other possibilities) until you lose. Your probability of losing is p = 0.57. What is the probability that it takes five games until you lose? Let X = the number of games you play until you lose (includes the losing game). Then X takes on the values 1, 2, 3, … (could go on indefinitely). The probability question is P(x = 5).
You throw darts at a board until you hit the center area. Your probability of hitting the center area is p = 0.17. You want to find the probability that it takes eight throws until you hit the center. What values does X take on?
A safety engineer feels that 35% of all industrial accidents in her plant are caused by failure of employees to follow instructions. She decides to look at the accident reports (selected randomly and replaced in the pile after reading) until she finds one that shows an accident caused by failure of employees to follow instructions. On average, how many reports would the safety engineer expect to look at until she finds a report showing an accident caused by employee failure to follow instructions? What is the probability that the safety engineer will have to examine at least three reports until she finds a report showing an accident caused by employee failure to follow instructions?
Let X = the number of accidents the safety engineer must examine until she finds a report showing an accident caused by employee failure to follow instructions. X takes on the values 1, 2, 3, …. The first question asks you to find the expected value or the mean. The second question asks you to find P(x ≥ 3). (“At least” translates to a “greater than or equal to” symbol).
An instructor feels that 15% of students get below a C on their final exam. She decides to look at final exams (selected randomly and replaced in the pile after reading) until she finds one that shows a grade below a C. We want to know the probability that the instructor will have to examine at least ten exams until she finds one with a grade below a C. What is the probability question stated mathematically?
Suppose that you are looking for a student at your college who lives within five miles of you. You know that 55% of the 25,000 students do live within five miles of you. You randomly contact students from the college until one says he or she lives within five miles of you. What is the probability that you need to contact four people?
This is a geometric problem because you may have a number of failures before you have the one success you desire. Also, the probability of a success stays the same each time you ask a student if he or she lives within five miles of you. There is no definite number of trials (number of times you ask a student).
a. Let X = the number of ____________ you must ask ____________ one says yes.
a. Let X = the number of students you must ask until one says yes.
b. What values does X take on?
b. 1, 2, 3, …, (total number of students)
c. What are p and q?
c. p = 0.55; q = 0.45
d. The probability question is P(_______).
d. P(x = 4)
You need to find a store that carries a special printer ink. You know that of the stores that carry printer ink, 10% of them carry the special ink. You randomly call each store until one has the ink you need. What are p and q?
Notation for the Geometric: G = Geometric Probability Distribution Function
X ~ G(p)
Read this as “X is a random variable with a geometric distribution.” The parameter is p; p = the probability of a success for each trial.
Assume that the probability of a defective computer component is 0.02. Components are randomly selected. Find the probability that the first defect is caused by the seventh component tested. How many components do you expect to test until one is found to be defective?
Let X = the number of computer components tested until the first defect is found.
X takes on the values 1, 2, 3, … where p = 0.02. X ~ G(0.02)
Find P(x = 7). P(x = 7) = 0.0177.
To find the probability that x = 7,
- Enter 2nd, DISTR
- Scroll down and select geometpdf(
- Press ENTER
- Enter 0.02, 7); press ENTER to see the result: P(x = 7) = 0.0177
To find the probability that x ≤ 7, follow the same instructions EXCEPT select E:geometcdf(as the distribution function.
The probability that the seventh component is the first defect is 0.0177.
The graph of X ~ G(0.02) is:
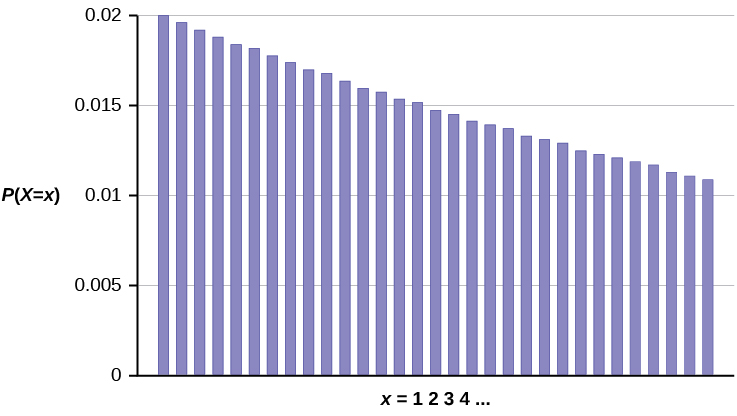
The y-axis contains the probability of x, where X = the number of computer components tested.
The number of components that you would expect to test until you find the first defective one is the mean,  .
.
The formula for the mean is μ =  =
=  = 50
= 50
The formula for the variance is σ2 =  =
=  = 2,450
The standard deviation is σ =  =
=  = 49.5
The probability of a defective steel rod is 0.01. Steel rods are selected at random. Find the probability that the first defect occurs on the ninth steel rod. Use the TI-83+ or TI-84 calculator to find the answer.
The lifetime risk of developing pancreatic cancer is about one in 78 (1.28%). Let X = the number of people you ask until one says he or she has pancreatic cancer. Then X is a discrete random variable with a geometric distribution: X ~ G or X ~ G(0.0128).
- What is the probability of that you ask ten people before one says he or she has pancreatic cancer?
- What is the probability that you must ask 20 people?
- Find the (i) mean and (ii) standard deviation of X.
- P(x = 10) = geometpdf(0.0128, 10) = 0.0114
- P(x = 20) = geometpdf(0.0128, 20) = 0.01
-
- Mean = μ = =
 = 78
= 78 - Standard Deviation = σ =
 =
=  ≈ 77.6234
- Mean = μ =
The literacy rate for a nation measures the proportion of people age 15 and over who can read and write. The literacy rate for women in Afghanistan is 12%. Let X = the number of Afghani women you ask until one says that she is literate.
- What is the probability distribution of X?
- What is the probability that you ask five women before one says she is literate?
- What is the probability that you must ask ten women?
- Find the (i) mean and (ii) standard deviation of X.
References
“Millennials: A Portrait of Generation Next,” PewResearchCenter. Available online at http://www.pewsocialtrends.org/files/2010/10/millennials-confident-connected-open-to-change.pdf (accessed May 15, 2013).
“Millennials: Confident. Connected. Open to Change.” Executive Summary by PewResearch Social & Demographic Trends, 2013. Available online at http://www.pewsocialtrends.org/2010/02/24/millennials-confident-connected-open-to-change/ (accessed May 15, 2013).
“Prevalence of HIV, total (% of populations ages 15-49),” The World Bank, 2013. Available online at http://data.worldbank.org/indicator/SH.DYN.AIDS.ZS?order=wbapi_data_value_2011+wbapi_data_value+wbapi_data_value-last&sort=desc (accessed May 15, 2013).
Pryor, John H., Linda DeAngelo, Laura Palucki Blake, Sylvia Hurtado, Serge Tran. The American Freshman: National Norms Fall 2011. Los Angeles: Cooperative Institutional Research Program at the Higher Education Research Institute at UCLA, 2011. Also available online at http://heri.ucla.edu/PDFs/pubs/TFS/Norms/Monographs/TheAmericanFreshman2011.pdf (accessed May 15, 2013).
“Summary of the National Risk and Vulnerability Assessment 2007/8: A profile of Afghanistan,” The European Union and ICON-Institute. Available online at http://ec.europa.eu/europeaid/where/asia/documents/afgh_brochure_summary_en.pdf (accessed May 15, 2013).
“The World FactBook,” Central Intelligence Agency. Available online at https://www.cia.gov/library/publications/the-world-factbook/geos/af.html (accessed May 15, 2013).
“UNICEF reports on Female Literacy Centers in Afghanistan established to teach women and girls basic resading [sic] and writing skills,” UNICEF Television. Video available online at http://www.unicefusa.org/assets/video/afghan-female-literacy-centers.html (accessed May 15, 2013).
Chapter Review
There are three characteristics of a geometric experiment:
- There are one or more Bernoulli trials with all failures except the last one, which is a success.
- In theory, the number of trials could go on forever. There must be at least one trial.
- The probability, p, of a success and the probability, q, of a failure are the same for each trial.
In a geometric experiment, define the discrete random variable X as the number of independent trials until the first success. We say that X has a geometric distribution and write X ~ G(p) where p is the probability of success in a single trial.
The mean of the geometric distribution X ~ G(p) is μ = and the standard deviation is  =
=  .
.
Formula Review
X ~ G(p) means that the discrete random variable X has a geometric probability distribution with probability of success in a single trial p.
X = the number of independent trials until the first success
X takes on the values x = 1, 2, 3, …
p = the probability of a success for any trial
q = the probability of a failure for any trial p + q = 1
q = 1 – p
The mean is μ = .
The standard deviation is σ =  = .
= .
Use the following information to answer the next six exercises: The Higher Education Research Institute at UCLA collected data from 203,967 incoming first-time, full-time freshmen from 270 four-year colleges and universities in the U.S. 71.3% of those students replied that, yes, they believe that same-sex couples should have the right to legal marital status. Suppose that you randomly select freshman from the study until you find one who replies “yes.” You are interested in the number of freshmen you must ask.
In words, define the random variable X.
X = the number of freshmen selected from the study until one replied “yes” that same-sex couples should have the right to legal marital status.
X ~ _____(_____,_____)
solution G(0.713) –>
What values does the random variable X take on?
1,2,…
Construct the probability distribution function (PDF). Stop at x = 6.
| x | P(x) |
|---|---|
| 1 | |
| 2 | |
| 3 | |
| 4 | |
| 5 | |
| 6 |
solution
–>
On average (μ), how many freshmen would you expect to have to ask until you found one who replies “yes?”
1.4
What is the probability that you will need to ask fewer than three freshmen?
solution 0.9176 –>
HOMEWORK
A consumer looking to buy a used red Miata car will call dealerships until she finds a dealership that carries the car. She estimates the probability that any independent dealership will have the car will be 28%. We are interested in the number of dealerships she must call.
- In words, define the random variable X.
- List the values that X may take on.
- Give the distribution of X. X ~ _____(_____,_____)
- On average, how many dealerships would we expect her to have to call until she finds one that has the car?
- Find the probability that she must call at most four dealerships.
- Find the probability that she must call three or four dealerships.
solution X = the number of dealers she calls until she finds one with a used red Miata. 1, 2, 3,… X ~ G(0.28) 3.57 0.7313 0.2497 –>
Suppose that the probability that an adult in America will watch the Super Bowl is 40%. Each person is considered independent. We are interested in the number of adults in America we must survey until we find one who will watch the Super Bowl.
- In words, define the random variable X.
- List the values that X may take on.
- Give the distribution of X. X ~ _____(_____,_____)
- How many adults in America do you expect to survey until you find one who will watch the Super Bowl?
- Find the probability that you must ask seven people.
- Find the probability that you must ask three or four people.
- X = the number of adults in America who are surveyed until one says he or she will watch the Super Bowl.
- X ~ G(0.40)
- 2.5
- 0.0187
- 0.2304
It has been estimated that only about 30% of California residents have adequate earthquake supplies. Suppose we are interested in the number of California residents we must survey until we find a resident who does not have adequate earthquake supplies.
- In words, define the random variable X.
- List the values that X may take on.
- Give the distribution of X. X ~ _____(_____,_____)
- What is the probability that we must survey just one or two residents until we find a California resident who does not have adequate earthquake supplies?
- What is the probability that we must survey at least three California residents until we find a California resident who does not have adequate earthquake supplies?
- How many California residents do you expect to need to survey until you find a California resident who does not have adequate earthquake supplies?
- How many California residents do you expect to need to survey until you find a California resident who does have adequate earthquake supplies?
In one of its Spring catalogs, L.L. Bean® advertised footwear on 29 of its 192 catalog pages. Suppose we randomly survey 20 pages. We are interested in the number of pages that advertise footwear. Each page may be picked more than once.
- In words, define the random variable X.
- List the values that X may take on.
- Give the distribution of X. X ~ _____(_____,_____)
- How many pages do you expect to advertise footwear on them?
- Is it probable that all twenty will advertise footwear on them? Why or why not?
- What is the probability that fewer than ten will advertise footwear on them?
- Reminder: A page may be picked more than once. We are interested in the number of pages that we must randomly survey until we find one that has footwear advertised on it. Define the random variable X and give its distribution.
- What is the probability that you only need to survey at most three pages in order to find one that advertises footwear on it?
- How many pages do you expect to need to survey in order to find one that advertises footwear?
- X = the number of pages that advertise footwear
- X takes on the values 0, 1, 2, …, 20
- X ~ B(20,
 )
) - 3.02
- No
- 0.9997
- X = the number of pages we must survey until we find one that advertises footwear. X ~ G()
- 0.3881
- 6.6207 pages
Suppose that you are performing the probability experiment of rolling one fair six-sided die. Let F be the event of rolling a four or a five. You are interested in how many times you need to roll the die in order to obtain the first four or five as the outcome.
- p = probability of success (event F occurs)
- q = probability of failure (event F does not occur)
- Write the description of the random variable X.
- What are the values that X can take on?
- Find the values of p and q.
- Find the probability that the first occurrence of event F (rolling a four or five) is on the second trial.
solution X = the number of times you need to roll the die in order to get the face four or five. X can take on the values 1, 2, 3, and so on. p = 2 6 and q = 4 6 0.2222 –>
Ellen has music practice three days a week. She practices for all of the three days 85% of the time, two days 8% of the time, one day 4% of the time, and no days 3% of the time. One week is selected at random. What values does X take on?
0, 1, 2, and 3
The World Bank records the prevalence of HIV in countries around the world. According to their data, “Prevalence of HIV refers to the percentage of people ages 15 to 49 who are infected with HIV.”1 In South Africa, the prevalence of HIV is 17.3%. Let X = the number of people you test until you find a person infected with HIV.
- Sketch a graph of the distribution of the discrete random variable X.
- What is the probability that you must test 30 people to find one with HIV?
- What is the probability that you must ask ten people?
- Find the (i) mean and (ii) standard deviation of the distribution of X.
solution X ~ G(0.173)
P(x = 30) = geometpdf(0.173, 30) = 0.0007 P(x = 10) = geometpdf(0.173, 10) = 0.0313 Mean = μ = 1 p = 1 0.173 ≈ 5.7804 Standard Deviation = σ = 1−p p 2 = 1−0.173 0.173 2 = 5.2566 –>
According to a recent Pew Research poll, 75% of millenials (people born between 1981 and 1995) have a profile on a social networking site. Let X = the number of millenials you ask until you find a person without a profile on a social networking site.
- Describe the distribution of X.
- Find the (i) mean and (ii) standard deviation of X.
- What is the probability that you must ask ten people to find one person without a social networking site?
- What is the probability that you must ask 20 people to find one person without a social networking site?
- What is the probability that you must ask at most five people?
- X ~ G(0.25)
-
- Mean = μ = =
 = 4
= 4 - Standard Deviation = σ = =
 ≈ 3.4641
- Mean = μ =
- P(x = 10) = geometpdf(0.25, 10) = 0.0188
- P(x = 20) = geometpdf(0.25, 20) = 0.0011
- P(x ≤ 5) = geometcdf(0.25, 5) = 0.7627
Footnotes
- 1”Prevalence of HIV, total (% of populations ages 15-49),” The World Bank, 2013. Available online at http://data.worldbank.org/indicator/SH.DYN.AIDS.ZS?order=wbapi_data_value_2011+wbapi_data_value+wbapi_data_value-last&sort=desc (accessed May 15, 2013).
Glossary
- Geometric Distribution
- a discrete random variable (RV) that arises from the Bernoulli trials; the trials are repeated until the first success. The geometric variable X is defined as the number of trials until the first success. Notation: X ~ G(p). The mean is μ = and the standard deviation is σ = . The probability of exactly x failures before the first success is given by the formula: P(X = x) = p(1 – p)x – 1.
- Geometric Experiment
- a statistical experiment with the following properties:
- There are one or more Bernoulli trials with all failures except the last one, which is a success.
- In theory, the number of trials could go on forever. There must be at least one trial.
- The probability, p, of a success and the probability, q, of a failure do not change from trial to trial.
