Chapter 11: HR Analytics
The Power of HR Analytics for ACME Inc.
ACME Inc. has a problem, a big problem. It is losing employees at a rate of 18% per year. Benchmarks in their industry are at 9%. For the past few years, new government regulations have been making this industry more competitive and profits are on a steady decline. The CEO has identified curbing the high turnover rate as a primary objective for the HR department. The VP of Human Resources has hired a team of data analysts to look at the issue. The team performed advanced analysis on the anonymous corporate employee data integrated from several HR information systems. The dataset contains common and specific HR-oriented features for approximately 1,560 individual employees. Topics include demographics, satisfaction with the job and the company, absences, salary, and even travelling schedule. Importantly, for each individual record, there is information determining whether the corresponding employee left the company at the end of analyzed period. This information is used to identify key features connected to attrition. By identifying data patterns that can predict current employee behaviour in terms of attrition, the company can develop strategies to address the issue(s).
For the purpose of the case-study, the dataset was inspected and using the logistic regression method, two different questions were answered:
- Which specific factors increase or decrease the probability of attrition?
- Which individual employees across different jobs are at high risk of attrition?
Regarding the first question, advanced modelling techniques like neural networks were able to identify “drivers” that influence the target variable: risk of attrition.
Figure 11.1 Drivers of Employee Turnover

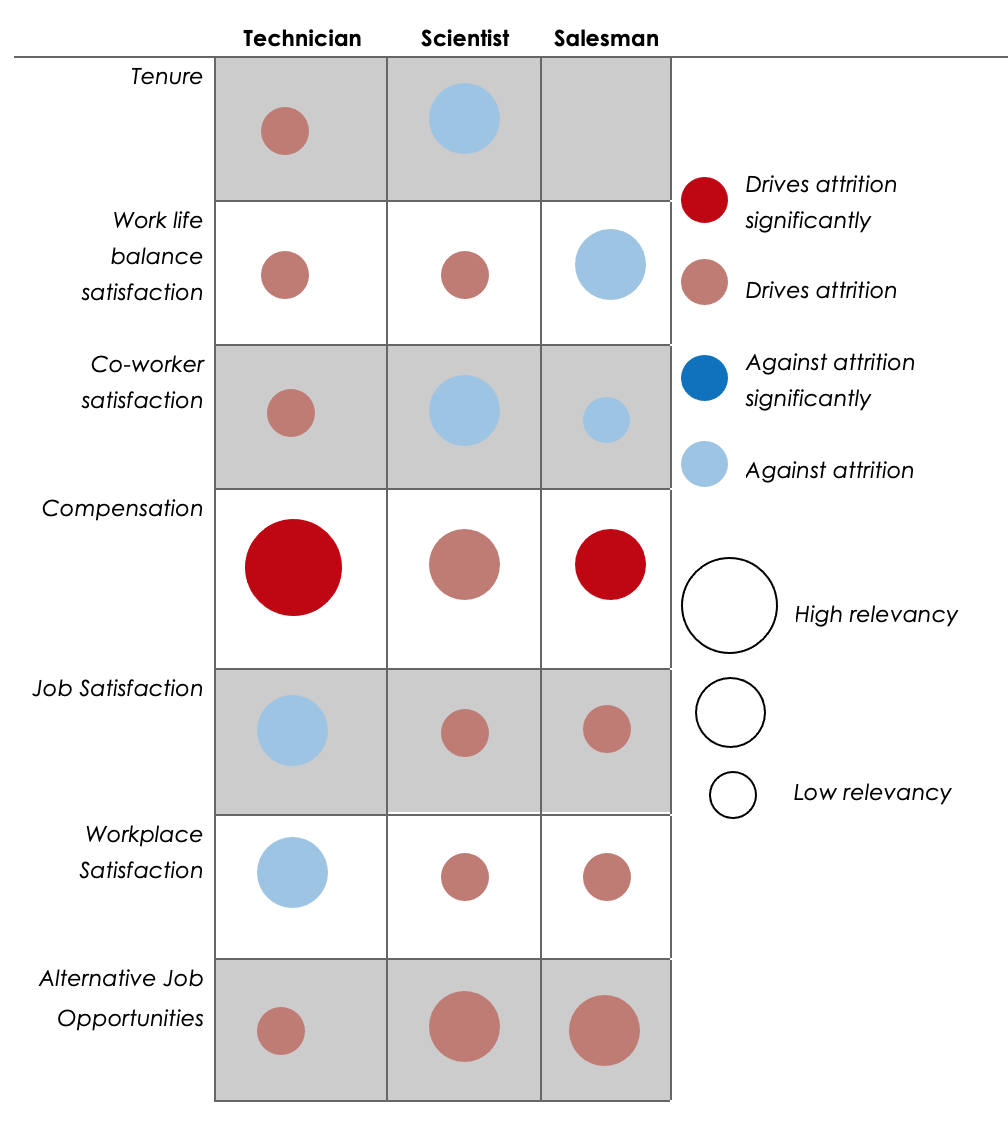
Figure 11.1 shows the most relevant factors influencing attrition. This kind of information provides seemingly straightforward insight. However, to deliver more thorough and usable conclusions, it is necessary to go a little deeper. One possible way to do that is to perform a separate analysis for different job types and roles. The next figure shows the importance of various factors for three different job categories: technician, scientist and salesman.
Figure 11.2 Factors of attribution for different job categories
In order to answer the second question -who are the employees most at risk of leaving, a prediction model was developed and applied. For validation purposes, one-third of the dataset was separated to test the model accuracy. The rest was used to train the model and perform previous analysis.
The newly-developed model is able to predict 88.9% of employees with “left-the-company” flags.
 Now equipped with this information, the VP of Human Resources is working at addressing the issues with a concrete and aggressive plan of action to curb turnover.
