5.6. Managing the Schedule
The Gantt Chart
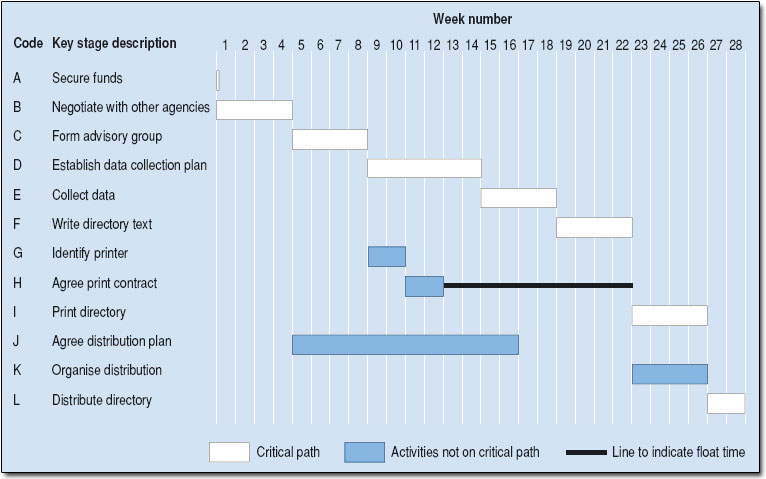
A Gantt chart is a type of bar chart, developed by Henry Gantt, that illustrates a project schedule. Gantt charts are easy to read and are commonly used to display scheduled activities. These charts display the start and finish dates of the terminal elements and summary elements of a project. Terminal elements and summary elements comprise the work breakdown structure of the project. Some Gantt charts also show the dependency relationships (i.e., precedence network) between activities.
Gantt charts show all the key stages of a project and their duration as a bar chart, with the time scale across the top. The key stages are placed on the bar chart in sequence, starting in the top left corner and ending in the bottom right corner (Figure 5.5). A Gantt chart can be drawn quickly and easily and is often the first tool a project manager uses to provide a rough estimate of the time that it will take to complete the key tasks. Sometimes it is useful to start with the target deadline for completion of the whole project because it is soon apparent if the time scale is too short or unnecessarily long. Thus, the detailed Gantt chart is usually constructed after the main objectives have been determined.
Network Diagram
Many project managers use network diagrams when scheduling a project. The network diagram is a way to visualize the interrelationships of project activities. Network diagrams provide a graphical view of the tasks and how they relate to one another. The tasks in the network are the work packages of the WBS. All of the WBS tasks must be included in the network because they have to be accounted for in the schedule. Leaving even one task out of the network could change the overall schedule duration, estimated costs, and resource allocation commitments.
The first step in creating a network diagram is to arrange the tasks from your WBS into a sequence. Some tasks can be accomplished at any time throughout the project whereas other tasks depend on input from another task or are constrained by time or resources.
The WBS is not a schedule, but it is the basis for one. The network diagram is a schedule but is used primarily to identify key scheduling information that ultimately goes into user-friendly schedule formats, such as milestone and Gantt charts.
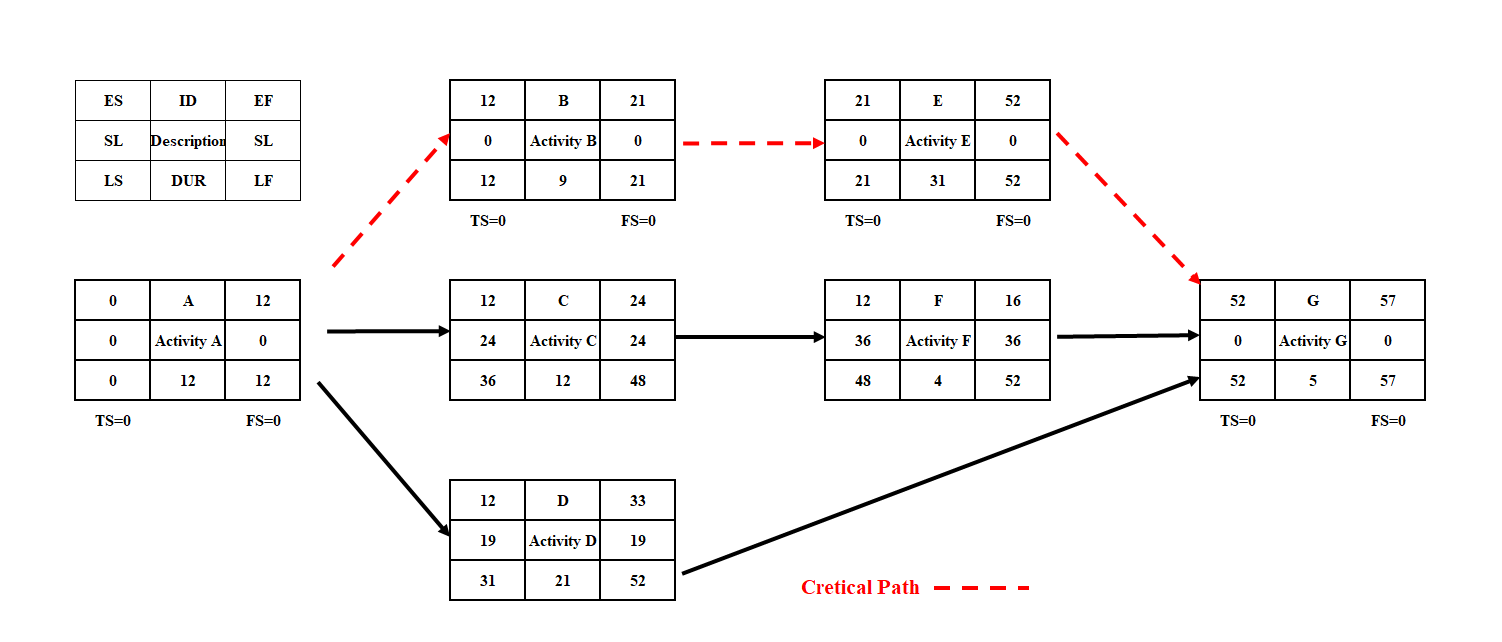
The network diagram provides important information to the project team. It provides information about how the tasks are related (Figure 5.6), where the risk points are in the schedule, how long it will take as currently planned to finish the project, and when each task needs to begin and end.
All network diagrams have the advantages of showing task interdependencies, start and end times, and the critical path (the longest path through the network) but the AOA network diagram has some disadvantages that limit the use of the method.
Forward and Backward Pass
Once a network diagram has been made and estimated activity durations have been assigned to each activity, the following attributes of each activity can be calculated:
- Early start time (ES)
- Late start time (LS)
- Early finish time (EF)
- Late finish time (LF)
- Slack or float (SL or FL)
These activity attributes are calculated using two processes: the forward pass and the backward pass.
Watch the video: Project Management Networks Part 2: Forward and Backward Pass to learn how to make these calculations.
Watch this Video: Project Management Networks Part 2: Forward and Backward Pass by Prof C [7:08] (Transcript Available).
The forward and backward passes are also used to fully calculate the critical path(s) in a project. Note: there can be instances where the start of an activity is on the critical path, but the finish is not on the critical path. This is unusual but can happen depending on the types of relationships that are involved.
The Critical Path
The critical path (dashed red line as seen in figure 5.6) describes the sequence of tasks that would enable the project to be completed in the shortest possible time. It is based on the idea that some tasks must be completed before others can begin. A critical path diagram is a useful tool for scheduling dependencies and controlling a project. In order to identify the critical path, the length of time that each task will take must be calculated.
Milestones
One way to avoid getting lost in a sea of details is to focus on your project’s milestones, which can serve as a high-level guide. You can use pull planning to identify your project’s milestones, and then use the critical path to figure out how to hit those milestones. It gives a reality test to whether your milestones are in fact achievable. Then you’re off and running, in living order.
In an excellent blog post on the usefulness of milestones, Elizabeth Harrin (2017) explains that milestones should be used “as a way of showing forward movement and progress and also show people what is going on, even if they don’t have a detailed knowledge of the tasks involved to get there. In that respect, they are very useful for stakeholder communication and setting expectations” (Harrin, 2017). You can use milestones, she explains, to track your progress, focus on:
- starting of significant phases of work
- ending of significant phases of work
- marking the deadline for something
- showing when an important decision is being made. (Harrin, 2017)
Milestones are especially useful as a form of communication on the health of a project. A version of a project schedule that consists only of milestones allows stakeholders to get a quick sense of where things stand. You may want to report on milestones in the project’s dashboard, which should serve as an at-a-glance update for the project.
“10. Project Schedule Planning” from Project Management – 2nd Edition by Adrienne Watt; Merrie Barron; and Andrew Barron is licensed under a Creative Commons Attribution-NonCommercial-ShareAlike 4.0 International License, except where otherwise noted.
