10.2. Quality in PM
It’s not enough to make sure you get a project done on time and under budget. You need to be sure you make the right product to suit your stakeholders’ needs. Quality means making sure that you build what you said you would and that you do it as efficiently as you can. And that means trying not to make too many mistakes and always keeping your project working toward the goal of creating the right product.
Everybody “knows” what quality is. However, the way the word is used in everyday life is a little different from how it is used in project management. Just like the triple constraint (scope, cost, and schedule), you manage the quality of a project by setting goals and taking measurements. That’s why you must understand the quality levels your stakeholders believe are acceptable, and ensure that your project meets those targets, just like it needs to meet their budget and schedule goals.
Customer satisfaction is about making sure that the people who are paying for the end product are happy with what they get. When the team gathers requirements for the specification, they try to write down all of the things that the customers want in the product so that they know how to make them happy. Some requirements can be left unstated. Those are the ones that are implied by the customer’s explicit needs. For example, some requirements are just common sense (e.g., a product that people hold can’t be made from toxic chemicals that may kill them). It might not be stated, but it’s definitely a requirement.
“Fitness to use” is about making sure that the product you build has the best design possible to fit the customer’s needs. Which would you choose: a product that is beautifully designed, well constructed, solidly built, and all-around pleasant to look at but does not do what you need or a product that does what you want despite being ugly and hard to use? You’ll always choose the product that fits your needs, even if it’s seriously limited. That’s why it’s important that the product both does what it is supposed to do and does it well. For example, you could pound in a nail with a screwdriver, but a hammer is a better fit for the job.
Conformance to requirements is the core of both customer satisfaction and fitness to use and is a measure of how well your product does what you intend. Above all, your product needs to do what you wrote down in your requirements document. Your requirements should take into account what will satisfy your customer and the best design possible for the job. That means conforming to both stated and implied requirements.
In the end, your product’s quality is judged by whether you built what you said you would build.
Quality planning focuses on taking all of the information available to you at the beginning of the project and figuring out how you will measure quality and prevent defects. Your company should have a quality policy that states how it measures quality across the organization. You should make sure your project follows the company policy and any government rules or regulations on how to plan quality for your project.
You need to plan which activities you will use to measure the quality of the project’s product. And you’ll need to think about the cost of all the quality-related activities you want to do. Then you’ll need to set some guidelines for what you will measure against. Finally, you’ll need to design the tests you will run when the product is ready to be tested.
Quality and Grade
According to the International Organization for Standardization (ISO), quality is “the degree to which a set of inherent characteristics fulfill requirements.” The requirements of a product or process can be categorized or given a grade that will provide a basis for comparison. The quality is determined by how well something meets the requirements of its grade.
For most people, the term quality also implies good value—getting your money’s worth. For example, even low-grade products should still work as expected, be safe to use, and last a reasonable amount of time. Consider the following examples.
Example: Quality of Gasoline Grades
Petroleum refiners provide gasoline in several different grades based on the octane rating because higher octane ratings are suitable for higher compression engines. Gasoline must not be contaminated with dirt or water, and the actual performance of the fuel must be close to its octane rating. A shipment of low-grade gasoline graded as 87 octane that is free of water or other contaminants would be of high quality, while a shipment of high-grade 93 octane gas that is contaminated with dirt would be of low quality.
Statistics
Determining how well products meet grade requirements is done by taking measurements and then interpreting those measurements. Statistics—the mathematical interpretation of numerical data—are useful when interpreting large numbers of measurements and are used to determine how well the product meets a specification when the same product is made repeatedly. Measurements made on samples of the product must be within control limits—the upper and lower extremes of allowable variation—and it is up to management to design a process that will consistently produce products between those limits.
Instructional designers often use statistics to determine the quality of their course designs. Student assessments are one way in which instructional designers are able to tell whether learning occurs within the control limits.
Example: Setting Control Limits
A petroleum refinery produces large quantities of fuel in several grades. Samples of the fuels are extracted and measured at regular intervals. If a fuel is supposed to have an 87-octane performance, samples of the fuel should produce test results that are close to that value. Many of the samples will have scores that are different from 87. The differences are due to random factors that are difficult or expensive to control. Most of the samples should be close to the 87 rating and none of them should be too far off. The manufacturer has grades of 85 and 89, so they decided that none of the samples of the 87-octane fuel should be less than 86 or higher than 88.
If a process is designed to produce a product of a certain size or other measured characteristic, it is impossible to control all the small factors that can cause the product to differ slightly from the desired measurement. Some of these factors will produce products that have measurements that are larger than desired and some will have the opposite effect. If several random factors affect the process, they tend to offset each other, and the most common results are near the middle of the range; this phenomenon is called the central limit theorem.
If the range of possible measurement values is divided equally into subdivisions called bins, the measurements can be sorted, and the number of measurements that fall into each bin can be counted. The result is a frequency distribution that shows how many measurements fall into each bin. If the effects that are causing the differences are random and tend to offset each other, the frequency distribution is called a normal distribution, which resembles the shape of a bell with edges that flare out. The edges of a theoretical normal distribution curve get very close to zero but do not reach zero.
Example: Normal Distribution
A refinery’s quality control manager measures many samples of 87 octane gasoline, sorts the measurements by their octane rating into bins that are 0.1 octane wide, and then counts the number of measurements in each bin. Then she creates a frequency distribution chart of the data, as shown in Figure 10.1.
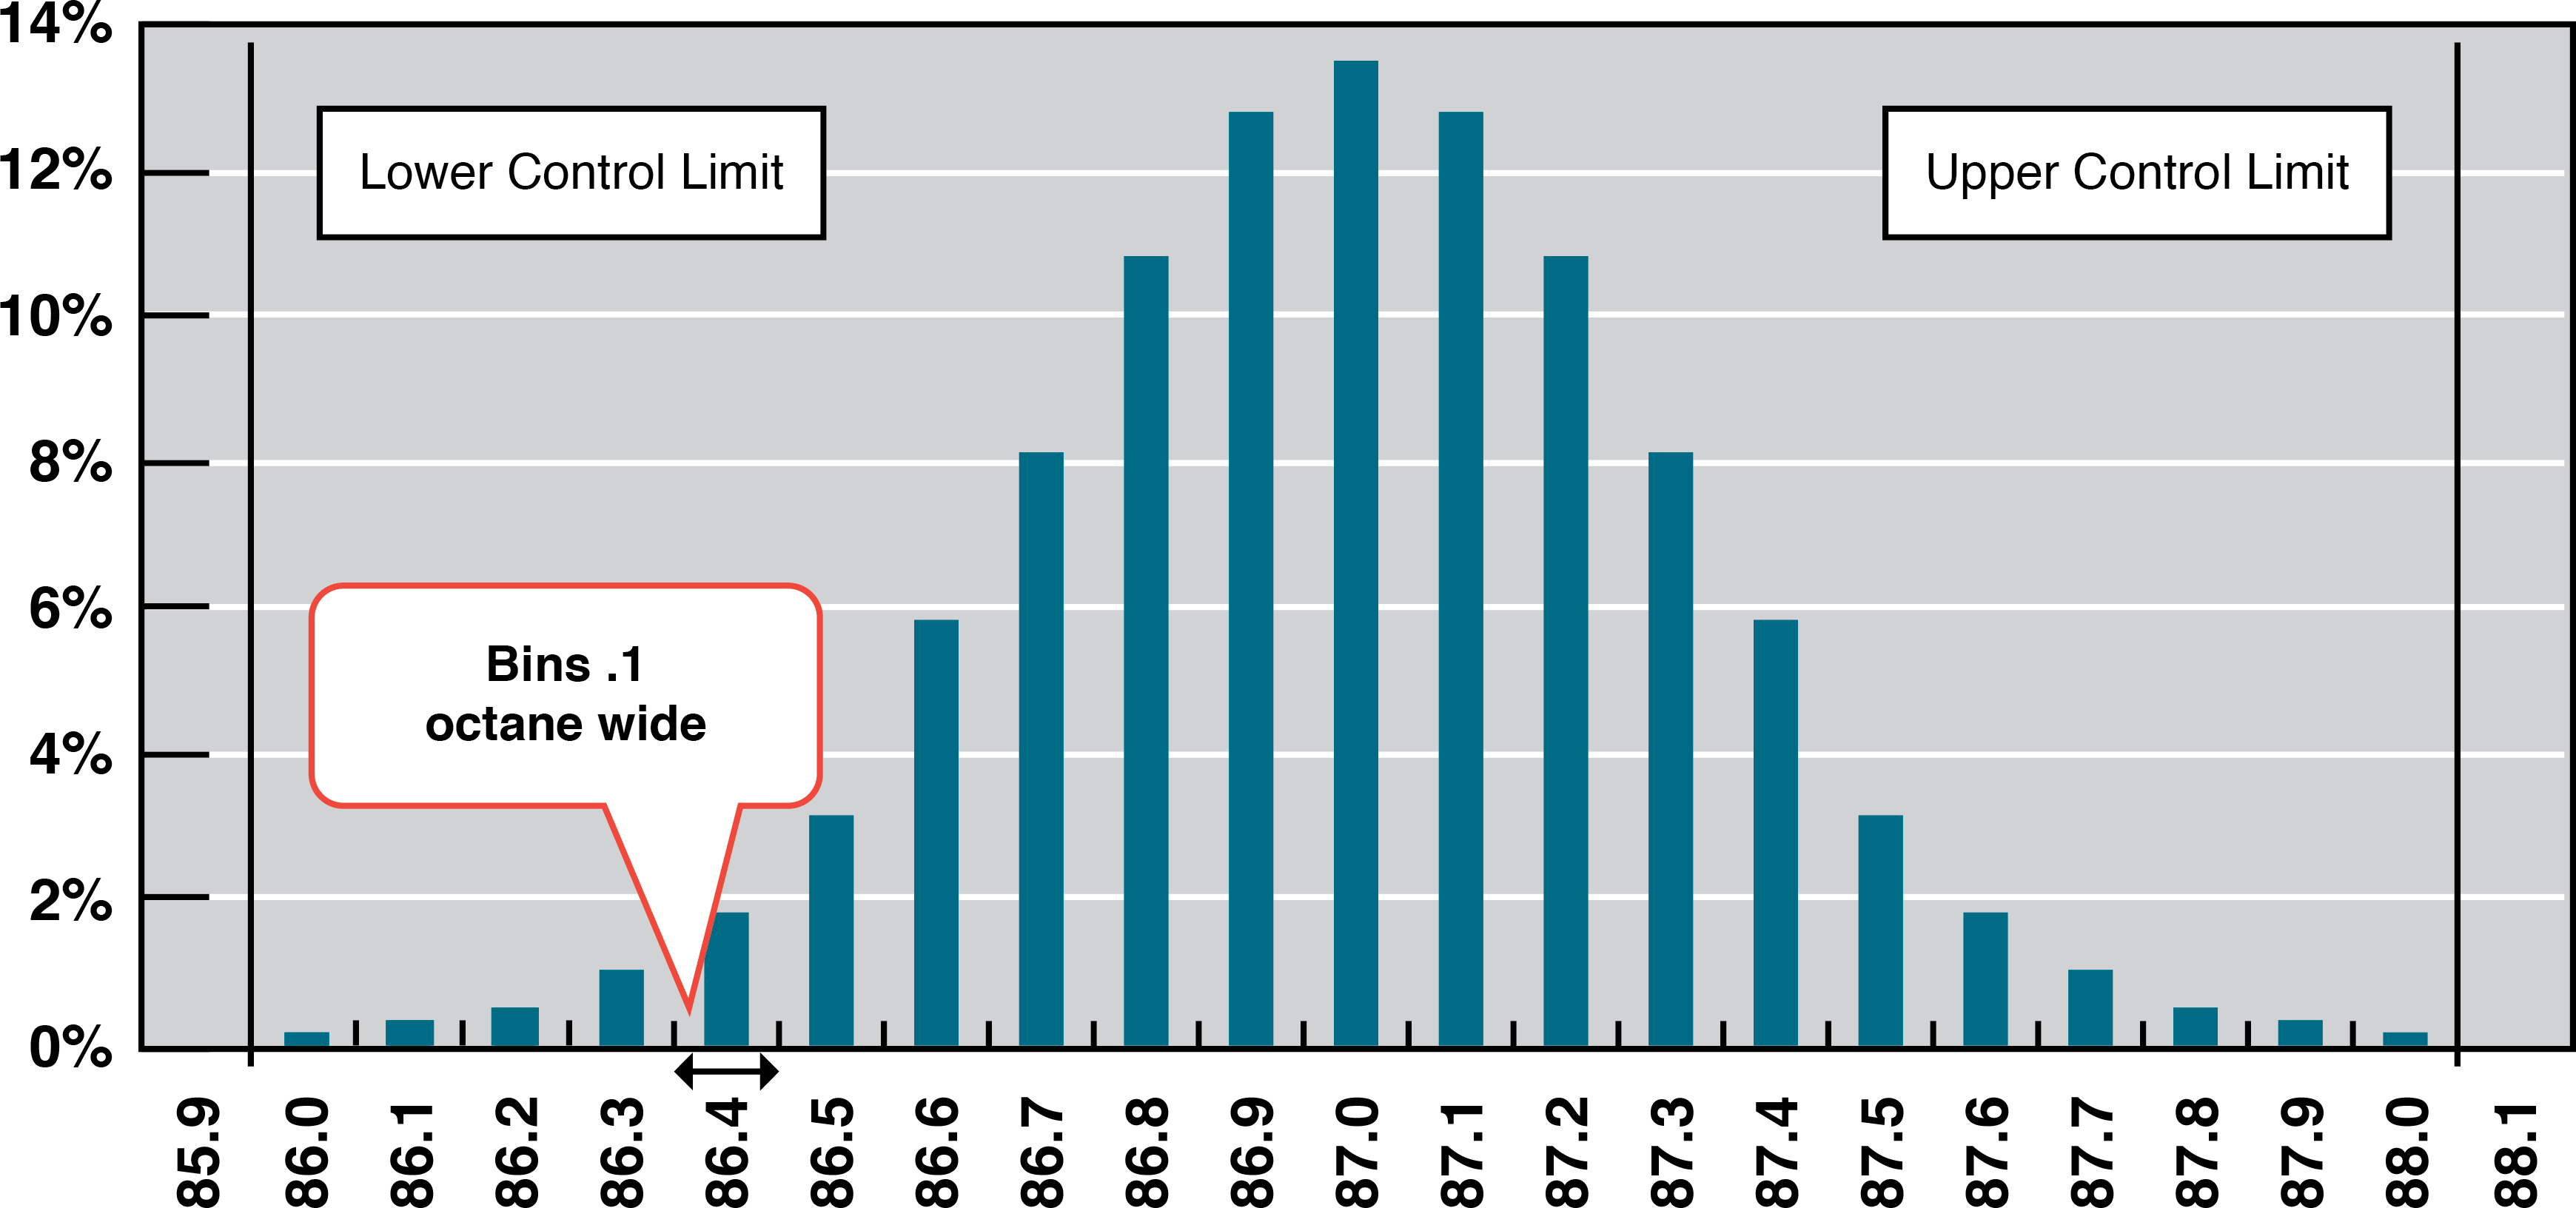
It is common to take samples—randomly selected subsets from the total population—and measure and compare their qualities, since measuring the entire population would be cumbersome, if not impossible. If the sample measurements are distributed equally above and below the centre of the distribution as they are in Figure 10.1, the average of those measurements is also the centre value that is called the mean and is represented in formulas by the lowercase Greek letter μ (pronounced mu). The amount of difference of the measurements from the central value is called the sample standard deviation or just the standard deviation.
The first step in calculating the standard deviation is subtracting each measurement from the central value (mean) and then squaring that difference. (Recall from your mathematics courses that squaring a number is multiplying it by itself and that the result is always positive.) The next step is to sum these squared values and divide by the number of values minus one. The last step is to take the square root. The result can be thought of as an average difference. (If you had used the usual method of taking an average, the positive and negative numbers would have summed to zero.) Mathematicians represent the standard deviation with the lowercase Greek letter (pronounced sigma). If all the elements of a group are measured, instead of just a sample, it is called the standard deviation of the population and in the second step, the sum of the squared values is divided by the total number of values.
Figure 10.1 shows that the most common measurements of octane rating are close to 87 and that the other measurements are distributed equally above and below 87. The shape of the distribution chart supports the central limit theorem’s assumption that the factors that are affecting the octane rating are random and tend to offset each other, which is indicated by the symmetric shape. This distribution is a classic example of a normal distribution. The quality control manager notices that none of the measurements are above 88 or below 86 so they are within control limits, and she concludes that the process is working satisfactorily.
Example: Standard Deviation of Gasoline Samples
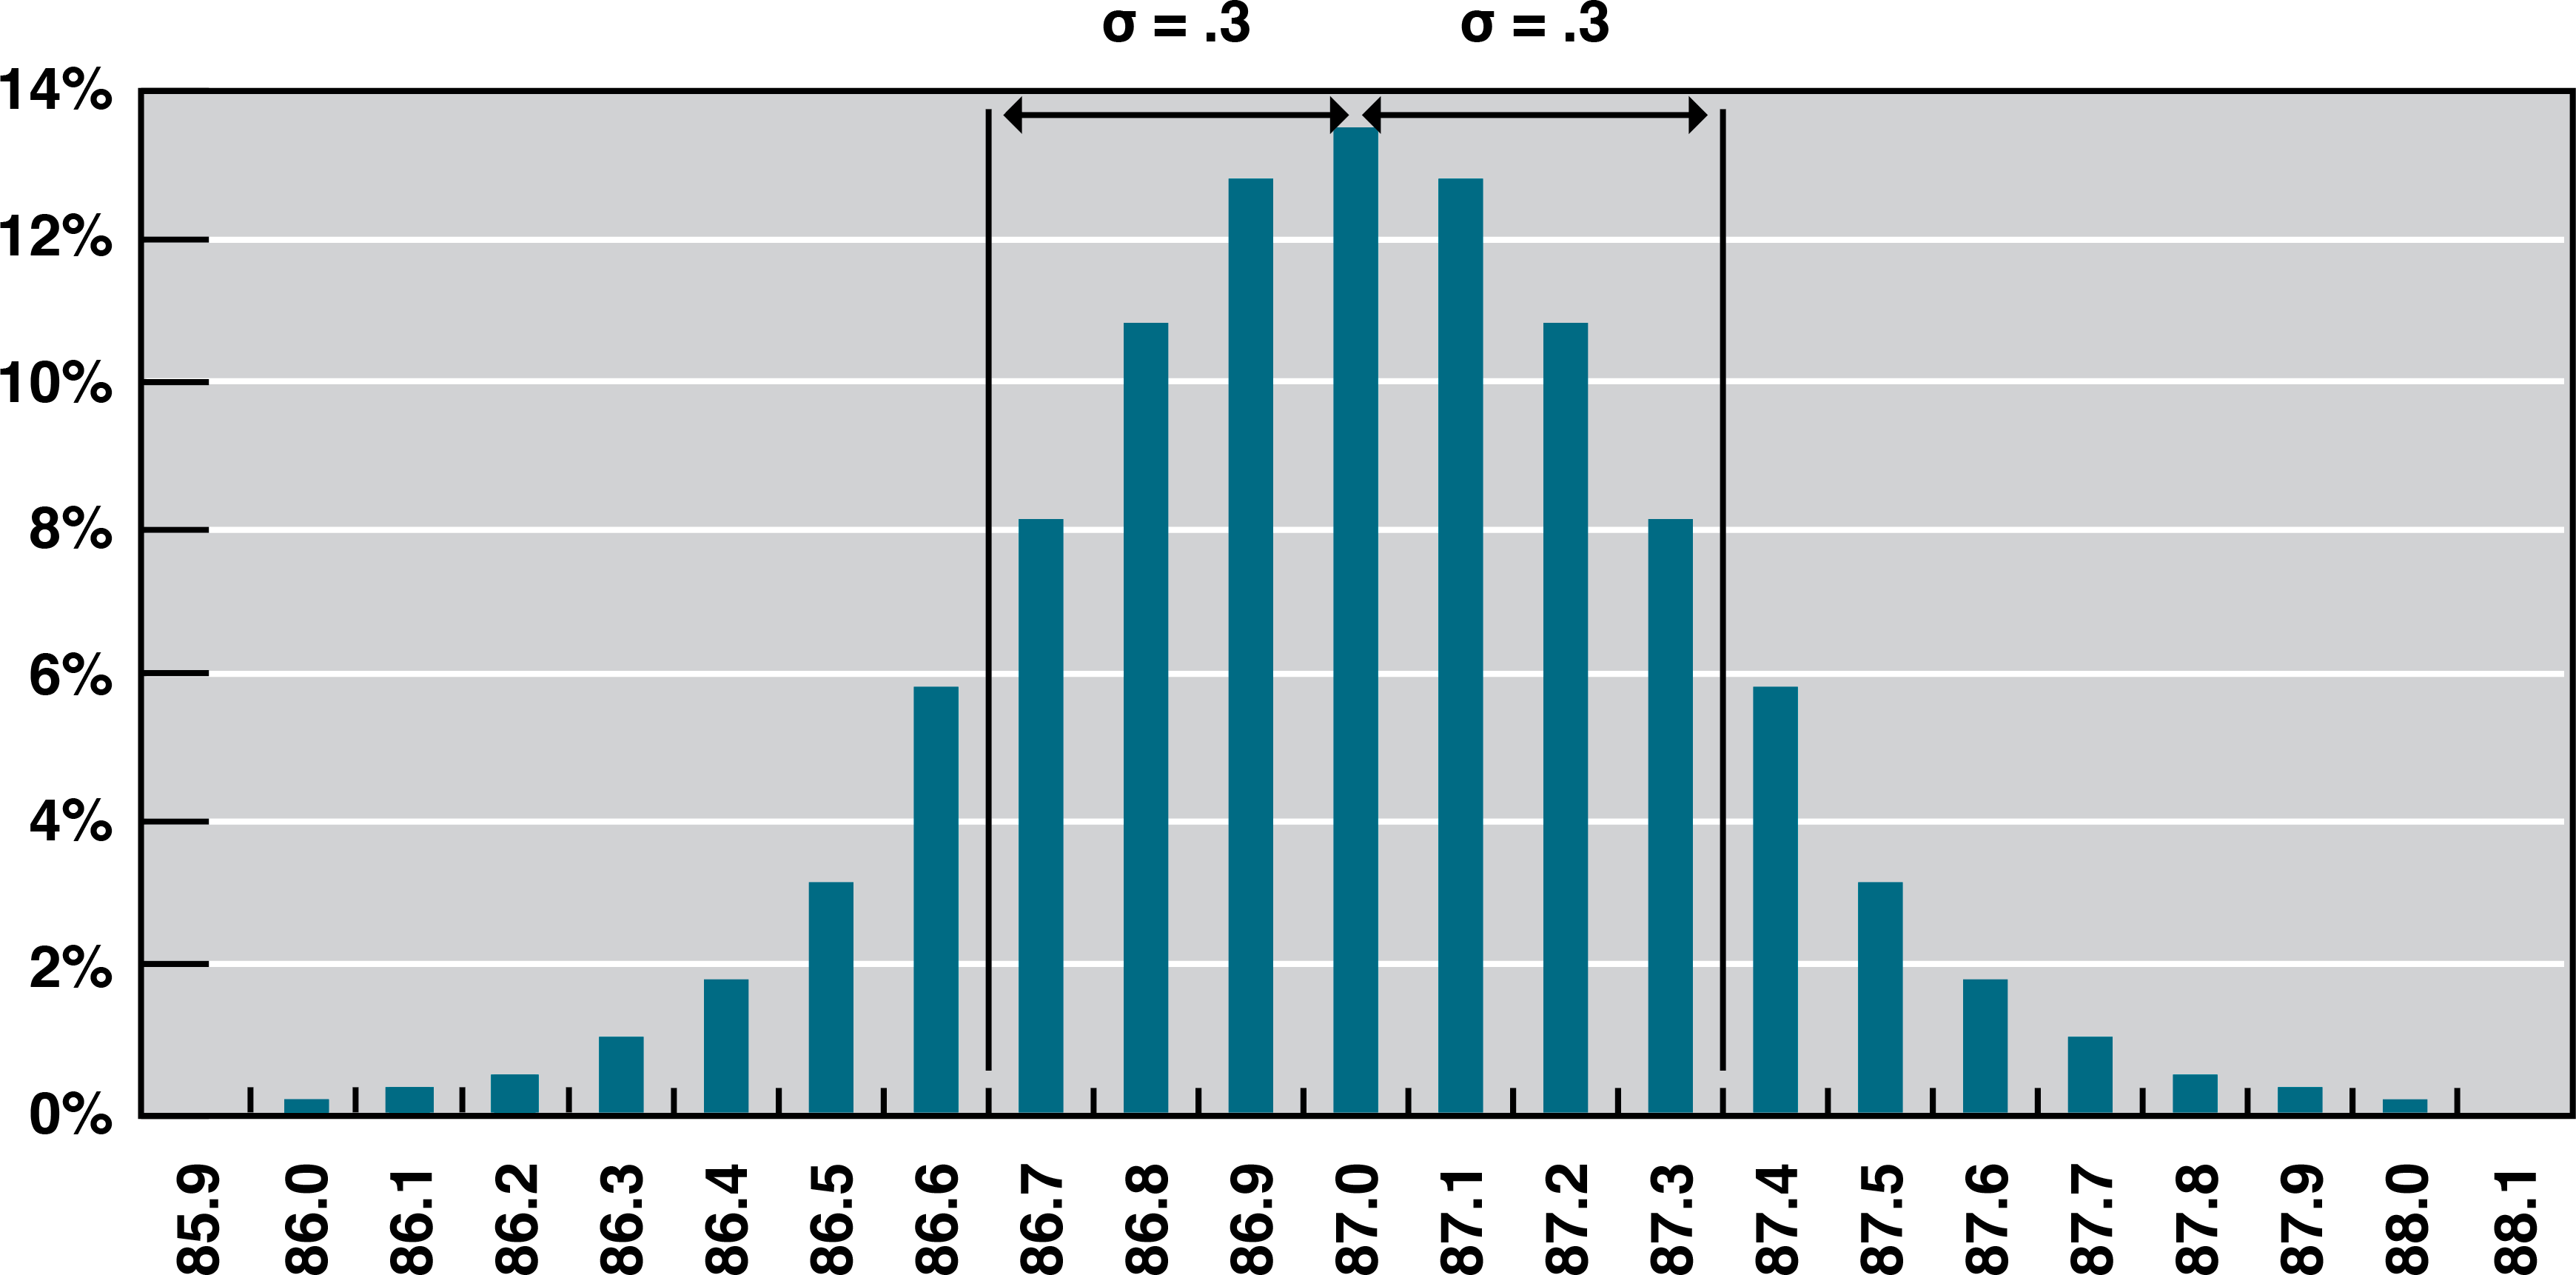
The refinery’s quality control manager uses the standard deviation function in her spreadsheet program to find the standard deviation of the sample measurements and finds that for her data, the standard deviation is 0.3 octane. She marks the range on the frequency distribution chart to show the values that fall within one sigma (standard deviation) on either side of the mean (Figure 10.2).
For normal distributions, about 68.3% of the measurements fall within one standard deviation on either side of the mean. This is a useful rule of thumb for analyzing some types of data. If the variation between measurements is caused by random factors that result in a normal distribution, and someone tells you the mean and the standard deviation, you know that a little over two-thirds of the measurements are within a standard deviation on either side of the mean. Because of the shape of the curve, the number of measurements within two standard deviations is 95.4%, and the number of measurements within three standard deviations is 99.7%. For example, if someone said the average (mean) height for adult men in the United States is 178 cm (70 inches) and the standard deviation is about 8 cm (3 inches), you would know that 68% of the men in the United States are between 170 cm (67 inches) and 186 cm (73 inches) in height. You would also know that about 95% of adult men in the United States are between 162 cm (64 inches) and 194 cm (76 inches) tall and that almost all of them (99.7%) are between 154 cm (61 inches) and 202 cm (79 inches) tall. These figures are referred to as the 68-95-99.7 rule.
“14. Quality Planning” from Project Management by Adrienne Watt is licensed under a Creative Commons Attribution 4.0 International License, except where otherwise noted.
