Accessible Tables and Graphs
Use simple formatting options to make tables and graphs easier to use for everyone.
Tables
Word processors and presentation software, like Microsoft Word and Microsoft PowerPoint, have built in functionality to produce properly formatted tables. They include a variety of formatting options, including different styles and colours. You can also add a header row, a first column, a last column, etc., as needed. These formatting options will not only enhance the look of your tables, but also digitally tag these features so that they can be navigated with a screen reader.
Table tools in Microsoft Word:
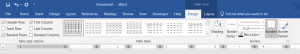
Table tools in Microsoft PowerPoint:

Complex graphs
All graphs and images should have alt-text to provide a description of the image to those that are unable to see it. Complex images may require a combination of alt-text, picture captions, and further information as needed.
Information to include:
- Title
- Headings
- Caption – the caption should describe the graph (e.g. the bar chart represents average student grades per academic year. Academic years are represented using columns lined up horizontally, with heights indicating the average grade as a percentage). You could include a hyperlink in the caption to a full description in another document or an appendix in your current document.
- Overview – the overview should describe the key message of the graph and may be similar to the picture caption
- Data – the data section can share the source data for the graph in a correctly formatted table allowing users to get into the technical detail of the graph if needed
Attribution and References
Accessible Tables and Graphs is adapted from “Accessible tables and graphs [New Tab]” by the University of Lincoln, used under CC BY-NC-SA 4.0.
