5 Cost Analysis
COST ANALYSIS: WHAT DOES THIS COST?
Cost analysis is useful for addressing several key questions that managers ask:
- Will the revenue from a new grant opportunity cover the costs to expand a program?
- Will a program or service benefit from economies of scale? If not, why not?
- How much should we budget for a new staff member? To add a new shift or other group of new staff?
- How much “overhead” or “indirect costs” should we negotiate into a contract with a government?
- What price should we set for a new fee-based service?
- When will we need to add more staff, and how will adding staff affect our cost structure?
- What’s the best way to share costs between departments within an organization? Between organizations? Between units of government?
In February 2016 a federal judge in Albuquerque, NM approved a $1 billion settlement between the Obama administration and nearly 700 Native American tribes. This settlement ended a decades-long class action lawsuit over how the federal Bureau of Indian Affairs (BIA) had distributed aid to tribes since the mid 1970s.
This case came about because of some disagreements over how to measure costs. For more than 150 years the BIA was directly responsible for most of the health care, education, economic development, and other core services delivered on Native American reservations. But then starting in the mid-1970s it shifted its focus from direct service provision to helping tribes become self-sufficient. Instead of managing services, it redirected its resources toward training, technical assistance, and other efforts to help tribes launch and maintain their own services.
To make that transition BIA re-classified many of its activities as “contract support costs.” This change was not just semantic. Funding for direct BIA-administered services was part of a regular federal budget appropriation. That appropriation was stable and predictable. By contrast, funding for support costs on federal government contracts is quite variable and must be renegotiated often. Perhaps not surprisingly, total BIA spending declined steadily under this new capacity-building model.
Tribes across the US argued that by re-classifying many of BIA’s costs, the federal government gave itself permission to slash BIA’s budget without Congressional approval. The tribes’ alleged this simple cost measurement maneuver allowed BIA to operate well outside its authority and to inflict substantial harm on Native Americans around the country. BIA argued that the cost reclassification was a standard accounting change that has happened across the federal government for decades. The case was ultimately settled for far less than the tribes requested, but the federal government did agree to re-classify many contract support costs as direct service costs for which federal funding is far more transparent and predictable.
This case illustrates the central point of this chapter: how we define and measure costs matters tremendously. In this case, cost measurement was not just a technical exercise; it had real impacts on the lives of hundreds of thousands of Native Americans. The same is true for virtually all public services. How we define, measure, and plan for costs affects which services we deliver and how we deliver them.
Learning Objectives
After reading this chapter you should be able to:
- Define the cost objective and relevant range for the goods and services that public organizations deliver
- Contrast fixed costs from variable costs
- Contrast direct costs from indirect costs
- Allocate costs across departments, organizations, and jurisdictions
- Determine the full cost of a good or service
- Prepare a flexible budget for a program or service
- Calculate the break-even price and break-even quantity for a good or service
- Contrast cost-based pricing with price-based costing
- Recommend management strategies and policies informed by analysis of costs “at the margin”
- Analyze budget variances, both positive and negative
What is Cost Analysis?
If you’ve ever flown on an airplane, there’s a good chance you know Boeing. The Boeing Company generates around $90 billion each year from selling thousands of airplanes to commercial and military customers around the world. It employs around 200,000 people, and it’s indirectly responsible for more than a million jobs through its suppliers, contractors, regulators, and others. Its main assembly line in Everett, WA is housed in the largest building in the world, a colossal facility that covers nearly a half-trillion cubic feet. Boeing is, simply put, a massive enterprise.
And yet, Boeing’s managers know the exact cost of everything the company uses to produce its airplanes; every propeller, flap, seat belt, welder, computer programmer, and so forth. Moreover, they know how those costs would change if they produced more airplanes or fewer. They also know the price at which they sold that plane and the profit the company made on that sale. Boeing’s executives expect their managers to know this information, in real time, if the company is to remain profitable.
Cost accounting (also known as managerial accounting) is the process of creating information about costs to inform management decisions. Managers need good information about costs to set prices, determine how much of a good or service to deliver, and to manage costs in ways that make their organization more likely to achieve its mission. Managers in for-profit entities like Boeing, have instant access to sophisticated cost information that would assist with those types of decisions. But managers in the public and non-profit sectors usually don’t. There are many reasons for this:
- Large parts of the public sector don’t produce a “product,” but they do produce a service like counseling juvenile offenders, protecting the environment, or helping the homeless. Sometimes we know the “unit” of production and can measure costs relative to that unit. In the case of counseling juvenile offenders, we might think about the cost per offender to provide those services. But for services without a clear “end user,” like environmental protection, this analysis is much more difficult.
- Most (usually around 80%) of the costs incurred by a typical public sector organization are related to people. A parole officer will see many different types of parolees. Some will demand a lot of attention and follow-up. Some will need next to none. Some parole officers are comfortable giving each case an equal amount of time and attention. Others are not. This type of variability in how and where people spend their time, and as a result, where labor costs are incurred, can make cost analysis quite difficult.
- Employees often work across multiple programs. A program manager at a non-profit organization might work across two different programs funded by two different grants from two different funding agencies. Unless that program manager allocates their time exactly equal across both programs – and that’s unlikely – we can’t know the exact cost of each program without a careful study of how and where that employee spends their time.
- Public services often share buildings, equipment, vehicles, and other costs. Without a system to track exactly which staff and programs use exactly which resources, it’s difficult to know the full cost to deliver a particular service.
- Good cost analysis has no natural political constituency. Careful cost analysis requires substantial investments in information technology, staff capacity, accounting information systems, and other resources. Most taxpayers and funders would rather see that money spent on programs and services to help people in the short-term, and not on information systems to analyze and plan for future costs.
These are just a few of the many barriers that prevent public organizations from acting more like Boeing, at least with respect to cost analysis.
And yet, good cost analysis is absolutely crucial to public organizations. Public financial resources are finite, scarce, and becoming scarcer. Public managers must understand how and where they incur costs, how and where they will incur costs under different service delivery models, and whether that pattern of costs is consistent with their organization’s mission and objective. In this chapter we introduce the core concepts of cost accounting, and we show how to apply those concepts to real management decisions.
At the outset it’s important to draw a distinction between full cost accounting and differential cost accounting. Full cost accounting is the process of identifying the full cost of a good or service. Differential cost accounting – sometimes called marginal cost analysis – is the process of determining how the full cost of a good or service changes when we deliver more or less of it. Good financial management requires careful attention to both.
Let’s start with a simple example. Imagine a copying machine that’s shared among three departments within the Environmental Health Department of a county government. Those three departments are:
- Food Protection. This includes inspection and licensing of restaurants and other establishments that serve food. This program is designed to prevent outbreaks of food-borne diseases like E. coli, botulism, and Hepatitis A. Staff in this division make make around 500 copies each day, mostly related to documenting restaurant inspections.
- Animals and Pests. This includes animal control, rodent testing and control, and educational programs to promote pet safety and neutering/spaying. These programs are designed to prevent communicable diseases, including rabies, that are most often spread by vagrant animals. Staff in this division make around 250 copies each day, but that number can increase in the event of a outbreak of avian flu or other communicable disease.
- Wastewater. The Wastewater department is responsible for treating wastewater. Staff in this division issue water discharge permits to businesses and industrial operations, and also test water quality near wastewater discharge sites. These programs are necessary to prevent waterborne communicable diseases like cryptosporidium. Wastewater division staff typically make around 100 copies each day, but make up to 1,000 per day when processing complex industrial building permits. They process around six such permits each year.
As a manager you’d want to know what it costs to operate the copier, and how those costs ought to be spread across the three departments. To put this question in the language of cost accounting, we want to know:
- What is the full cost to operate the copier?
- How should we allocate the costs of operating the copier across the three departments?
To answer these questions we first need to know all of the different ways the copier incurs costs. A few come to mind immediately: paper and toner to make the actual copies, a lease or rental payment to take possession of the copier, and occasional maintenance and repairs. A few might be less obvious: electricity to run the machine, space within a building to house the machine, and an office manager’s time to coordinate maintenance and repairs. We can observe many of these costs, but other we’ll need to estimate or impute.
Most public services are delivered “at cost,” meaning they are priced to generate enough revenue to cover the full cost to deliver them, but not more. The late management guru Peter Drucker called this cost-based pricing. By contrast, many for-profit goods and services are sold at prices well in excess of cost. For instance, most wines are priced at 100-200% above the full cost to produce them. A box of popcorn at the movies is usually priced at 700-800% above cost. And so forth. Wine retailers and cinemas will sell these products at whatever price consumers are willing to pay, regardless of what they cost to produce. Drucker called this price-based costing. Virtually all highly profitable businesses design the cost structure of their products and services around what consumers will pay. The opposite is also true. For-profits often sell goods and services at prices well below cost – a so called “loss leader” – in an effort to attract customers. Most public organizations cannot routinely engage in these types of price-based costing tactics and expect to accomplish their missions and remain in good financial position.
The next question is how the departments should share these costs. Imagine, for instance, that they split those costs one-third for each department? This approach is simple, easy, and transparent. But what’s wrong with it? Each department makes a different number of total copies, and each also has a different workflow related to the copier. These departments also have different potential “economies of scale” for copying. Also keep in mind that Animals and Pests needs more “emergency capacity” or “surge capacity” than the other two departments. So if an even distribution is not the most appropriate, then what is? With careful attention to cost accounting methods we can begin to address these and other questions.
Full Cost Accounting
Measuring Full Cost: The Six-Step Method
To answer the question “what does this service cost?” cost accountants follow a six-step process. Each step of this process is driven by policies and procedures that are defined by an organization’s management:
- Define the cost object. The cost object is the product or deliverable for which costs are measured. Service-oriented public organizations typically define cost objects in terms of the end user or recipient of a service. Examples include the cost to shelter a homeless person for an evening, the cost per counseling session delivered to recovering substance abusers, the cost to place a family in affordable housing, and so forth.
- Determine cost centers. A cost center is a part of an organization that incurs costs. It could be a program, a unit within a department, a department, a grant, a contract, or any other entity that’s clearly defined for cost accounting purposes. As a general rule, cost centers work best if they are for homogeneous groupings of activities.
- Distinguish between direct and indirect costs. Direct costs are connected to a specific cost center. In fact, they’re often called “traceable costs.” Examples include salaries for staff who work entirely within a cost center, facilities and supplies used only by that cost center, training for cost center-specific staff, etc. Many public organizations further stipulate that a cost is direct to a cost center only if it can be controlled by that center’s management. Indirect costs apply to more than one cost center. They include shared facilities, general administration, payroll processing services, information technology support, etc. Some managers call them service center costs, internal service costs, or overhead costs because they are usually for support services provided within an organization. The full cost of any service is the direct costs plus the indirect costs.
- Choose allocation bases for indirect costs. One of the main goals of full cost accounting is to distribute indirect costs to cost centers. This follows from the logic that all direct costs require support from within the organization. An allocation basis is an observable metric we can use to measure the relationship between direct and indirect costs within a cost center. For example, a non-profit might allocate indirect costs according to the number of full-time equivalent (FTE) employees within a cost center, or the percentage of the organization’s overall payroll earned by employees within that cost center.
- Select an allocation method. There are two main methods to allocate or apportion indirect costs to cost centers. One is simply to call indirect costs their own cost centers and plan accordingly. For instance, a non-profit could choose to call the executive director its own cost center. In that case it would plan for and report the executive director’s salary, benefits, and other costs as a stand-alone entity, rather than allocate those costs as an indirect cost to other direct service cost centers. A more common approach is to allocate by a denominator that’s common to all the cost centers that incur a particular indirect cost (see below).
- Attach costs to cost objects. One of big challenges for public organizations is that cost objects are usually people, and no two people are alike. For instance, a parole officer might have 30 clients, but each requires a different amount of time, attention, and counseling. When the cost per client varies a lot, the cost accounting system ought to reflect those differences, usually by applying different overhead rates or percentages to different types of clients.
Let’s illustrate some of these concepts with the copier example. To begin, assume that the copier is its own cost center. Services like copying, information technology, payroll, exist to serve clients within the organization, so they’re called service centers. One of the goals of cost accounting is to allocate service centers’ costs to mission centers that are more directly connected to the organization’s core programs and services. In this case we can assume Food Inspection, Animals and Pests, and Wastewater are mission centers that will ultimately receive costs allocated from the copier service center. Given those assumptions about cost centers, we can assume the cost object for the copier service center is the cost per copy.
With those assumptions established we can define direct and indirect costs for the copier service center. Direct costs include paper, toner, the machine rental/lease fees, and machine maintenance. These costs are incurred exclusively by the copier. Electricity, building space, and the office manager’s time are indirect costs. They are incurred by the copier cost center and by other cost centers.
To illustrate, the table below lists some details on the copier’s full costs for FY2015.
| Direct Costs | |||
| Cost Item | Number | Unit Cost | Total |
| Paper | 500 reams | $20/ream | $10,000 |
| Toner | 30 cartridges | $90/cartridge | $2,700 |
| Machine Rental | $500/month | 12 months | $6,000 |
| Machine Maintenance | $75/month | 12 months | $900 |
| Total Direct Costs | $19,900 | ||
| Indirect Costs | |||
| Cost Item | Cost Driver/Amount | Unit Cost | Total |
| Electricity | 1,500 kWh | .12/kWh | $180 |
| Building Space | 100 sq. ft. | $15/sq. ft. | $1,500 |
| Office Manager Time | 5 hours | $20/hour | $100 |
| Total Indirect Costs | $1,780 | ||
| Full Cost | $21,380 | ||
Indirect Cost Allocation: Cost Drivers and Allocation Bases
To find the full cost of the copier cost center we’ll need to find some way to allocate to it its share of those indirect costs. A good cost allocation scheme follows from a clear understanding of an organization’s cost drivers. A cost driver is a factor that affect the cost of an activity. A good cost driver is a reliably observable quantity that shares a consistent relationship with the indirect cost in question. Fortunately, for the copier cost center, we have an intuitive cost driver: the number of copies.
Ideally, we can allocate indirect costs according to their key cost driver(s). An allocation basis is a cost driver that’s common to all the cost centers that incur an indirect cost. For building space, for example, we might find the portion of the total building space that’s occupied by the copier, and allocate a proportionate share of the building space costs to the copier copy center.
For example, this particular county government allocates electricity costs to different cost centers per kilowatt hour (kWh). Sometimes it’s feasible to measure electricity use with this level of precision, and sometimes it’s not. Assume that the copier in question has an individualized meter that measures its electricity use.
This government allocates building space costs per square foot. This assumes it has a reasonably sophisticated way to measure how much space each cost center uses. Allocations by space can be contentious because not every unit uses space in quite the same way to accomplish its mission. For instance, most of the Food Protection staff spend most of their time out in the field inspecting restaurants. They report to the office at the beginning and end of the day, but infrequently during the day. This is quite different from the Animals and Pets center, where most of the staff spend most of their time in the office.
More on Cost Drivers
One of the big challenges in cost accounting is identifying appropriate cost drivers and allocation bases. Each indirect cost item is a bit different and requires a slightly different concept to support an allocation basis. In fact, many public organizations do not allocate indirect costs precisely because they cannot agree on allocation bases that make sense across an entire organization. That said, many of the most common indirect costs can be allocated using simple metrics that can be computed with existing administrative data. Here’s a few examples:
| Cost Item | Potential Cost Driver/Allocation Basis |
| Accounting | Number of transactions processed |
| Auditing | Direct audit hours |
| Data Processing | System usage |
| Depreciation | Hours that equipment is used |
| Insurance | Dollar value of insurance premiums |
| Legal services | Direct hours/Billable hours |
| Number of documents handled | |
| Motor Pool | Miles driven and/or days used |
| Office machines | Square feet of office space occupied |
| Management | Number of employees; total payroll |
| Procurement | Number of transactions processed |
These figures also assume the government allocates the office manager’s time to individual cost centers. The office manager can do this if he or she tracks the amount of time they spend on work related to each cost center. Some public organizations have such systems, and those systems are often based on a billable hours concept, similar to that used by other professionals like lawyers or accountants. Many do not.
Also note that the copier cost center does not itself receive overhead from other service centers. We don’t see, for example, that the copier center receives a portion of the county administrator’s salary, insurance expenses, or other organization-wide indirect costs. This is a policy choice. Some public organizations do not require service centers to receive overhead costs, mostly to keep down the rates they must charge their internal clients. Many state and local governments have budgeting rules that state programs that are independently financed, or paid for with specific fees or charges rather than general fund resources, do not need to allocate their indirect costs or receive an indirect cost allocation.
That said, many public organizations do allocate overhead to internal cost centers. In fact, when they do they typically use the step-down method of allocating indirect costs. That is, they allocate organization-wide indirect costs to all cost centers first, then allocate service center costs, including their portion of the organization-wide indirect costs, to the mission centers. With those assumptions in place, recall that:
- Food Protection mission center averages 500 copies each day. Assuming 260 work days/year, that’s (500 copies X 260 days) or 130,000 copies. In this case 130,000 copies is the relevant range, or the amount of activity upon which our cost analysis is based. If we assumed the Food Protection mission center would require twice as many copies, our per unit costs and cost allocations would look quite different. Good cost analysis follows from clear, defensible assumptions about the relevant range of activity that will drive costs.
- Animals and Pests mission center makes 250 copies each day, but makes many more in the event of a communicable disease outbreak. Assuming no outbreak, that’s (250 copies X 260 days) or 65,000 copies.
- Wastewater division makes 100 copies/day, but up to 1,000 copies/day around six times per year when processing complex permits. Let’s assume a typical surge in copies for a complex permit will last for five days. That would mean 240 typical days and 30 “surge days” (i.e. six permits X 5 days/permit). So total copies for typical days are (100 copies X 230 days = 23,000 copies) and surge days are (1,000 copies X 30 days = 30,000 copies), for an annual total of 53,000 copies.
From these figures we can determine the copier will make (130,000 copies + 65,000 copies + 53,000 copies) or 248,000 copies each year. If we divide the full annual cost of the copier by the number of copiers ($21,380/248,000 copies) we arrive at unit cost for 248,000 copies of $.086/copy (i.e. 8.6 cents per copy).
With those full costs established, we must then ask how should the Environmental Health department allocate the full costs of the copier cost center across the three mission center departments? Fortunately, this is easy to do because the copier cost center has a clear cost object (cost per copy) and each department/cost center measures the number of copies it makes. As a result, each department would be assigned copier center indirect costs at a rate of 8.6 cents/copy. Food protection would be assigned (130,000 copies X $.086/copy) = $11,180. Animals and Pests would be assigned (65,000 copies X .086/copy) = $5,590. And Wastewater would be assigned (53,000 copies X $.086/copy) = $4,558. With the right allocation basis it’s possible to allocate any indirect costs in a similar way.
This copier example also shows why the cost center and cost object are so important. For instance, imagine that the copier was defined not as one cost center but as separate cost centers for large copying jobs (say, more than 500 copies) and small copying jobs, or for color copies vs. black and white copies. This would also require different cost objects, such as the “cost per black and white copy” or cost per color copy.” The cost per black and white copy would presumably be less than the cost per color copy, and the cost per copy for large print jobs would presumably be less than the cost per copy for small jobs. Different cost centers, cost objects, and allocation methods can mean substantially different answers to the question “what does copying cost?”
One potential drawback of the step-down method is that it allows “double counting” or “cross-allocation” of service center costs to service centers that are already allocated to mission centers. For example, recall that the annual full cost of the copier service center was $21,380. That full cost incorporated the indirect costs of the office manager’s time to manage the copier. Under the step-down method, the cost of the office manager’s time is allocated to the copier cost center, and the copier cost center costs are then allocated across the mission centers. But what happens if the office manager makes copies? Under this indirect cost allocation scheme the office manager’s copies would not be reflected in the total volume of copies made, and the office manager would not receive any of the copy center’s costs. As a result, the mission centers subsidize the office manager’s copying by absorbing a larger share of the copy center’s costs.
In this particular example those subsidies are probably a negligible amount. But in many other scenarios cross-allocation of service center costs can have a major impact on the full cost of a good or service. For instance, imagine a non-profit organization with three mission centers, a service center for the executive director, and a human resources service center. The human resources service center spends most of its time interacting with the executive director, as is often the case in small non-profits. If this organization uses the typical step-down approach, and it first allocates the executive director’s costs to the other service centers, then the full costs of the three mission centers will include a sizable subsidy for the costs of the executive director-human resource center’s interactions.
To address this problem many public organizations instead use the double-step-down method. After each service center/department’s costs have been allocated once, each center/department’s cost not included in the original allocation are totaled and allocated again. To illustrate, let’s return to the copy center-office manager example above. If this allocation were done with the double-step-down method the office manager’s copies would be included in the total copy figure. The copy center’s would first allocate its costs, excluding the office manager’s copies, to the mission centers. Then in a second step, the office manager’s share of the copying costs would be allocated to the mission centers in a separate allocation. This double-step method minimizes cross-allocation of service center costs.[1]
Keep in mind that there are no national or international standards for how public organizations measure and define their cost structures, also known as their cost accounting practices. Governments employ a variety of state and local-specific cost accounting methods. Non-profits tend to follow the cost accounting conventions prescribed by federal and state grants or major foundations, but those conventions do not equate to national standards. By contrast, financial accounting – or accounting designed to report financial results to outside stakeholders – is dictated by GAAP. That’s why it’s possible to compare a government’s financial statements to that of another government, and a non-profit’s financial statements to that of another non-profit, but not necessarily possible to compare different organizations’ budgets or internal cost accounting systems.
Indirect Cost Allocation: Indirect Cost Rates
Cost drivers and allocation bases work well when the service in question has a clear cost objective and a measurable unit of service. Most public organizations, as described above, don’t have this luxury. Many don’t deliver a service with a measurable outcome. Most public organizations’ costs are related to personnel, and personnel costs are not distributed evenly across clients or cases. Moreover, a growing number of public services today are delivered through partnerships and collaborations where it’s often not clear how costs are incurred, and murkier yet how those costs ought to be allocated across the partner organizations. For these and many other reasons, traditional cost allocation methods often don’t work in the public sector. And yet, it’s still critically important to measure and properly account for full costs, including and especially indirect costs that can be difficult to measure.
To address these problems many public organizations rely on indirect cost rates. An indirect cost rate is a ratio of indirect costs to direct costs. For instance, a city police department might determine that its indirect cost rate is 15%. That means that for every dollar of direct costs like police officer salaries and squad cars, it will incur 15 cents of payroll processing, insurance, procurement expenses, and other indirect costs.
Taking Stock of Costs
Public organizations rarely have the kinds of sophisticated cost tracking and measurement systems that you might find at Boeing or other manufacturers, logistics companies like FedEx, or retail entities like Amazon. So how do budgeting and finance staff begin to understand what a public organization’s services cost? There are three basic methods.
- “Time in Motion.” Public organizations will occasionally send analysts to see where and how employees spend their time. For instance, a city planning department might allow analysts into their office to watch how much time staff spend on different types of permits, appeals, and other activities. After observing the department’s activities for a sample of days over a period of weeks or months, cost analysts can estimate how much time staff spend on each of their different activities, and can then build out cost estimates.
- Self-reported Allocations. Some organizations ask staff to keep track of their own time, much like the billable hours method used by attorneys, accountants, and other professionals. Some of these tracking schemes are quite detailed, requiring time reported in 15 minute intervals. Others are much more general and allow for estimates on much larger intervals like days or weeks.
- Statistical Analysis. Cost accountants occasionally use regression analysis and other statistical tools to estimate the relationship between costs and services delivered. One of the most common is to determine the linear trend, if any, between total expenses and volume of service delivered over time. Variation around that trend (i.e. the residuals from the regression analysis) suggest a potential pattern of variable costs.
Let’s illustrate this with a more detailed example. Surveys show that many local public health departments would like to offer more services related to hypertension outreach and management. Chronic health conditions like heart disease and diabetes are known to be related to high blood pressure, so better management of high blood pressure can affect public health in a substantial, positive way. But many citizens, especially those without health insurance, do not have access to regular blood pressure screening and other services needed to identify and manage hypertension.
Say, for example that Cheng County and Duncombe County would like to launch a new, shared hypertension prevention and management (HPM) program. Neither currently has a formal program in this area, but both offer some of the services through a patchwork of partnerships with local non-profits. Cheng County has roughly twice the population of Duncombe County, and Duncombe County’s per capita income and property values are 30-40% higher than Cheng’s.
What does it cost to deliver this service? As with most public health programs the main costs will be related to personnel, namely public health nurses, outreach counselors, and nutritionists. The program will also require space and other overhead costs. The outreach and education components will require advertising, travel, and other costs. For a service sharing arrangement to work, the two Counties must decide how to share these costs.
Suppose also the counties agree in advance to share the full costs evenly. This approach is simple and straightforward. However, it ignores many of the program’s underlying cost drivers. Cheng has a much larger population than Duncombe, so more of the participants will probably come from County A. Simply splitting these costs “50-50″ means Duncombe will likely subsidize Cheng, an arrangement Duncombe’s leaders might find unacceptable.
So what’s the alternative? Cheng could bill Duncombe for each Duncombe resident who participates in the program. They could use an allocation basis like population or assessed property values. A more cutting-edge scheme might be to share the costs according to the incidence of the chronic diseases the HPM program is designed to prevent. Each of these strategies demands a trade-off. Some are simpler, but at the expense of fairness. Some require cost measurement that might be expensive or infeasible. Others are more feasible, but might place costs disproportionately on the population the program is designed to serve.
To begin, let’s assume Cheng will structure the new HPM as a cost center within the Health Behaviors division of its Public Health department. Let’s also assume also that since HPM’s main “deliverable” will be blood pressure screening, it will define its unit cost as the cost per blood pressure screening performed.
Given those assumptions, Cheng County’s budget analysts estimate that for the first year of operations, the HPM program will serve 400 clients, and its cost will include:
- Direct Labor. This includes seven full-time and one half-time licensed nurse practitioners who can administer blood pressure screening. Annual salaries for these nurses is $67,108. The program will also employ a health counselor who will guide clients on how to manage hypertension through healthier eating and fitness. The counselor’s annual salary is $73,815.
- Direct Non-Labor. Nurses and the counselor will need to travel to visit clients and deliver outreach programs. Staff estimate total travel of 20,120 miles of travel at $.325/mile. The HPM program will also require medical supplies, office supplies, and a few capital items. Budget staff estimate $6,142 of annual direct non-labor costs for each nurse, and $7,566 of direct non-labor costs for the counselor. This difference is due to a heavier expected travel schedule for the counselor. The program will also execute an annual contract, valued at $14,939, with a communications consultant who will develop and deliver a healthy eating outreach marketing effort in both counties. Even though most of these costs are related to labor, here they’re considered non-labor “contractual” costs.
- Indirect Labor. Cheng County’s Health Behaviors Manager will supervise the HPM staff, and Cheng County’s Executive will provide policy direction and other leadership. A portion of both administrators’ salaries are allocated to HPM as indirect labor costs. HPM staff will also incur indirect labor costs like payroll support, accounting and auditing services, and procurement support. Budget staff estimate $10,456 of annual indirect labor costs for each nurse, and $8,519 of direct non-labor costs for the counselor.
- Indirect Non-Labor. HPM staff must also have access to office space, liability insurance, association memberships, and other indirect non-labor costs. Budget staff estimates annual indirect non-labor costs of $4,799 for each nurse and counselor.
With that information and a few additional assumptions, we can begin to detail HPM’s cost structure and compute some indirect costs rates. See the table below.
Is it Allowable?
One of the key questions when computing indirect cost rates is which indirect costs are allowable or reasonable? For example, in some cases it’s unclear whether staff who contribute marginally to a program’s operations – such as development directors, general outreach coordinators, and others – should be included as an indirect cost. Certain types of training might be helpful, but not essential for staff to understand their jobs and deliver the service. And of course, there’s always reason to define indirect costs as broadly as possible, especially if you can recover those costs through some external funding source.
There are no national standards, per se, for what constitutes a relevant indirect cost. Each project, program, and funder is a bit different. That said, the federal government has guidelines on what types of indirect costs it will reimburse. Many states and local governments also use these standards or some adaptation of these standards for their internal cost accounting. You can find more information on those guidelines at OMB Circular a-87: Cost Principles for State, Local, and Indian Tribal Governments. This publication is available at http://www.whitehouse.gov/omb/circulars_a087_2004.
| Direct, “Observed” Costs | |||
| “Units” | Cost/Unit | Total | |
| Nurses Salaries | 7.5 | $67,108 | $503,310 |
| Counselor Salaries | 1 | $73,815 | $73,815 |
| Mileage | 20,120 | .325 | $6,539 |
| Outreach | $14,939 | ||
| Total Direct, Observed HPM Program Costs | $598,603 | ||
| Full Cost, by Main Direct Labor Inputs | |||
| Nurses | Annual Cost | Percent of Total Input Costs | |
| Direct Labor | $67,108 | 76% | |
| Direct Non-labor | $6,142 | 7% | |
| Indirect Labor | $10,456 | 12% | |
| Indirect Non-labor | $4,799 | 5% | |
| Total Cost Per Nurse | $88,505 | 100% | |
| Full Cost of Nurses | 7.5 X $88,505 | $663,788 | |
| Counselor | Annual Cost | Percent of Total Input Costs | |
| Direct Labor | $73,815 | 78% | |
| Direct Non-labor | $7,566 | 8% | |
| Indirect Labor | $8,519 | 9% | |
| Indirect Non-labor | $4,799 | 5% | |
| Total Cost Per Counselor | $94,699 | 100% | |
| Full Cost of Counselors | $94,699 X 1 | $94,699 | |
| Full Cost of HPM Program | $758,487 | ||
The first section of this table lists HPM’s direct, “observable” costs. We know the program will employ nurses and counselors, and we know it will demand mileage and the communications contract as direct, non-labor costs. These “observable” direct costs total $598,603, or $1,496/client given the estimated 400 clients.
But the much more important question is how do we account for the indirect costs, and for the direct costs that are more difficult to observe? The lower part of this table outlines those costs. When we include the indirect labor and indirect non-labor costs we see the full cost of the program increase to $758,487, or $1,896/client. Or, put differently, the full cost of the program increases by more than 26% if we include all the indirect costs in our estimate of the full costs. Recall that Cheng County plans to bill Duncombe County for Duncombe’s share of the program costs. If Cheng bills only for the direct costs, it “undercharges” Duncombe by nearly 26%. That’s why it’s critically important to measure full costs, especially when pricing services or requesting reimbursements for expenses incurred.
What about potential indirect cost rates? According to these figures, 76% of the full cost to employ a nurse is direct labor costs and 7% is direct non-labor costs. It follows that the remaining 17% is indirect costs related in a predictable way to those direct costs. Each nurse and the counselor will be insured, will have their payroll processed by the payroll office, will occupy space in an office within a County building, and so on. If those figures are predictable, we can assume the current indirect cost rate for nurses is 17%. For counselors the direct costs are a bit higher at 86%, for an indirect cost rate of 14%. In practice, this means that in future budgets the HPM program could simply assume that for every dollar it will spend on nurses salaries, it can expect to incur 17 cents of indirect costs, and for every dollar its will spend on counselor’s salaries it can expect to incur 14 cents of indirect costs. Some organizations compute indirect cost rates based only on direct labor costs. In that case the rate for nurses would be the indirect costs divided by just the direct labor costs, or (($10,456+$4,799)/$67,108, or just under 23%.
We can also think about an indirect cost rate for the entire HPM program. For that we simply compare the total indirect costs to the total direct costs. Total indirect costs for the nurses are (($10,456 + $4,799) X 7.5) = $114,413 and for the counselors are (($8,519 + $4,799) X 1) = $13,318, for total indirect costs of $127,731. Total direct costs for the nurses are (($67,108 + $6,142) X 7.5) = $549,375 and for the counselor are (($73,815 + $7,566) X 1) = $81,318, for total direct costs of $630,756. So the overall indirect cost rate is $127,731/$630,756, or 20%. Again, all these figures assume the HPM program serves 400 clients.
Information about indirect cost rates is relevant to many types of decisions. For instance:
- HPM staff might compare their indirect cost rate to the rates of other programs within Cheng County government. If its rates are noticeably higher or lower, it might more carefully review its cost structure and how it manages its costs. If its rates seem grossly out of line with other units it might request an additional review by Cheng County’s budget staff.
- The counties might use these rates when applying for federal or state grants, or for support from philanthropic foundations, to support the HPM program.
- The counties might eventually decide to contract out some or all of HPM’s operations to a non-profit health care provider. In that case these rates would be a focal point for negotiating the per client rate at which the counties would reimburse a prospective contractor.
- Other governments might review these rates as an initial indicator of whether they can afford their own HPM program.
Easy as ABC?
Some governments, and many private sector organizations, try to address this problem through activity-based costing (ABC). ABC identifies the full cost of different activities within organizations that drive costs, regardless of the original cost center to which those costs were assigned. It then allocates those full costs according to changes in those underlying cost drivers.
In the HPM example, for instance, if Cheng County followed an ABC model the information services staff might have identified the unit costs of different types of information services requests. More complex activities, like the information-gathering about Duncombe County residents, would incur costs at a different rate than simpler activities. To the earlier point, this sort of small discrepancy could easily dissuade Cheng from continuing to participate in this sharing arrangement. A better alternative might have been to measure the number of hours or percentage of total time on this project attributable to gathering information specifically on Duncombe residents. And yet, the additional time and effort to gather that information might far outweigh the benefit of more precise cost allocation. This is a small scale example but it illustrates that every cost allocation basis comes with trade-offs that all the parties involved must understand and agree to up front.
Cost Sharing Alternatives
Traditional cost allocation works best when it’s possible to observe where and when and where all the costs are incurred. When that information is not available, as is often the case for partnership arrangements that span multiple organizations, there are several alternative other ways to organize a cost allocation plan. To illustrate, assume the full annual cost of HPM was $800,000, and that Cheng County must bill Duncombe County for Duncombe County’s share of those costs.
- Equal share. Total costs are divided equally across all participating partners. This is more typical for informal and arrangements. It’s also common for preventative services and other activities where it’s not clear who “receives” or “uses” the service, or to observe all the relevant indirect costs in a predictable and consistent way. That said, in equal share approaches one partner often subsidizes the other, sometimes unknowingly. In the HPM example, Cheng would keep $400,000 of the costs and bill Duncombe its equal share of $400,000.
- Per capita. Total costs are divided by the proportion of the population that resides in each partner jurisdiction. This approach is good for services without an observable “client” or discrete individual services. It’s less useful when population size is not the best cost driver, or when the populations involved are different on some key characteristic that might affect utilization of the service in question. Per capita sharing is often the most transparent way to share costs. In the HPM case, recall that Cheng’s population is 240,000 and Duncombe’s population is 160,000. In other words, 60% of the population served resides in Cheng and 40% resides in Duncombe. Under a per capita model, Cheng would bill Duncombe $320,000.
- Cost Plus Fixed Fee. Personnel costs are often step-fixed cost, and it can be quite challenging to know when those costs will “step up” a higher levels of service delivery. To account for that uncertainty, some cost allocation strategies call for non-weighted cost sharing plus some fixed periodic fee. The fee part of the plan is designed to buffer the sharing arrangement against the uncertainty that surrounds step-fixed costs (more on this below). For HPM, one potential application of this method would be for the counties to share costs per capita, but for Cheng to receive an annual payment of $35,000 at the start of its fiscal year to compensate in advance should it need to hire an additional nurse during the year. The cost plus fixed fee model also can be used in an arrangement where the overhead for having the service – space, utilities, administration, accounting, etc. – would be shared one way, such as equally, and incremental costs, such as those for lab work or medical supplies, are charged based on volume.
- Ability to Pay. Some cost allocation arrangements are designed to make a service available where citizens and clients are otherwise not able to pay for it. In these cases it makes sense to allocate costs according to ability to pay. We can measure ability to pay through assessed property values, median household income, or some other measure of relative wealth. In the HPM example, consider the following scenario: Duncombe’s median household income is $50,000 and Cheng’s is $40,000. Duncombe has a smaller population but is wealthier. In this case, the ratio of Duncombe’s median household income to Cheng’s is 1.25 ($50,000/$40,000). This is commonly known as a wealth factor. Recall that an equal share allocation is $400,000 for each jurisdiction. If that equal share is adjusted by the wealth factor, then Duncombe’s share is $400,000 X 1.25, or $500,000, and Cheng’s is $300,000.
- Prevalence. In this method, the parties share costs according to the prevalence of the public health problem the service is designed to address. In the HPM example, the partners could share the total program costs according to observed instances of diabetes or heart disease. The logic here is simple: diabetes and heart disease tell us something about the expected number of people with hypertension. If the prevalence of the disease is not known, the partners can use a proxy, like socioeconomic status, to project the anticipated need for services in each population. In the HPM example, Duncombe’s higher overall wealth suggests its residents are at lower risk for hypertension compared to Cheng residents. Sharing by prevalence adds substantial complexity because cost sharing is now based on data from a series of measurements not directly related to costs. In this case, those measurements are the incidence of disease or an indicator of socioeconomic status, which can be difficult to measure reliably, and other health related behaviors like smoking or medication adherence. That said, this approach is especially good where population, property values, income, and other measures vary too much among sharing jurisdictions to offer meaningful comparisons. To apply it in his example, assume that Cheng will have an estimated 12,740 cases of type 2 diabetes during the coming year, and Duncombe County will have an estimated 5,460 cases. This strategy considers each county’s share of the total incidence across both counties. According to that logic, 70 percent of the total cases will be found in Cheng, and 30 percent in Duncombe. Allocating costs this way leads to a share of $560,000 for Cheng and $240,000 for Duncombe. Some versions of prevalence also incorporate a moving average so that one community does not incur huge costs in a single year, and costs are instead recovered over time.
- Weighted formula. This plan addresses some of the big problems with the per capita sharing approach. For example, in a weighted formula approach, the participants might agree to share total costs according to a combination of population, median household income, usage, and other factors. By incorporating these other factors, the cost apportionment method will better reflect differences in fixed costs in urban vs. rural areas, differences in travel distances within each county, and other factors that affect service delivery costs. For HPM, assume that Cheng and Duncombe decide to share HPM costs according to a three-factor formula that incorporates population, ability to pay, and prevalence of type 2 diabetes. This formula reflects both counties’ shared understanding of the cost structure and cost drivers of the HPM program. The counties, realizing the difference in the prevalence of type 2 diabetes, agree to more heavily weight that difference in prevalence in the cost sharing formula. They agree to a three-factor formula where population accounts for 25 percent, prevalence is 50 percent, and ability to pay is 25 percent of the total costs allocated to each county. Recall that Cheng accounts for 60 percent of the population served by HPM, and Duncombe accounts for 40 percent. At the same time, Cheng accounts for 70 percent of the prevalence factor and Duncombe for 30 percent. We would apply that formula as:
- Cheng County: $800,000 X ((.6 X .25) + (.7 X .5) + (.44 X .25)) = $488,000;
- Duncombe County: $800,000 – $488,000 = $312,000
Differential Cost Accounting
In the previous section we explained how to measure the full cost of a public service. Those techniques assume we’re measuring the cost of the service for a given level or volume of the service. Until now, for instance, we’ve assumed our hypothetical HPM program will serve 400 clients a year. But sometimes the more interesting question is: How do a program’s costs change if we deliver more or less of it? For instance, how does HPM’s cost per client change if we expanded it to 500 clients? Or restricted it to 300 clients? These questions sound simple, but they require careful attention to a different set of concepts. When we want to know how costs change in space and time, we turn to differential cost accounting. Differential cost accounting is, simply put, comparing how full costs change at different levels of output.
Cost Behavior
We know that what a service costs depends in large part on how much of it we deliver. This is broadly known as cost behavior. Every type of cost falls into one of three different cost behavior categories:
- Fixed costs do not change in response to the amount of service provided. In the HPM case the main fixed cost is the nurses’ salaries. They are paid the same regardless of the number of blood pressure screenings or other outputs they “produce.” Same for the counselor. They are paid the same salary regardless of the number of counseling sessions performed. Cheng County owns some of its own blood pressure screening equipment, so the costs of acquiring equipment costs won’t change even if the HPM program delivers a lot more blood pressure screenings. And so forth.
- Variable costs change directly in response to the amount of service provided. For the HPM program this might include copies and other office supplies needed to process physician referrals, or mileage required to travel to outreach sessions, among others.
- Step-Fixed or Mixed Costs have both a fixed and a variable component. In most cases a step-fixed cost is fixed over some range of output and then increases or “steps up” at some higher level of service volume. For example, if the HPM program grows substantially it might need to add additional nurses and counselors. If that happens the nurses’ and health counselor’s direct labor costs could be step-fixed costs. For instance, if the program grows enough to require an additional counselor, these salary and benefit costs will “step up” at a given level of program enrollment.
“Fixed Cost” can mean different things in different settings. For our purposes, it means a cost that does not change in response to the volume of service delivered. By contrast, cost accountants sometimes use fixed cost to describe a cost that does not change during a given time period. This is an important difference.
The figure below illustrates the these cost behavior concepts for a generic, hypothetical service. The horizontal axis is the quantity of service provided, and the vertical axis is total cost. The line at $50, represents a fixed cost. It does not change, regardless of the level of service provided. The triangle-marked line identifies a variable cost. Here we see each additional unit of service increases the total cost by $10, and that change is constant from 0 to 3 units of service. The line marked with squares shows a step-fixed cost. Here the cost is fixed at $20 from 0 to 30 units of service. Once we reach 4 units of service that total cost steps up to $40, where it stays fixed until seven units of service.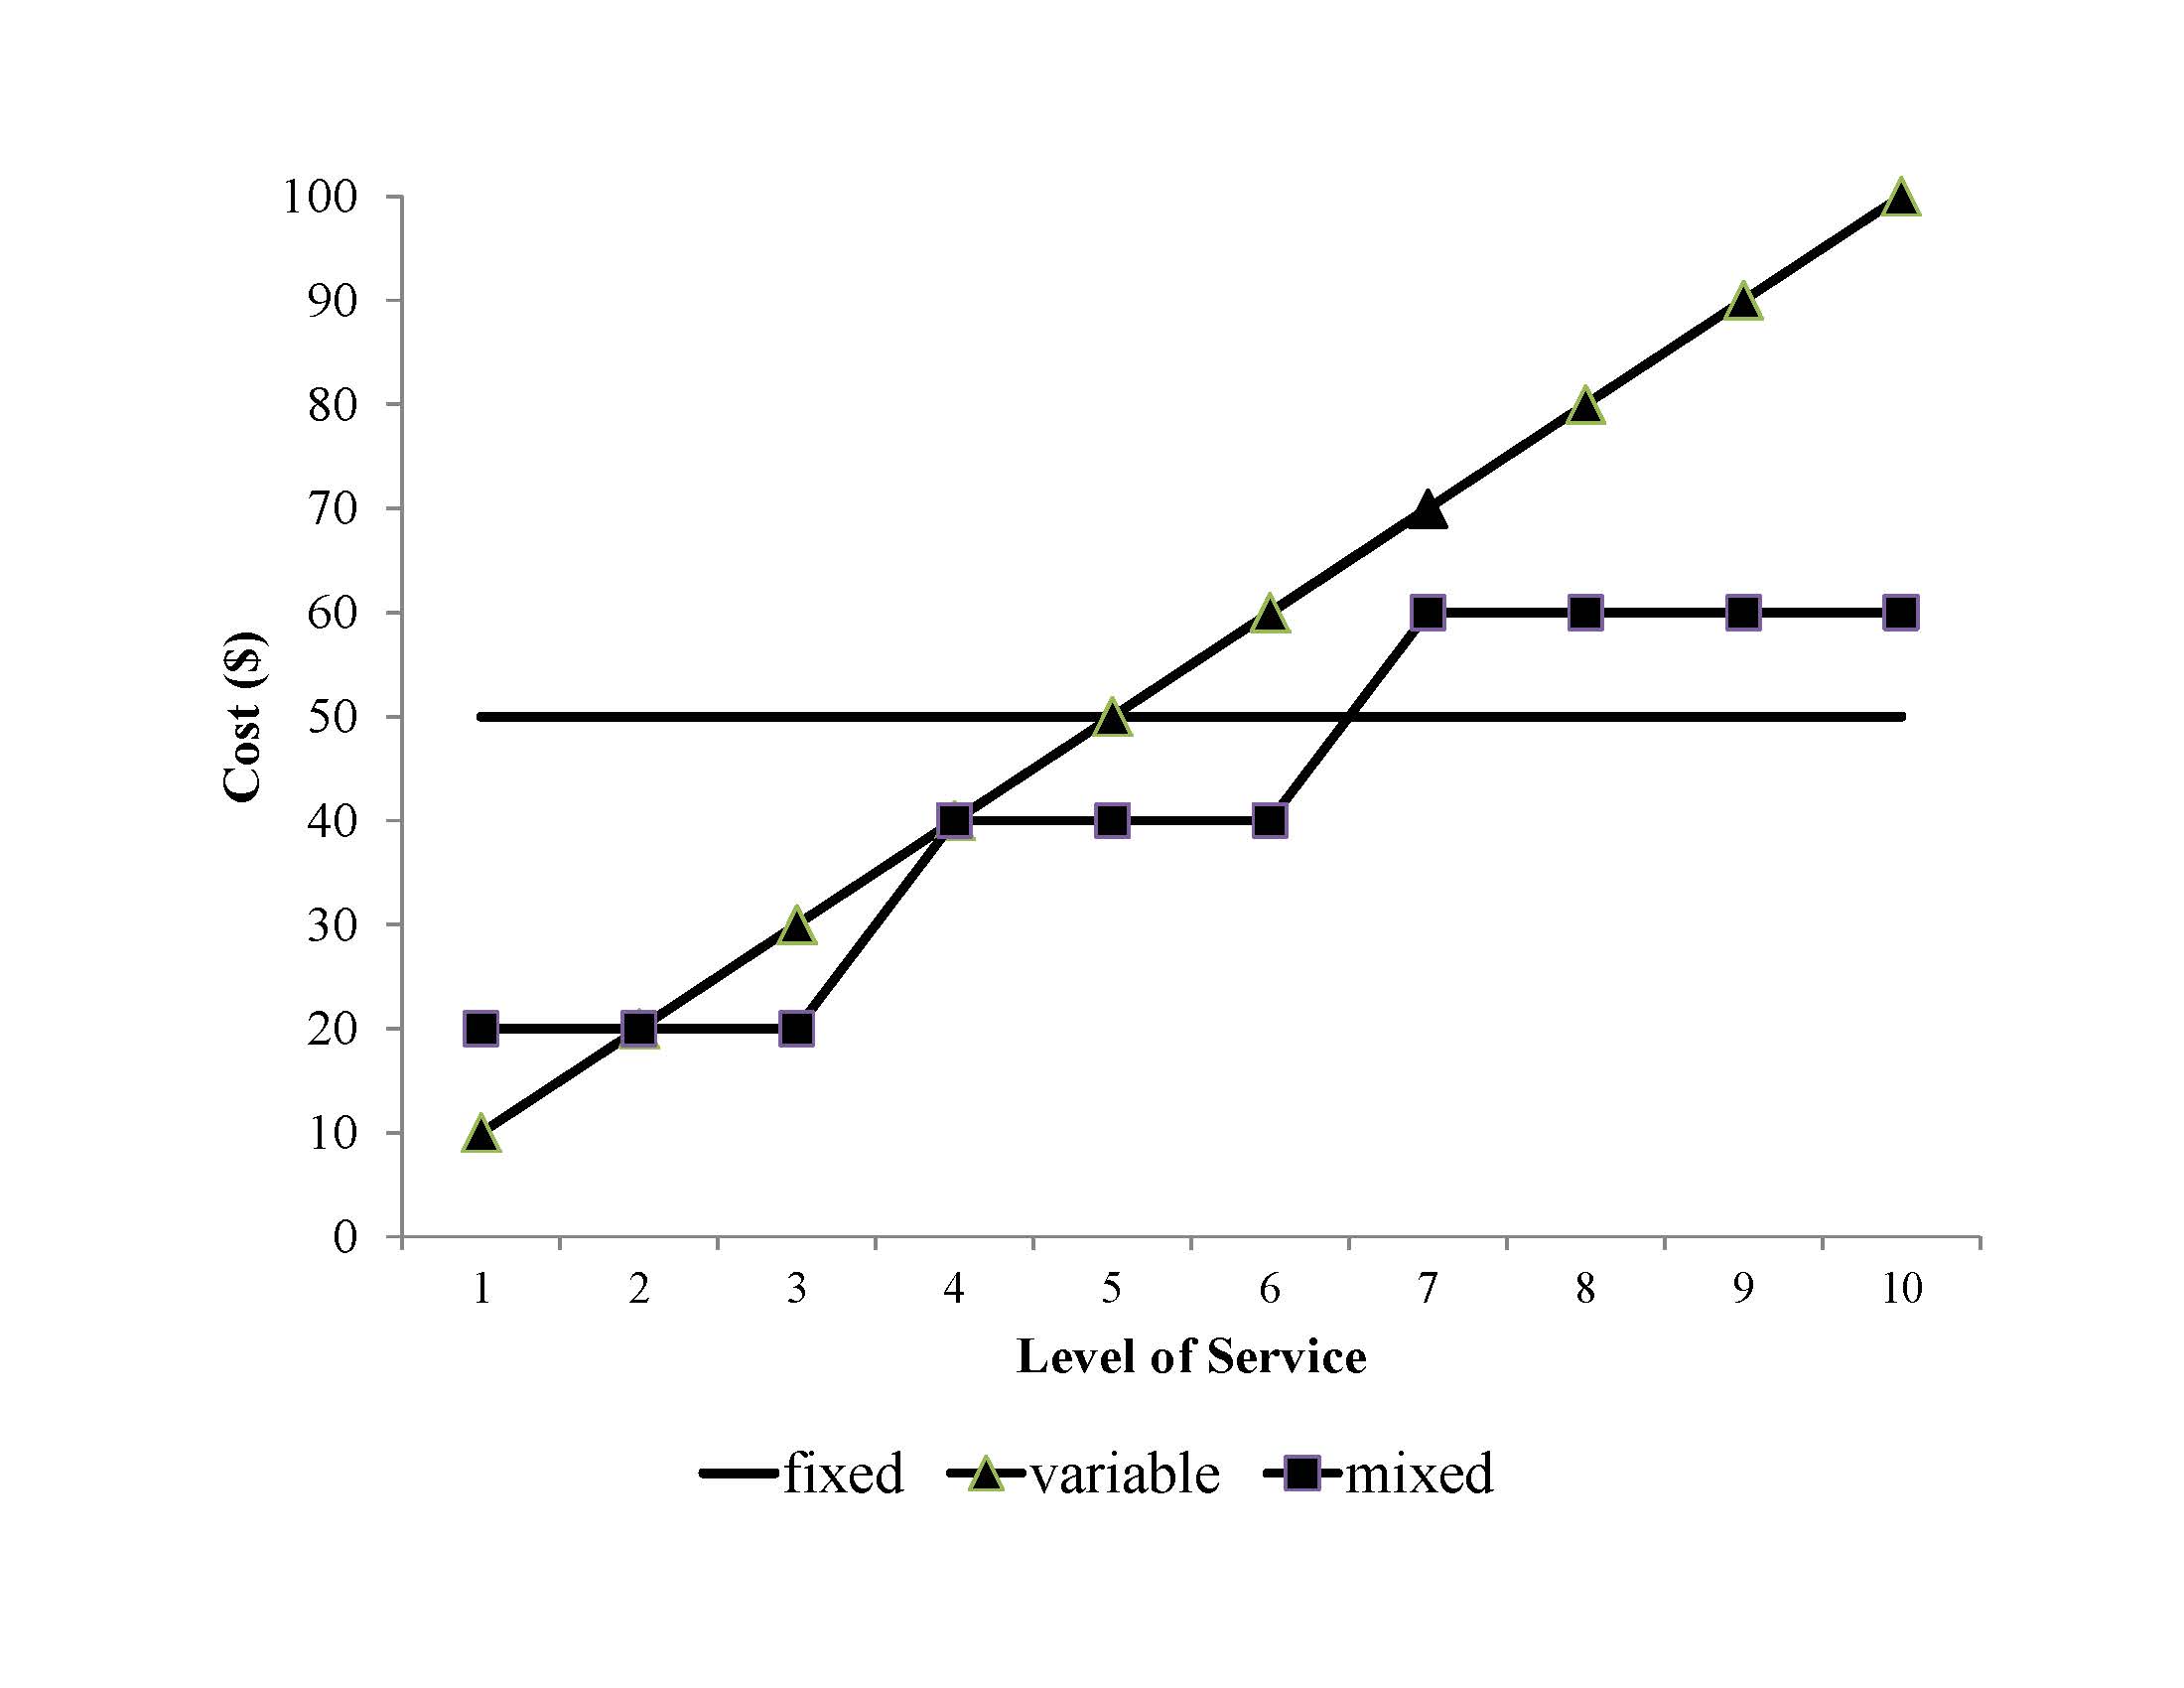 It’s useful to think about a program or service with reference to these main cost behaviors. In fact, we can place most programs/services/organization units into one of six cost behavior categories. Those categories are outlined below, along with examples of each from typical non-profit organizations and government programs.
| Direct | Indirect | |
| Fixed | Typical cost items: Salaried program staff; Program-specific facilities
Programs with this cost structure tend to:
Example program: Drop-in center for homeless youth |
Typical cost items: payroll services, facilities maintenance
Programs with this cost structure tend to:
Example program: Development/fundraising staff at a large non-profit |
| Variable | Typical cost items: Program-specific inventory, equipment, or goods used by specific program participants
Programs with this cost structure tend to:
Example programs: Food banks, county prosecutor home detention programs (i.e. “ankle monitors”) |
Typical cost items: inventory, equipment, commodities
Programs with this cost structure tend to:
Example program: Procurement staff within a non-profit hospital |
| Step-Fixed | Typical cost items: Hourly program staff, shared facilities or equipment
Programs with this cost structure tend to:
Example program: Non-profit after school daycare program |
Typical cost items: liability insurance, shared facilities
Programs with this cost structure tend to:
Example program: Employee assistance program at a non-profit hospital |
It’s immensely helpful to think about cost behavior when we have to make decisions about how to design and fund programs. Consider this simple example based on the previously-mentioned HPM program.
HPM staff have some rough budget projections for FY2017. Their program is expected to incur fixed costs of $800,000 and variable costs of $400 per client. The program has expanded a lot since it launched, and it now expects to serve 550 clients, but could serve up to 600 with current staffing levels. Meanwhile, nearby Matkin County has offered to pay $750/client to expand the program to include an additional 50 Matkin County residents. Should Cheng and Duncombe counties agree to partner with Matkin County on these terms?
HPM’s cost behavior is outlined in the table below. Given its projected fixed and variable costs, at 550 clients the average per client cost is $1,855. If HPM scales up to serve 600 clients, its average cost will decrease to $1,734/client. However, that average cost of $1,734 is still much higher than the $750/client that Matkin county offering. On the basis of “average” unit costs, this proposal is a definite “no go” for Cheng and Duncombe.
| # of Clients | Fixed Costs | Variable Costs | Total Costs | Average Cost/Client |
| 500 | $800,000 | $200,000 | $1,000,000 | $2,000 |
| 550 | $800,000 | $220,000 | $1,020,000 | $1,855 |
| 600 | $800,000 | $240,000 | $1,040,000 | $1,734 |
However, keep in mind the relationship between fixed and variable costs. Recall that HPM staff have said they can add 50 more clients without taking on additional fixed costs. If that’s true then the new cost to add a client is only the additional variable cost. Put differently, the average cost of each client is $1,734, but the marginal cost, or the cost of a new client, is $400. If HPM is reimbursed $750/client, the additional “profit” is $350. If HPM makes this decision “at the margin,” or with reference only to the marginal cost, it should take the deal with Matkin County. This is a good example of a service with a positive economies of scale; the marginal cost of each unit of service decreases as the volume of service delivered increases.
Of course, there are trade-offs here. At 600 clients the HPM program will operate at full capacity. HPM staff will almost certainly have to spend less time with clients. This could lead to a decline in the service quality, and could even increase staff burnout and turnover. But if we look just at the marginal cost, it makes sense for Matkin County to join the program.
This example also illustrates the key concept of sunk costs. Many fixed costs are for capital items like equipment, land, and buildings that can be bought and sold. A public health department can, in concept at least, recover some of those costs by selling those capital items. However, HPM’s spending on employee salaries, training, insurance, and many other costs cannot be recovered. Those costs are sunk.
Some economists argue that sunk costs ought to be irrelevant to future decisions. In other words, at the margin, all that matters is the future, measurable, variable costs. Of course, this is difficult in practice. In the HPM case, scaling up to full capacity will mean additional stress on staff, and perhaps more important, it would mean giving up the opportunity to take on additional clients without taking on additional fixed costs. These costs are much harder to measure, but they are key components of decisions about cost sharing. The key takeaway here is that when considering a service sharing arrangement, be sure to consider both the marginal costs, and the opportunity costs.
Cost-Volume-Profit Analysis
So far we’ve reviewed how public managers can identify the full cost of their services, and how that full cost changes as they deliver more or less of a service. Those are crucial questions that all good managers can answer.
However, public managers must often confront a different question: What should we charge for this service? They’re also routinely asked a corollary question: What volume of service should we deliver, given that service’s cost structure?
To answer these questions we turn to a particular set of concepts within differential cost accounting, known as cost-volume-profit analysis (CVP). CVP is how an organization determines the volume of activity needed to achieve its profit or mission goal, the price it needs to charge to achieve its profit or mission goal, or the cost limits that it must manage within to achieve its profit or mission goal.
CVP analysis is usually done for a particular program or service within an organization. The basic equation is:
Profit = Total revenue – Total costs
From this discussion so far we also know that total costs = Fixed costs + Variable costs. And since fixed costs are fixed, we can represent the cost equation as:
TC = a + bx
Where TC = total costs, a = fixed costs, and b = variable costs. We also know that total revenue is simply the price of a service (p) times the volume of service delivered (v). That said, we can show the fundamental profit equation as:
Profit = px – (a + bx)
For any service, the break-even volume is the point at which total revenue (px) equals total costs (a + bx). To illustrate how we use this formula, let’s go back to the Environmental Health Department’s copier. Assume for the moment that the county government’s leadership wants to make copying more affordable, so it caps the price of copying at 7 cents per copy. At that price, how many copies must the copier center deliver each year to break-even. In other words, what’s its annual break-even volume?
We know that the copier cost center’s fixed costs (a) include $6,000 for the machine rental, $900 for machine maintenance and $1,500 for its space allocation. Let’s also assume electricity and the office manager’s time allocation are fixed costs of $180 and $100, respectively. So total annual fixed costs are ($6,000 + $900 + $1,500 + $180 + $100) or $8,680.
Variable costs (b) are the largest cost items. Recall that last year the copier made 248,000 copies. Total paper costs were $10,000, so the per copy cost for paper is ($10,000/248,000), or $.04/copy. Total printing cartridge costs were $2,700, so the per copy cost for printing cartridges was ($2,700/248,000), or $.011/copy. These two variable costs together give us total variable costs of $.051/copy.
At break-even, profit = 0, so we can re-arrange the fundamental profit equation to px = a + bx. Since the price per copy is capped, per management’s policy, at $.07, we can then express this equation as .07x = $8,680 + .051x. To solve, we first subtract .051x from both sides, so we’re left with .019x = $8,680. To solve for x we divide both sides by .019, and we’re left with x = 456,842. In other words, at 7 cents per copy, the copier cost center’s break-even quantity is 456,842 copies. That’s nearly twice as many copies as it produced in FY2015. Management might want to rethink this decision.
Note that we can also express break-even quantity as a/(p-b). Arranged this way, the previous quantity is $8,680/($.07 – $.051), or $8,680/$.019 = 456,842. The quantity (p-b) is the contribution margin, or how much price exceeds variable costs. Break-even quantity is, in some ways, finding how many units of volume we need to spread the contribution margin across to arrive at break-even.
Let’s ask a different question. Assume for the moment that the copier technician says the current copier is aging and will likely break down if asked to make more than 150,000 copies per year. At that volume, how should the copier cost center adjust its prices so it continues to break even?
Here we re-arrange the formula once again, this time as p = (a/x) + b. In other words, the break-even price is the fixed costs divided by the volume, plus the variable cost per unit. For the copier cost center this is ($8,680/150,000) + $.051, or (.0579 + .051) = .1089. Put differently, if capped at 150,000 copies, the copier cost center would need to charge 10.89 cents per copy to break even. Once again, management should take a careful look before implementing this policy.
The copier cost center is a useful illustration, but it’s also an outlier because most of its costs are variable costs. This is typical in for-profit manufacturing, logistics, and other industries, but atypical among public organizations. For a more common public organization example let’s return to the HPM program.
Recall from earlier that HPM has estimated fixed costs (a) of $800,000 and variable costs (b) of $400/client. Say HPM’s management wants to keep the program relatively small to ensure a quality service, so it decides to limit its enrollment to 400 clients. At that volume (x), its break-even price is ($800,000/400) + $400, or $2,400/client. If management is willing to expand enrollment to 500 clients, the break even price becomes ($800,000/500) + $400, or $2,000/client.
In another CVP scenario, management reports that governments and philanthropies will pay a maximum of $1,800/client to participate in the HPM program. At that price, what is HPM’s break-even quantity? Once again, the formula is a/(p-b), or $800,000/($1,800-$400), or 571 clients. To break even at that comparatively low price and contribution margin ($1,800-$400, or $1,400) the program will need to serve substantially more clients than it has served recently.
The table below summarizes these various cost-volume-profit calculations.
| Calculation | Formula | Question the Calculation Answers |
| Break-Even Price | (a/x) + b | At a given level of service, at what price per unit does total revenue equal total costs? |
| Break-Even Quantity | a/(p-b) | How many units do we need to sell at a given price to ensure that revenue equals total costs? |
| Contribution Margin | p-b | By how much does price exceed variable costs? |
| Note: For all formulas p = price, x = quantity, a = fixed costs, b = variable costs | ||
CVP is a powerful tool that can directly illuminate many important management decisions. Most CVP today is done in spreadsheets to allow for maximum flexibility when exploring alternative cost scenarios, especially when analyzing services with step-fixed costs. That said, it’s still important to understand the basic concepts.
Cost Analysis and Flexible Budgeting
Once we’ve identified a program or service’s cost structure, we can take our first steps toward preparing its budget. A budget is simply a plan for what an organization wants to accomplish, and the resources it will use to accomplish it. Public organizations’ budgets are particularly important. For state and local governments, the budget is the law. It describes the taxes and other resources the government intends to collect, and since taxpayers must pay those taxes, it follows that the government must spend those resources in accordance with the budget. Recall from the earlier discussion that the budget is one of citizen’s most important tools to hold their government accountable. That’s why. Non-profits’ budgets don’t have the force of law, but they’re also critically important. Why? Because if a non-profit deviates substantially from its budget, its funders and donors will question its ability to make good on its promises and accomplish its mission.
Budgets are made and organized many different ways (see the next chapter). But regardless of an organization’s overall budget process, effective cost accounting is paramount to effective budgeting and management, particularly at the program or service level. Public managers must know what portion of the costs for which they’re responsible are fixed, variable, and step-fixed. They must also understand how different cost items connect to service delivery outputs, and how their cost center is assigned indirect costs. And perhaps most important, they must understand how their program’s cost structure and cost behavior will change under different performance scenarios. That’s why the best budgets are flexible budgets. A flexible budget allows a manager to quickly and easily perform sensitivity analysis to explore how changes in key cost assumptions affect a program’s unit costs, total costs, and service-delivery volume.
Flexible budgeting follows a basic four step process:
- Identify types of output or activity. Sometimes those levels of activity correspond to cost centers. Sometimes they’re related to programs or “lines of business” within cost centers. Sometimes they correspond to entire departments or divisions, especially if that department or division delivers a single good or service.
- Collect cost and price data. For most budget-making the best source of data on costs and prices is last year’s budget. Unless you’re tasked with developing a budget for a new service (and some day you will!), pay careful attention to past budget trends. There are two basic types of costs reflected in most public organizations’ budgets: operating costs and capital costs. Operating costs are costs incurred through the organization’s regular, year-to-year activities like salaries, benefits, and training. Capital costs are related to capital assets like property, equipment, and buildings. Recall that the portion of a capital asset that’s “used up” each year is reflected in the organization’s depreciation expense.
- Classify inputs. Every organization classifies its cost inputs a bit differently. For a simple budget it’s appropriate to classify the spending inputs in broad objects of expenditure like “salaries” or “commodities,” and to call the revenue inputs “service revenues,” “fees,” or some other appropriate broad label. Some organizations prepare budgets using the same chart of accounts used to prepare the basic financial statements. Others have much more detailed budget item codes to identify specific types of budget inputs. The key to a classification scheme is that it’s consistent as possible. Once you make a budget with it, make every budget with it.
- Develop a cost rate or unit cost for each key budget input. A cost rate is a measure, usually expressed as a unit of time, of the resources needed to staff a service. A unit cost is the cost to acquire or produce a unit of a good or service.
For most public organizations personnel costs are the largest and most visible budget inputs. That’s why effective budgeting for public organizations starts, and often ends, with careful attention to budgeting for personnel. So let’s illustrate this four step process with a personnel budgeting example.
Oz County just elected a county executive who ran on a “tough on crime” platform. On his first day in office the new executive asks his budgeting staff to figure out what it will cost to add three new sheriff patrols. From past budgets the staff can make a few assumptions:
- Patrols are for 24 hours/day, 365 days/year.
- The Sheriff’s union contract species that each patrol must have 2 officers per patrol car, and that officers will work 8 hours per day, 5 days per week. All sheriffs also receive three weeks of vacation and 1 week of sick leave per year.
- Also assume that cars will be staffed with two officers.
- The average patrol officer salary is $31,472, and benefits account for an additional 30% of each officer’s salary.
These figures suggest that, like with most personnel budgeting, we ought to think about a cost rate as a unit of staff time required to deliver the services. Many personnel budgeting scenarios are based on hours of staff time. In this particular scenario let’s go with the number of patrol hours needed to staff a complete shift. From there, we can determine how many officers we need, and how much to budget for those officers.
Those calculations are as follows, based on the assumptions outlined above:
- Three shifts per patrol X 3 patrols per day X 2 officers per car X 365 days = 6,570 shifts per year
- 6,570 shifts per year X 8 hours = 52,560 patrol hours per year
We then determine the number of hours or shifts one patrol officer can provide:- 52 weeks per year X 5 days per week = 260 potential shifts
- 4 weeks per year X 5 days per week = 20 vacation/sick leave days per year
- 260 days – 20 non-work days = 240 labor days X 8 hours = 1,920 hours per year
- Calculate the required number of full-time officers = 52,560 additional hours/1,920 hours per officer per year = 27.38 officers; round up to 28 officers
To budget for these new officers we can assume:
- Salary costs: 28 officers X $31,472 = $881,216
- Benefit costs: $881,216 X .3 = $264,365
- Total costs = $1,145,581
In other words, this budget analysis suggests Oz County will need to hire 28 additional officers to staff the executive’s desired three new shifts, and those 28 officers will require $1,145,581 in new budgeted spending. Ideally, you’d prepare this analysis in a flexible, spreadsheet-based, budget that allows you to quickly explore new scenarios from different assumptions.
What about a scenario where most of the key input items are variable costs? Here we’d use the unit cost method. The steps for that method are as follows:
- Project the demand for the service
- Estimate the resources consumed per unit of output
- Determine the average cost per unit of output
- Multiply these three items together to determine the appropriate budgeted amounts
To illustrate, let’s return to the HPM program and focus on the counselor’s travel costs. Recall that the counselor travels to deliver outreach programs on healthy eating and active lifestyles, all designed to prevent hypertension among Cheng and Duncombe County residents. Let’s assume that for the coming fiscal year the number of programs will be a bit lower than in previous years, but robust nonetheless:
- HPM staff project 175 outreach programs
- The average mileage per outreach program is 75 miles, and the rate per mile is $.325
- 175 programs X 75 miles per program X $.33/mile = $4,331
In this case, the unit cost” and the object of expenditure” are the same thing – individual outreach programs. And once again, we’d ideally set this analysis up as a flexible, spreadsheet-based budget.
Budget Variance
The difference between actual results and budgeted results is known as a budget variance. Effective public managers understand when, where, and why variances happen. They also use insights from variances to identify inefficiencies and other current management concerns, and how they make future budgets.
The simplest variance analysis approach is to compare budgeted expenses to its actual expenses. For example, suppose the HPM program budgeted $759,000 for FY15, but actual spending for the year was $789,000. This would be a total variance of ($759,000/$789,000) = .962, or 96.2%. In other words, budgeted spending was only 96.2% of actual spending. This is a negative variance or unfavorable variance of 3.8%, and it directs HPM’s management toward a few important questions about HPM’s operations. Did HPM serve more clients than expected? Did it spend more than expected on variable costs like mileage or supplies? Was the contract for communications and outreach properly structured? Are its indirect cost allocations fair and consistent with its actual operations? To address these questions, of course, it would help to compute variances on individual line items (known as line item variances). Larger organizations often compute department variances.
Revenue-side variances demand a different type of interpretation. Imagine, for instance, that HPM budgeted for revenues of $800,000 but collected $750,000. The variance here would be ($800,000/$750,000) = 1.0667, for a negative variance of 6.667%. Here Cheng County’s HPM’s management should ask a different set questions. For instance, is HPM collecting all of its revenues? Is Duncombe County slow in reimbursing Cheng County?
Positive variances beg a different set of questions. For example, say HPM’s total spending was just $700,000, compared to its budgeted spending of $759,000. This variance is ($759,000/$700,000) = 1.084, for a positive variance of 8.4%. But what does positive mean here? Was management able to drive down costs and deliver the expected volume of service at lower overall costs? Or did it not deliver as much of the service as expected?
Cost Structure and Management Strategy
By now it should be clear that the principles of cost behavior, differential cost analysis, and cost sharing suggest a variety of management strategies. For instance, for organizations with mostly fixed costs one of the best approaches to manage costs and bolster profitability is to “scale up.” Since fixed costs are fixed, one way to manage them is to spread them across the largest possible volume of service. However, for organizations with mostly variable costs, scaling up will simply increase variable costs. The better approach in that circumstance is to invest in new technology, procurement processes, or other strategies that can drive down variable costs. With the core principles of cost analysis established, it becomes clear how a public organization’s cost behavior might be most effectively managed.
It’s also essential to consider how an organization’s financial management strategy is contingent on the parts of its cost structure it can control. Or in other words, how much of its costs are direct and under the control of its management, and how much of its costs are indirect and assigned to it by management? For example, organizations with mostly direct costs often find themselves “scrubbing expenses” (see the previous chapter) because they have the authority and ability to affect those costs. However, organizations with mostly indirect costs are more likely to partner with other organizations as a way to leverage economies of scale, diversify their potential customer/client base, or access new technologies or processes they might not have the authority to pursue on their own.
When we consider these two main parts of an organization’s cost structure – direct vs. indirect, and fixed vs. variable vs. step-fixed – we begin to see a set of attenuated management strategies. The table below lists some of those strategies.
| Main Cost Behaviors | Direct | Indirect |
| Fixed |
|
|
|---|---|---|
| Variable |
|
|
| Step-Fixed |
|
|
For example, in the bottom left section we see financial management strategies commonly employed by organizations with primarily direct, step-fixed costs. For these organizations, the key is managing work flow. As their volume increases, so do their fixed costs. In turn, many organizations of this type work to spread their fixed costs within whichever step their fixed costs currently stand. That means maximizing staff to client ratios at all times, including queuing up clients with waiting lists or staggered enrollments before hiring new staff. Since most of those costs are direct, organizations of this sort have the latitude to employ these strategies.
By contrast, organizations with mostly indirect costs may not have the ability to enact new enrollment management policies. They must also “manage the step,” but for them the better strategy is to narrow or limit the scope of services, or to find new clients that can lead to more predictable enrollment patterns. In short, managing direct, step-fixed costs is quite different from managing indirect, step-fixed costs.
This table is by no means a comprehensive list of strategies, but it does orient you toward the interesting and nuanced relationship between cost structure and financial management strategy.
Practice Problems
- Re-review the financial statements for the Safehouse from Chapter 3. Identify two examples of each of the following types of costs for Safehouse’s Transitional Housing Services program:
- Direct, fixed
- Direct, variable
- Direct, step-fixed
- Indirect, fixed
- Indirect, variable
- Indirect, step-fixed
- The fixed costs of running a fund-raising gala for the Wenatchee Symphony are $10,000 and the variable costs are $75 per attendee. The facility where the event is being held can accommodate 400 people. What is the minimum amount the Wenatchee Symphony can charge for a ticket and still break even? Assuming 400 people attend the gala, how much does the Wenatchee Symphony have to charge for each ticket for the Symphony to earn $20,000? If the Symphony received a donation of $2,000 its break-even ticket price for the gala would increase, decrease, or stay the same?
- The Pacific Northwest Ballet has $5,000 in fixed costs per performance, plus an additional $10 per attendee on ticket and program printing and other supplies. The normal auditorium can seat 300 people, and if more than 300 attend they must use the expansion seating area for an additional cost of $500. Suppose the program sets its break-even price based on expected ticket sales of 200 attendees per performance. What is their break-even price?
- The Feed-A-Child Foundation wants to start a new program which will have $30 in variable costs per child and fixed costs of soliciting donations to fund the program of $10,000. If each donor were to give FAC $50, and each donor feeds one child, how many donors would FAC need to break even?
- The housing director for the City of Coho, WA is working on a new affordable housing project. The Fixed Costs are $300,000 for the project, and Variable Costs are $250 each time a family moves into an apartment at the facility. The Coho project now has 2,500 move-ins per year. A new federal government subsidy would pay $300 for each of 500 move-ins if the project expand to 3,000 units. Should Coho take the additional tenants? Why or why not?
- The Iron River Transportation Agency (IRTA) has two service departments (maintenance and administration) and two mission departments (rapid transit and para-transit). Rapid transit uses high-speed trains and is highly equipment-intensive, while Para-Transit uses mopeds and is far more labor intensive. Management has decided to allocate maintenance costs on the basis of depreciation dollars in each department, and administration costs on the basis of labor hours worked by the employees in each department. The following data (dollar amounts in thousands) appear in the agency’s records for the current period. Allocate the service center costs to production centers using the step-down method, and determine the relevant total costs. Begin with the maintenance department. To what use would you put this information?
Service Centers Mission Centers Maintenance Administration Rapid Transit Para-Transit Total Costs Direct plus distributed costs $1,160 $2,400 $8,000 $4,000 $15,560 Depreciation dollars $200 $2,000 $3,000 $800 $6,000 Labor hours $20,000 $10,000 $10,000 $40,000 - Given its cost structure, identify three near-term and one long-term financial strategy Safehouse should pursue to improve its financial position. Give a brief rationale for each proposed strategy.
- Re-review the financial statements for the Jonas Community Center from Chapter 3. Given its cost structure, identify three near-term and one long-term financial strategy JCC should pursue to improve its financial position. Give a brief rationale for each proposed strategy.
Case: Summer School
An independent summer school has been created by a local school district to provide remedial education. Summer school will serve students from the three regular high schools within the district, and will run for 3 months, from June 1 to August 31. Each high school has about 400 students (1,200 total). Each high school is expected to send 10% of their students to summer school, but of those sent, 1 out of 4 is expected to drop out of the program each month.
The state mandates that remedial summer school can have no more than a 15:1 student to teacher ratio. The school must also have one full-time administrator and 3 full-time office staff. Full-time means 8 hours per day, 20 days per month. The going wage rates are as follows: teachers make $25 per hour, administrators make $50 per hour, and each staff member makes $10 per hour. The school must provide a desk (at $200 each) for each student, teacher, administrator and staff member, and books at $100 per student. The school receives a $300 per month allowance for each student from the district, and a $5,000 one-time grant from a local philanthropic foundation.
Questions:
- Prepare a monthly, flexible budget for the Summer School for June, July, and August. What is the estimated surplus or deficit? What is the break-even price given your assumptions about expenses?
- Adjust your budget to account for two new assumptions: 1) You’ve learned that once hired, teachers cannot be let go for the summer; 2) change the drop out rate from 25% to 15%. How do these adjustments affect the estimated surplus or deficit?
Case: Caring for Coho’s Seniors
The (fictional) City of Coho (population 48,000) is a commercial and residential hub in the central region of the State of Washington. It has experienced steady population growth over the past ten years and is expected to add 8,000 new residents in the next two decades.
Many of Coho’s long-time residents have retired or are near retirement age. Coho’s current Mayor, Nevena Bailey, sees this trend as a strategic opportunity. She believes many young, talented people will soon have to care for elderly family members and friends. Building a high-quality “aging infrastructure” will, in her view, help attract new residents to Coho.
Bailey crafts a plan for the creation of Coho Adult Day Services, Inc. (CADS). Under the adult day services (ADS) model seniors live at home but spend a portion of each day at an ADS facility with relevant services like supervised recreation, educational programming, on-site nursing staff, and preventative health care. This model allows seniors to enjoy the benefits of independence but with a lesser burden on his or her caretaker(s). A few local non-profits provide these services but not on the scale Bailey has in mind.
To get the initiative moving Bailey persuades the city commission to subsidize CADS at an annual rate of $30,000. This annual payment will come from the City’s general fund. She also convinces Coho Memorial Hospital to donate a recently vacated outpatient clinic to house CADS. A construction manager who serves on the city planning commission says the facility can open immediately, but will require at least $80,000 in renovations during the first three years of operations to bring the building in compliance with regulatory codes. The renovated facility could accommodate 85 attendees, in his estimation.
The city commission also asks the City of Coho Finance Department staff to gather information needed to prepare an operating budget for CADS’ first year.
Staff collects the following information about the basic legal and financial requirements for operating an adult day services center. Federal and state regulations require one licensed nurse practitioner on the premises at all times and one licensed practical nurse (LPN) for every 10 attendees. Comparable facilities also have one certified staff assistant for every 20 attendees. These assistants do custodial work, assist with group activities, and handle other day-to-day tasks. The market wage for LPNs is $31.75/hour, and the wage for staff assistants is $12.50/hour. At most facilities the nurse practitioner also handles staffing, budgeting, and other administrative duties. A typical annual salary for this practitioner/administrator position is $86,000. Most facilities also employ a recreation coordinator at an annual salary of approximately $36,500. The recreation coordinator plans in-house activities, field trips, and other programs. On average, these additional activities cost $12.50 per attendee per day (including food, materials, transportation, and other costs).
The Coho City Commission stipulates that since the City is subsidizng the service, CADS employees should be included in the City’s health care and retirement plan (even though they will not be City employees). The average premium for City employees’ health insurance – regardless of the type of coverage, co-pays, and other differences – is $850/month. The City contributes $680/month, or 80% of the total cost, toward each employee’s premium. Employees pay the rest. The City must also contribute 6.5 percent of the wages for the practitioner/administrator, recreation coordinator, and LPN’s toward pensions and other post-employment benefits (OPEB). All employees receive two weeks paid vacation and three personal days.
The facility must be certified by the National Adult Day Services Association at a cost of $5,000/year. The practitioner/administrator and LPNs must also earn 50 continuing education units (CEUs) to maintain their individual certifications, and the staff assistants must earn 20. On average, LPN CEUs cost $25/credit and staff assistant CEUs are $15/credit.
The facility must also carry $5,000,000 in hazard insurance coverage. Local insurance brokers offer that coverage for $2,500/month. Individual employees must be trained and re-certified at an annual cost of $500 per employee. Water, electricity, wastewater, stormwater, trash collection, telephone, and other utilities are expected to cost $1,750 month.
The service will open in January 2017. Expected initial enrollment is 15 seniors. Enrollment is expected to grow 3.5% – compounding monthly – each month thereafter. The service will be available Monday through Friday from 8:30am-4:30pm.
Prepare the 2017 monthly operating budget for CADS and answer the following questions:
- What should CADS charge each attendee per month for the service to break even?
- How does the break-even fee change if enrollment grows instead at 1.5% per month? At 5% per month?
- Identify three strategies to reduce the monthly break-even fee (based on assumed monthly enrollment growth of 3.5%) by 15%. Explain the potential impacts of these strategies on the quality and effectiveness of CADS’ services.
- Many adult day service centers operate “extended day” programs for families that need care for additional hours in the afternoon. Design an extended day program for CADS that would provide care for 10% of CADS attendees from 4:30pm to 6pm. Prepare a program budget that separates the full-day program from the extended day program, and allocates relevant indirect costs to each. Based on your design and analysis, should CADS offer an extended day program?
Case: Snow Removal
Frank Lennard, supervisor of the snow removal department for the City of Hamtrammack, stared at the memo he had just received from the director of public works. The opening paragraphs were anything but reassuring:
“As you know, I have instituted a new responsibility accounting system. From now on you will receive quarterly reports that compare the cost of operating your department with your budget. The reports will highlight the variance so that you can easily zero in on any departures from your budget. Responsibility accounting means you are to keep the costs in your department within your budget. The variances will help you identify those costs that are out of line, and the sizes of the variances will indicate the most important cost items to address. Your first report accompanies this memo. Your report indicates that several of your costs are significantly above your quarterly budget. You need to pay particular attention to the salaries of your snowplow drivers. Please get back to me by the end of next week with a plan for making the needed reductions.”
Frank knew he needed a plan, yet midwinter was the busiest time of the year for snow removal, and a big storm had been predicted for the weekend.
Frank had been with the City for more than 20 years. previously, cost data had been presented to department heads only infrequently, but the new director was certain that more frequent information would provide greater incentives for his department heads to keep their costs under control. The new director had also prepared a budget for each department for the current fiscal year, and had computed quarterly budgets as one-fourth of each department’s annual budget. To prepare the budgets, he had analyzed the prior three years’ costs, and, in doing so, had learned that almost all of them had increased each year, with more rapid increases in the last two years. his first thought had been to establish the budgeted line items at an average of the prior three years’ costs, hoping that such an approach would encourage his department heads to reduce their operating costs to his level. However, in view of the rapid cost increases during the past two years, he chose instead to base the current year’s budget on the prior year’s costs less three percent. For the snow removal department, he also estimated the cubic miles of snow to be removed, which he set at an average of the past three years.
Lennard received the report show in Exhibit 1 in mid-January. He reflected on its content:
“Some of my costs don’t change, even if there’s a change in the cubic miles of snow we plow. On the other hand, drivers, supplies, fuel, and maintenance vary almost directly with changes in cubic miles. Shouldn’t my budget reflect this distinction? Also, my budget didn’t include my October salary increase – was I supposed to refuse it to keep my budget in balance? It’s also important to note that I had to pay overtime to the drivers because of some very heavy storms we had back in mid-December. Because of this, my average hourly rate for the whole three months was $21 instead of the $18 that was in my budget. In fact, and maybe this is a little picky, the average number of minutes it took my drivers to plow a cubic mile of snow during the quarter actually dropped from 48, which was my budget target, to 47. Somehow, even though it’s pretty small, I think this improvement should be taken into consideration.”
| City of Hamtrammack, Performance Report, Snow Removal Department, October-December | ||||
| Budget | Actual | (Over) Under Budget | % (Over) under Budget | |
| Snow Days (a) | 10 | 12 | (2) | (20%) |
| Cubic Miles of Snow (b) | 1,250 | 1,500 | (250) | (20%) |
| Costs: | ||||
| Drivers (c) | $18,000 | $24,675 | ($6,675) | (37%) |
| Supplies (d) | 1,125 | 1,874 | (750) | (67%) |
| Fuel | 1,750 | 2,500 | (750) | (43%) |
| Maintenance (e) | 1,375 | 2,200 | (825) | (60%) |
| Supervisor’s Salary | 15,000 | 18,000 | (3,000) | (20%) |
| Allocated Administrative Costs (f) | 4,000 | 5,000 | (1,000) | (25%) |
| Equipment Depreciation (g) | 1,250 | 1,250 | 0 | 0 |
| Total | $42,500 | $55,500 | ($13,000) | (31%) |
| Notes:
a. Days when there was at least one inch of snow. Less than that, and no snow plowing took place. b. Computed, for each storm, by multiplying the depth of snowfall (according to the official measure by the City Clerk) by miles of roadways to be plowed. c. Drivers were paid hourly, not by the mile. However, the number of hours needed to clear the roadways depended to a great extent on cubic miles of snow. For example, an inch of snow from a relatively light storm would take less time to plow, than six inches of snow from a moderate storm. The amount of time needed to clear the roadways also depended on the length of the storm. For example, if a storm deposited six inches of snow in a few hours, the drivers would wait until the storm had ended, and then clear the roads with one pass of the plows. However, if a storm deposited six inches of snow over, say, a 24 hour period, two or more passes of the plows would be needed to keep the roads clear. When a driver worked more than 8 hours in a 24 hour period, he/she was paid a 50 percent overtime premium for the additional hours. d. Mainly sand and salt. Office and other administrative supplies were part of the administrative cost allocation. e. Was almost directly related to miles driven. Thus, a 24 hour storm, requiring several passes, would lead to more maintenance costs than a storm of only a few hours, even if the cubic miles of plowed snow were the same. f. Based on the town’s full cost accounting system. The system used different allocation bases for different city services, such as custodial work, administrative salaries and supplies, and repairs and maintenance. g. Exclusively for snow plows. The department had no other assets to be depreciated. |
||||
Questions:
- What is your assessment of the method the public works director used to construct the budget?
- Prepare a flexible budget for the snow plowing department. what does it tell you?
- Compute the appropriate variances for drivers. What do they tell you?
- What plan should Frank present to the public works director for making cost reductions?
- For more on cost allocation methods for governments see several chapters in Zach Mohr, ed. (2016), Cost Accounting in Government: Theory and Applications (New York: Routeledge); also see the chapter “Cost Accounting and Indirect Costs” in Dittenhoffer and Stepnick, eds. (2007), Applying Government Accounting Principles (Lexis-Nexus Publishing). ↵