6 How We Pay for the Public Sector
WHERE THE MONEY COMES FROM, AND WHERE IT GOES
Managers need to know where public money comes from, and where it goes. That information can answer important questions like:
- What revenue options are available to governments? Non-profits?
- What are the advantages and disadvantages of various revenue sources with respect to efficiency, equity, fairness, and other goals?
- How will the US federal government’s financial challenges shape the financial future of state governments, local governments, non-profits, and other public organizations?
- What is the optimal “capital structure” for a non-profit?
- How, if at all, can governments address the challenges of entitlements and legacy costs?
In January of 2010 the United States Department of Justice (DOJ) received a formal civil rights complaint from a local community organization in the City of Ferguson, MO. In their complaint they accused the Ferguson Police Department of aggressive and biased policing tactics, including large numbers of traffic stops, searches, seizures, and arrests in the city’s African-American communities. DOJ officials corroborated the report with the Missouri Attorney General’s office, who had also received several similar complaints throughout the previous five years. Both offices agreed to monitor the situation.
On August 9, 2014, Michael Brown, a teenager and resident of Ferguson, was shot and killed by a Ferguson police officer who was investigating a nearby robbery. Ferguson police officials drew sharp criticism for the incident and for their management of the subsequent investigation into potential police misconduct. Several weeks later a grand jury later declined to indict the police officer. In their view the evidence suggested the police officer had reason enough to consider Brown a potentially dangerous suspect.
The shooting sparked violent protests across the US. Ferguson residents said the shooting was just the most recent example of the racist policing they had pointed out to federal and state officials years earlier. They implored Attorney General Eric Holder to immediately open a DOJ civil rights investigation into the Ferguson Police Department. Holder said his office would gather as much information as possible, but cautioned everyone that anecdotes and demographics are not sufficient to prove an accusation of biased policing. For several weeks, the country anxiously awaited word on what DOJ would do next.
On September 20, 2014 DOJ opened a formal civil rights investigation. The report from that investigation was released in March 2015. It excoriated the Ferguson Police Department and the Ferguson City Council for encouraging, both actively and passively, the sort of aggressive policing that Ferguson residents had decried. But perhaps even more important, it explained that the most compelling evidence of biased policing was not arrest records or police reports. It was Ferguson’s budget. The report said “Ferguson’s law enforcement practices are shaped by the City’s focus on revenue rather than on public safety needs.” It documented a recent trend toward raising new city revenues through aggressive enforcement of fines and fees. Ferguson generated more than $2.5 million in municipal court revenue in fiscal year 2013, an 80 percent increase from only two years prior. In all, fines and forfeitures comprised 20 percent of the city’s operating revenue in fiscal year 2013, up from about 13 percent in 2011. By comparison, other St. Louis suburbs relied on fines and fees for no more than six percent of operating revenue. This budget strategy legitimized and even encouraged Ferguson’s law enforcement and court officials, most of whom were not racists, to pursue such aggressive policing against Ferguson’s majority African-American community.
The take away here is clear: Where a public organization gets its money says a lot about its priorities. In Ferguson’s case, choices about where to get revenue led to a nationwide social movement.
Learning Objectives
After reading this chapter you should be able to:
- Identify the revenue sources used by the federal, state, and local governments.
- Contrast government revenue sources with non-profit revenue sources like donations and earned income.
- Identify public organizations’ main spending areas, and the division of that spending across the government, non-profit, and for-profit sector.
- Show how similar governments pay for similar services in quite different ways.
- Identify some of the “macro-challenges” that will shape public organizations’ finances well into the future.
Governments across the United States do the same basic things. Cities and towns mostly maintain roads, plow snow, keep neighborhoods safe, prevent and fight fires, and educate children. County governments run elections, care for the mentally ill, and prevent infectious diseases. State governments coordinate health care for the poor, incarcerate prisoners, and operate universities. The national – or “federal” – government regulates trade and commerce, defends our borders, and pays for health care for the elderly.
At the same time, governments are remarkably dis-similar in how they pay for and deliver these services. Some rely on a single tax source for most or all of their revenue. Others draw on many different revenue sources. Some deliver their services with the help of non-profits, health care organizations, private sector contractors, and other stakeholders. Others engage outside entities infrequently, if at all. Some citizens want their government to deliver many different high-quality services. Others want their government to do as little as possible.
These choices, about how governments pay for their services, how much they provide, and how they ultimately deliver those services, matter a lot to citizens. For instance, if a city government depends mostly on property taxes, its leaders might have an incentive to emphasize services that benefit property owners, such as public safety and sidewalks, and to worry less about services more likely to benefit those who do not own property, like public parks or housing the homeless. In some regions governments pay non-profit organizations to deliver most or all of the basic services in areas like foster care, child immunizations, and assisted living for seniors. For those who use those services, the quality of service they receive can depend a lot on which non-profit manages their case.
So at a high level, governments look the same. But if we examine them more carefully, we see they vary a lot on where their money comes from, and where it goes. That variation, and its implications for citizens, is a key part of the study of public finance. This chapter is a basic overview of where governments get their money, where they spend it, and some of the financial challenges they’re likely to face in the future.
The Federal Government
The national government – also known as the “federal government” – is one of the largest and most important employers in the United States. Every soldier in the military, customs agent at an airport, and astronaut at NASA (the “National Aeronautics and Space Administration”) works for the federal government. And so do many, many others. In 2015 the federal government spent just under $4 trillion and employed an estimated five million people, both directly and as contractors. For the past decade or so, federal government spending has accounted for roughly one-quarter of the entire economic output of the US.
The chart below shows where the federal government has received and spent its money since just before World War II. Areas shaded blue represent revenue, or money that comes into the government. Areas shaded red are spending items. Spending is called many different things in public finance, including expenses, expenditures, and outlays. These different labels have slightly different meanings that you’ll learn throughout this text. All the figures shown here are in per capita constant 2015 dollars. In other words, they’ve been adjusted for inflation, and they’re expressed as an amount for every person in the US.
Roughly 80% of the federal government’s revenue is from two sources: the individual income tax and social insurance receipts.[1]
- In 2015 the federal government collected just over $3,500 per capita from individual income taxes. The income tax an individual pays is determined by their taxable income, tax rate, and any applicable tax preferences. Taxable income is an individual’s income minus any tax preferences. The federal government offers a standard exemption, or a reduction of an individual’s taxable income, that all taxpayers can claim. Beyond that standard deduction, eligible taxpayers can claim hundreds of other exemptions and other tax benefits related to homeownership, retirement savings, health insurance, investments in equipment and technology, and dozens of other areas. Why does the federal government offer these preferences? To encourage taxpayers to save for retirement, buy a home, invest in a business, or participate in many other types of economic activity. Whether tax preferences actually encourage those behaviors is the subject of substantial debate and analysis (see the discussion later on tax efficiency and market distortions). The tax rate is the amount of tax paid per dollar of taxable income. In 2015 the federal tax code had seven different rates that applied across levels of taxable income (also known as “tax brackets”). Those statutory rates ranged from a 10% on individual annual income up to $9,225, to 39.6% on annual income over $413,201. An individual’s effective tax rate is their tax liability divided by their total income. If an individual claims a variety of tax preferences, their effective tax rate might be much lower than the statutory tax rate listed here.
- Social insurance receipts are taxes levied on individuals’ wages. Employers take these taxes out of workers’ wages and send them to the federal government on their behalf. That’s why they’re often called payroll taxes or withholding taxes. Social insurance receipts are the main funding source for social insurance programs like Social Security and Medicare (see below).
- The remaining 20% or so of federal revenue is from a variety of sources including the corporate income tax (taxes on business income, rather than individual income), excise taxes (taxes on the purchase of specific goods like gasoline, cigarettes, airline tickets, etc.), and estate taxes (a tax imposed when a family’s wealth is transferred from one generation to the next). As shown in the figure, these revenues as a share of total revenues have not changed much in the past several decades.
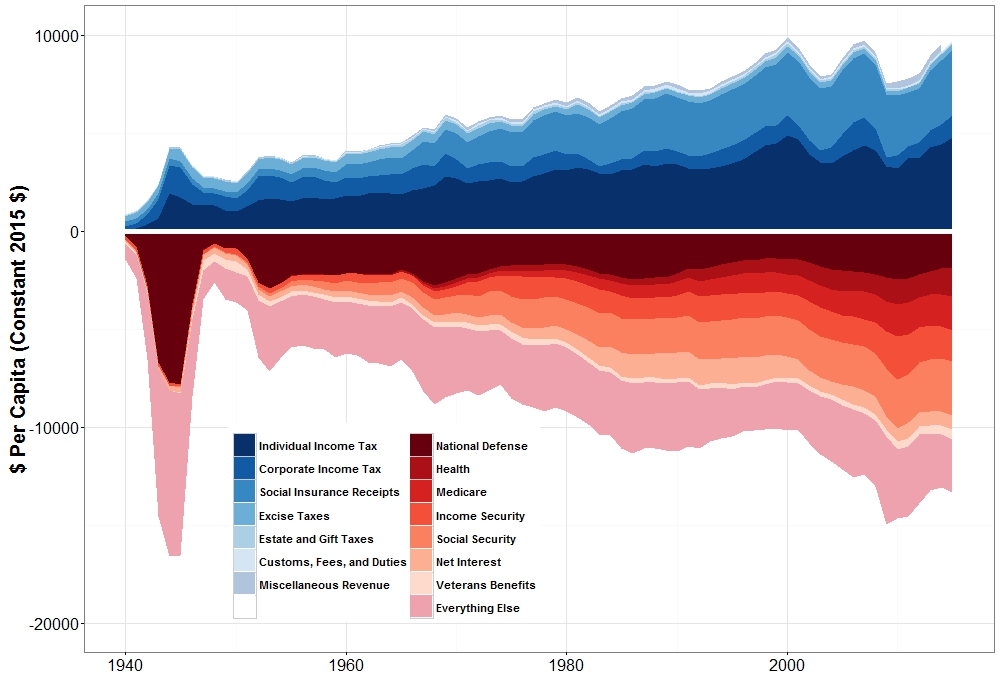
Federal Government Revenues and Outlays since 1940; source: authors’ calculations based on data from the Congressional Budget Office, the Office of Management and Budgeting, and the US Department of Commerce
Tax Preferences: Spending by Another Name
Tax preferences – sometimes called tax expenditures – are provisions in tax law that allow preferential treatment for certain taxpayers. They include credits, waivers, exemptions, deductions, differential rates, and anything else to reduce a person’s or business’ tax liability. Many are quite specific. For example, some states have reduced tax rates that apply only to particular employers, industries, or geographic areas. Tax expenditures are, in effect, a form of spending. They require the government to collect less revenue than it would otherwise collect. Some think they’re unfair because they offer targeted benefits but without the transparency of the traditional budget process. Proponents say that despite these drawbacks, tax preferences are essential to promote important behaviors, like buying a home or starting a business. At the state and local level they’re an especially important tool to attract and retain businesses in today’s competitive economic development environment.
Federal government spending is divided roughly equally across six main areas:
- National defense includes pay and benefits for all members of the US Army, Navy, Air Force, and Marines, and all civilian support services. It also includes capital outlays – or spending on items with long useful lives – for military bases, planes, tanks, and other military hardware. Note the large spike in national defense spending during World War II (1939-1945) and the Korean War (1950-1953).
- Medicare is the federal government’s health insurance program for the elderly. It was established in 1965. By some estimates, Medicare paid for nearly one-quarter of all the health care delivered in the US, a total of nearly $750 billion in 2015. Medicare has three main components. “Part A” pays for hospital stays, surgery, and other medical procedures that require admission to a hospital. “Part B” covers supplementary medical services like physician visits and procedures that do not require hospital admission. “Part D” pays for prescription drugs. Part A is funded through payroll taxes and through premiums paid by individual beneficiaries. Part B and Part D are funded mostly through payroll taxes. Medicare does not employ physicians or other health care providers. It is, in effect, a health insurance company funded by the federal government. In 2015 it served more than 55 million beneficiaries and spent an average of $18,500 per beneficiary.
- Health is a broad category that covers health-related spending outside of Medicare. The largest segment of this spending is the federal government’s contribution to state Medicaid programs. It includes funding for public health and population health agencies like the National Institutes of Health (NIH) and the Centers for Disease Control and Prevention, and for health-focused regulatory agencies like the Food and Drug Administration.
- Social Security is an income assistance program for retirees. In 2015, over 59 million Americans received nearly $900 billion in Social Security benefits. Social Security is simple. Individuals contribute payroll taxes while they are working, those taxes are deposited into a fund, and when they retire, they are paid from that fund. In 2015, the average Social Security benefit was around $1,300 per month. Social Security also distributes benefits to disabled individuals who are not able to work.
- Income security is cash and cash-like assistance programs outside of Social Security. Most of these programs help individuals pay for specific, basic necessities. It includes unemployment insurance, food stamps, foster care etc.
- The federal government borrows a lot of money. Some of that borrowing is to pay for “big ticket” or capital outlays like aircraft carriers or refurbishing national parks. Like most consumers, the federal government does not have the money “saved up” to purchase these items, so it borrows money and pays it back over time. It also borrows when revenue collections fall short of spending needs. This is known as deficit spending. The federal government borrows money by issuing three types of Treasury Obligations: Treasury bills, Treasury notes, and Treasury bonds. Much like loans, obligations are bought by investors and the government agrees to pay them back, with interest, over time. Treasury bills come due – i.e. they have a maturity – of three months to one year. Treasury notes have maturities of two years to ten years. Treasury bonds mature in ten years upto 30 years. Each year the government pays the annual portion of the interest it owes on its Treasury obligations, and that payment is known as net interest.
- “Everything Else” is just as it sounds. This includes federal government programs for transportation, student loans, affordable housing, the arts and humanities, and thousands of other programs.
Who Owns Treasury Bonds?
At the end of 2015, the US Treasury had $19 trillion of outstanding Treasury bonds. About $12 trillion is owned by US investors. The remaining $7 trillion are held by investors outside the US, including nearly $1.5 trillion in China, and just over $1 trillion in Japan. The remaining $3.8 trillion is held by nearly 100 other countries. Why are US Treasury bonds so attractive to foreign investors? Because the US government is seen as the safest investment in the world. Investors across the globe believe the US government will pay back those bonds, with interest, no matter what.
We often divide federal government spending into two categories: discretionary spending and non-discretionary or mandatory spending. Non-discretionary spending is controlled by law. Social Security is a good example. A person becomes eligible for “full” Social Security benefits once they are over age 65 and have paid payroll taxes for almost four years. Once they become eligible, the benefit they receive is determined by a formula that is linked to the total wages they earned during their last 35 years of working. That formula is written into the law that created Social Security. Once a person becomes eligible they are “entitled” to the benefits determined by that formula. Other federal programs like Medicare, food stamps, Supplemental Security Income, and many others follow a formula-based structure. If Congress and the President want to change how much is spent on these programs, they must change the relevant laws. By some estimates, non-discretionary spending is more than 65% of all federal spending. Add to that the roughly 7-8% for interest on the debt, and we see that nearly three-quarters of federal spending is “locked in.”
The remaining one-quarter is discretionary spending. This is spending that Congress and the President can adjust in the annual budget. It includes national defense, most of the “health” spending category, and virtually all of the “everything else” category. There is considerable debate on whether national defense is, in fact, discretionary spending. Legislators are not eager to cut funding to troops in harm’s way. So keep in mind that when Congress debates its annual budget, in effect, it’s debating about 10-25% of what it will eventually spend. The vast majority of federal spending is driven by laws, rules, and priorities that originate outside the budget.
This discussion about entitlements raises another absolutely essential point: the Federal Government has a substantial structural deficit. A structural deficit is when a government’s long-term spending exceeds its long-term revenues. The figure below illustrates this point. It shows that in 2016, the federal government has a projected budget deficit of 2.9% of the US Gross Domestic Product (GDP; the county’s total economic output), or around $1.5 trillion. By the year 2046, assuming no major changes in spending or revenue policies, that annual budget deficit will grow to 8.8% of GDP. Why is the deficit expected to grow so quickly? In part because federal non-discretionary spending is going to grow. More and more of the “Baby Boomer” population will become eligible for Medicare, Social Security, and other programs. As the eligible population grows, so too will spending. Moreover, the cost of health care services has increased three to four times faster than all other costs across the economy. That’s why health-related non-discretionary spending is the proverbial “double whammy” – the number of people who need those services will increase, and so will the rate of spending per person to deliver those services. At the same time, most economists are projecting slower economic growth for the next several decades. Given the federal government’s current revenue policies, that will mean slower revenue growth over time. Those two main factors, growth in non-discretionary spending and slower revenue growth, will lead to much larger deficits over time.
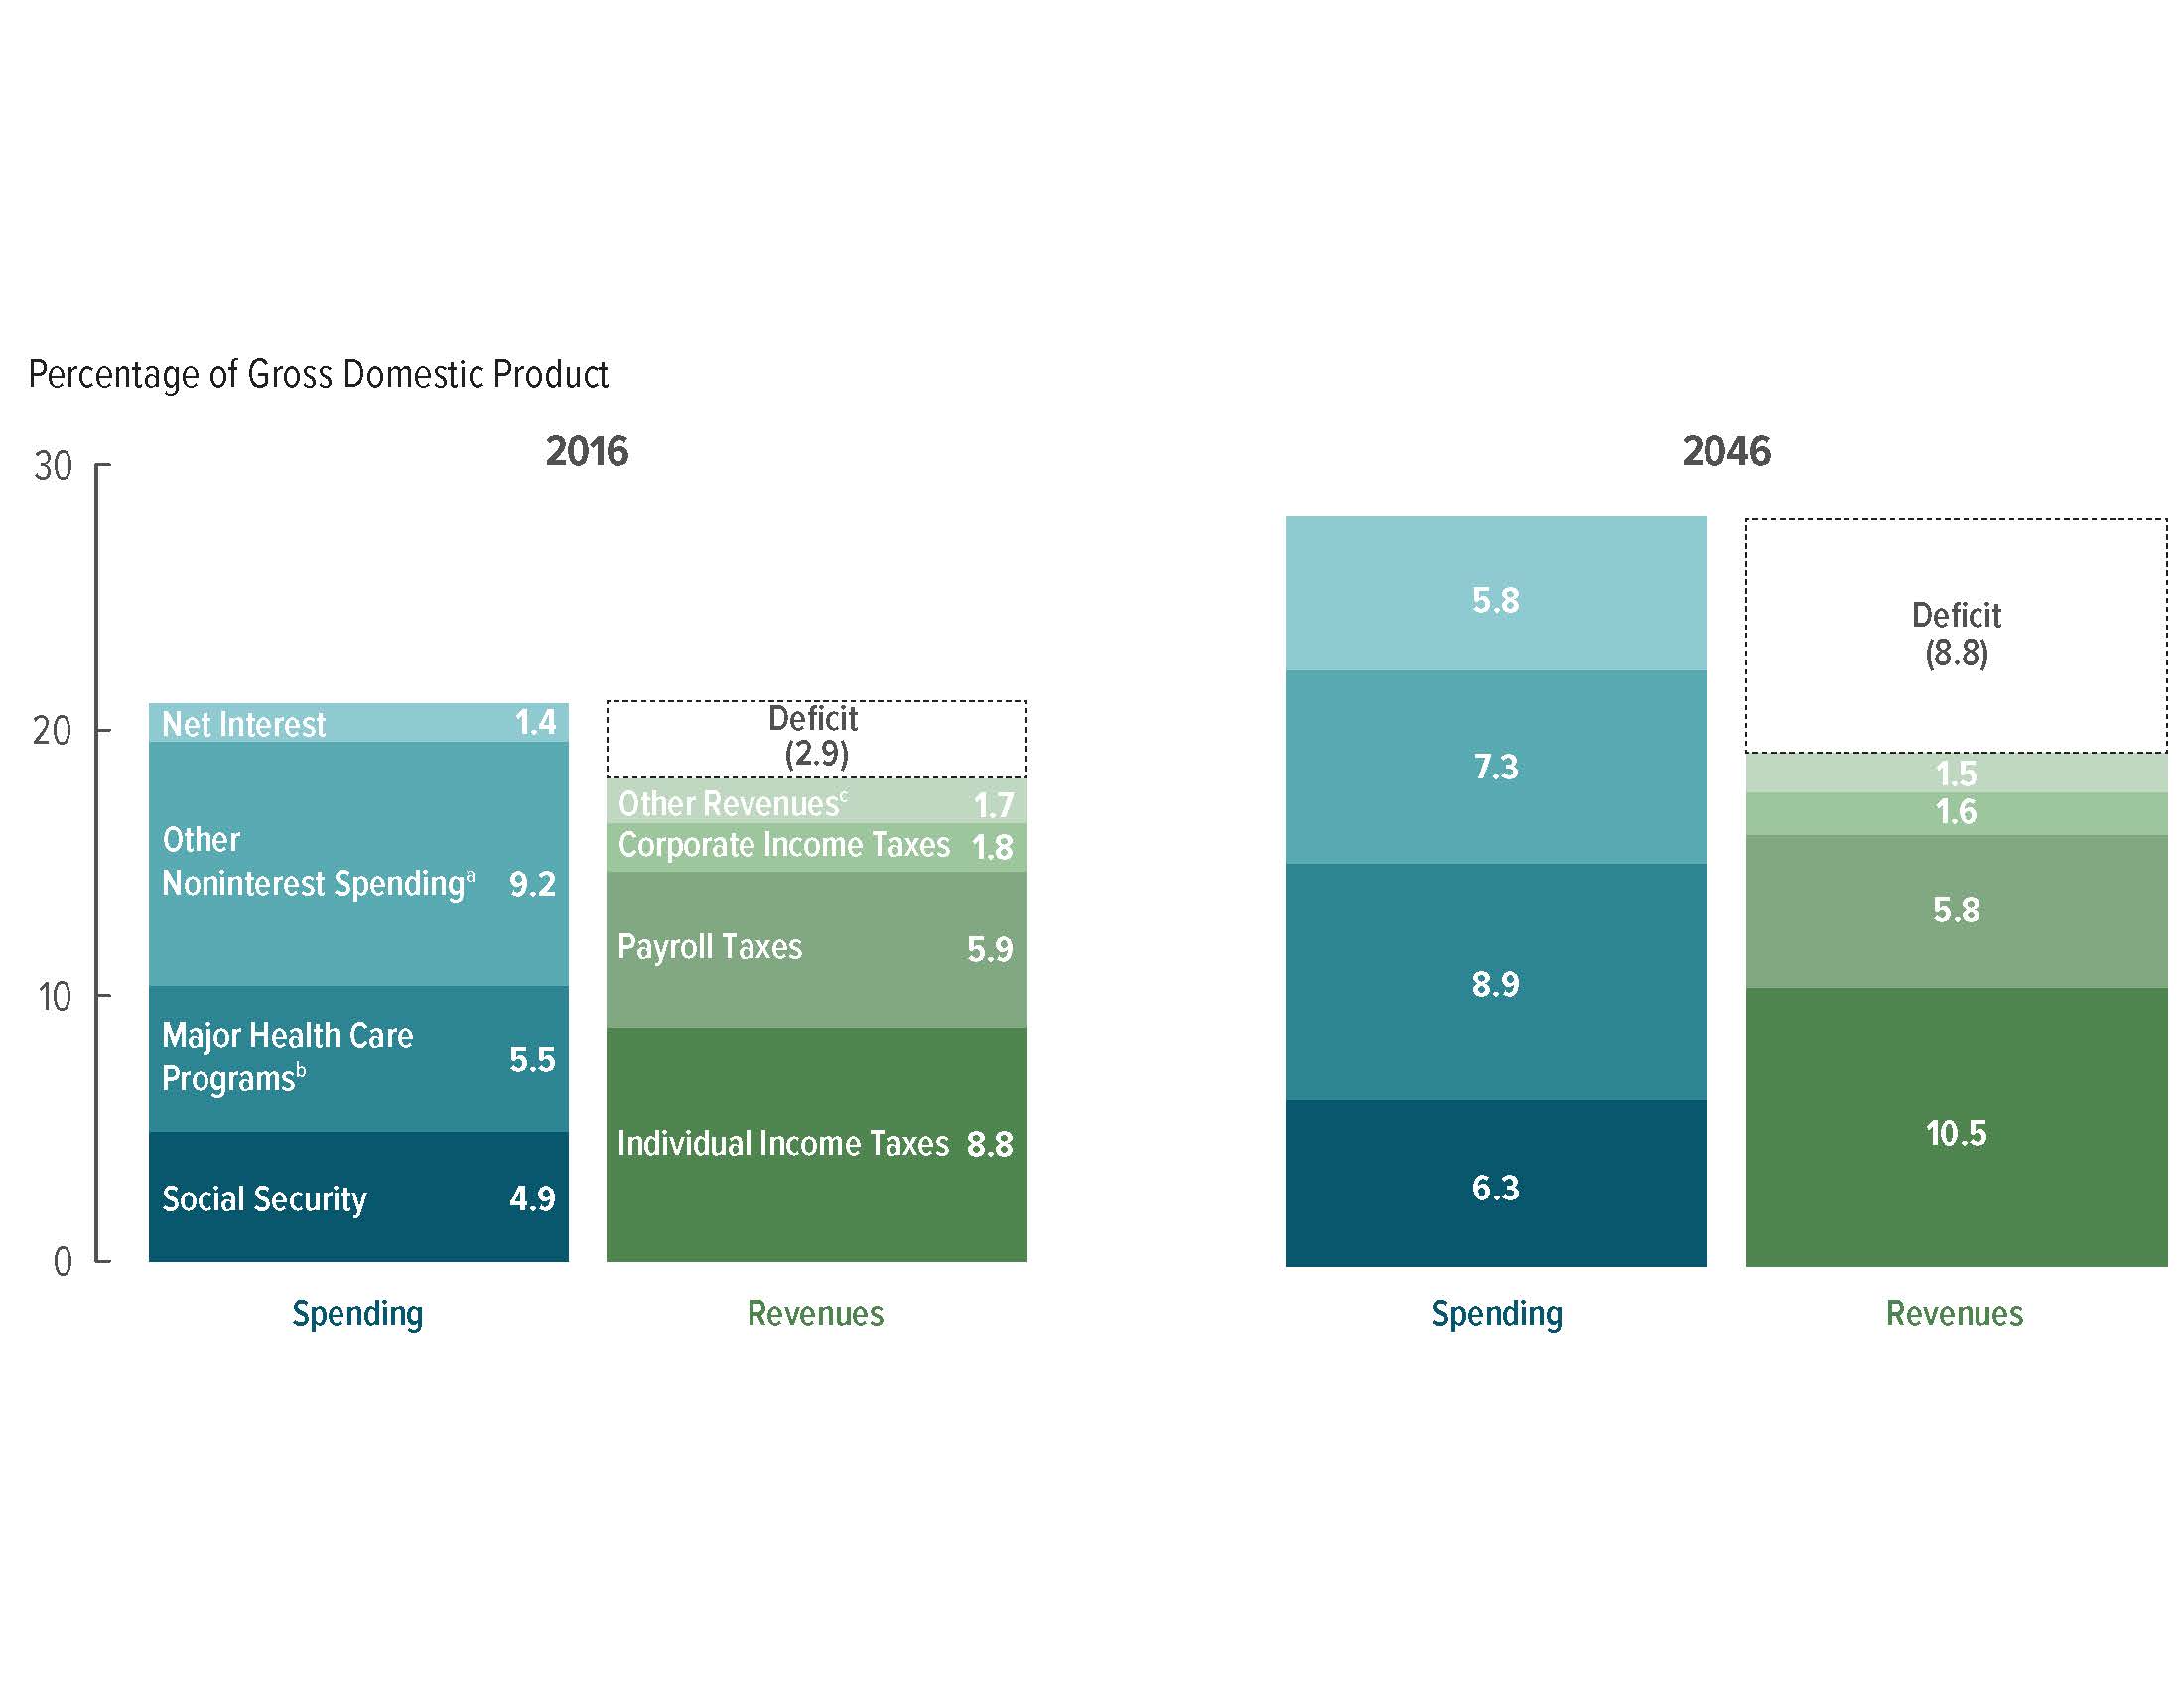
Components of the Federal Government’s Structural Deficit; Source: Congressional Budget Office
You’re probably asking yourself how will the federal government finance those deficits? If it does not collect enough revenue to cover its spending needs, it will borrow. The figure below shows how the federal government’s debt will increase in response. In 2016, federal government debt was around 72% of GDP. The Congressional Budget Office estimates it will grow to just under 150% of GDP by 2046. For context, consider that in 2015 Greece, long considered the “fiscal problem child” of the European Union, had a debt-to-GDP ratio of 158%.
This rapid growth in debt is concerning for many reasons. First, federal government borrowing “crowds out” borrowing by small businesses, homeowners, state and local governments, and others who need to borrow to invest in their own projects. Since there are only so many investors with money to invest, if the federal government takes a larger share of that money, there’s less for everyone else. Many economists and finance experts have also warned that if the federal government’s debt grows too high, then investors might be less willing to loan it money in the future. If investors are less willing to loan the government money, the government must offer higher interest rates to increase investors’ return on investment. As the federal government’s interest rates rise, interest rates rise for everyone else. Occasional increases to interest rates are not necessarily a bad thing, but prolonged high interest rates mean less investment by people and business, and that leads to lower productivity and slower economic growth.
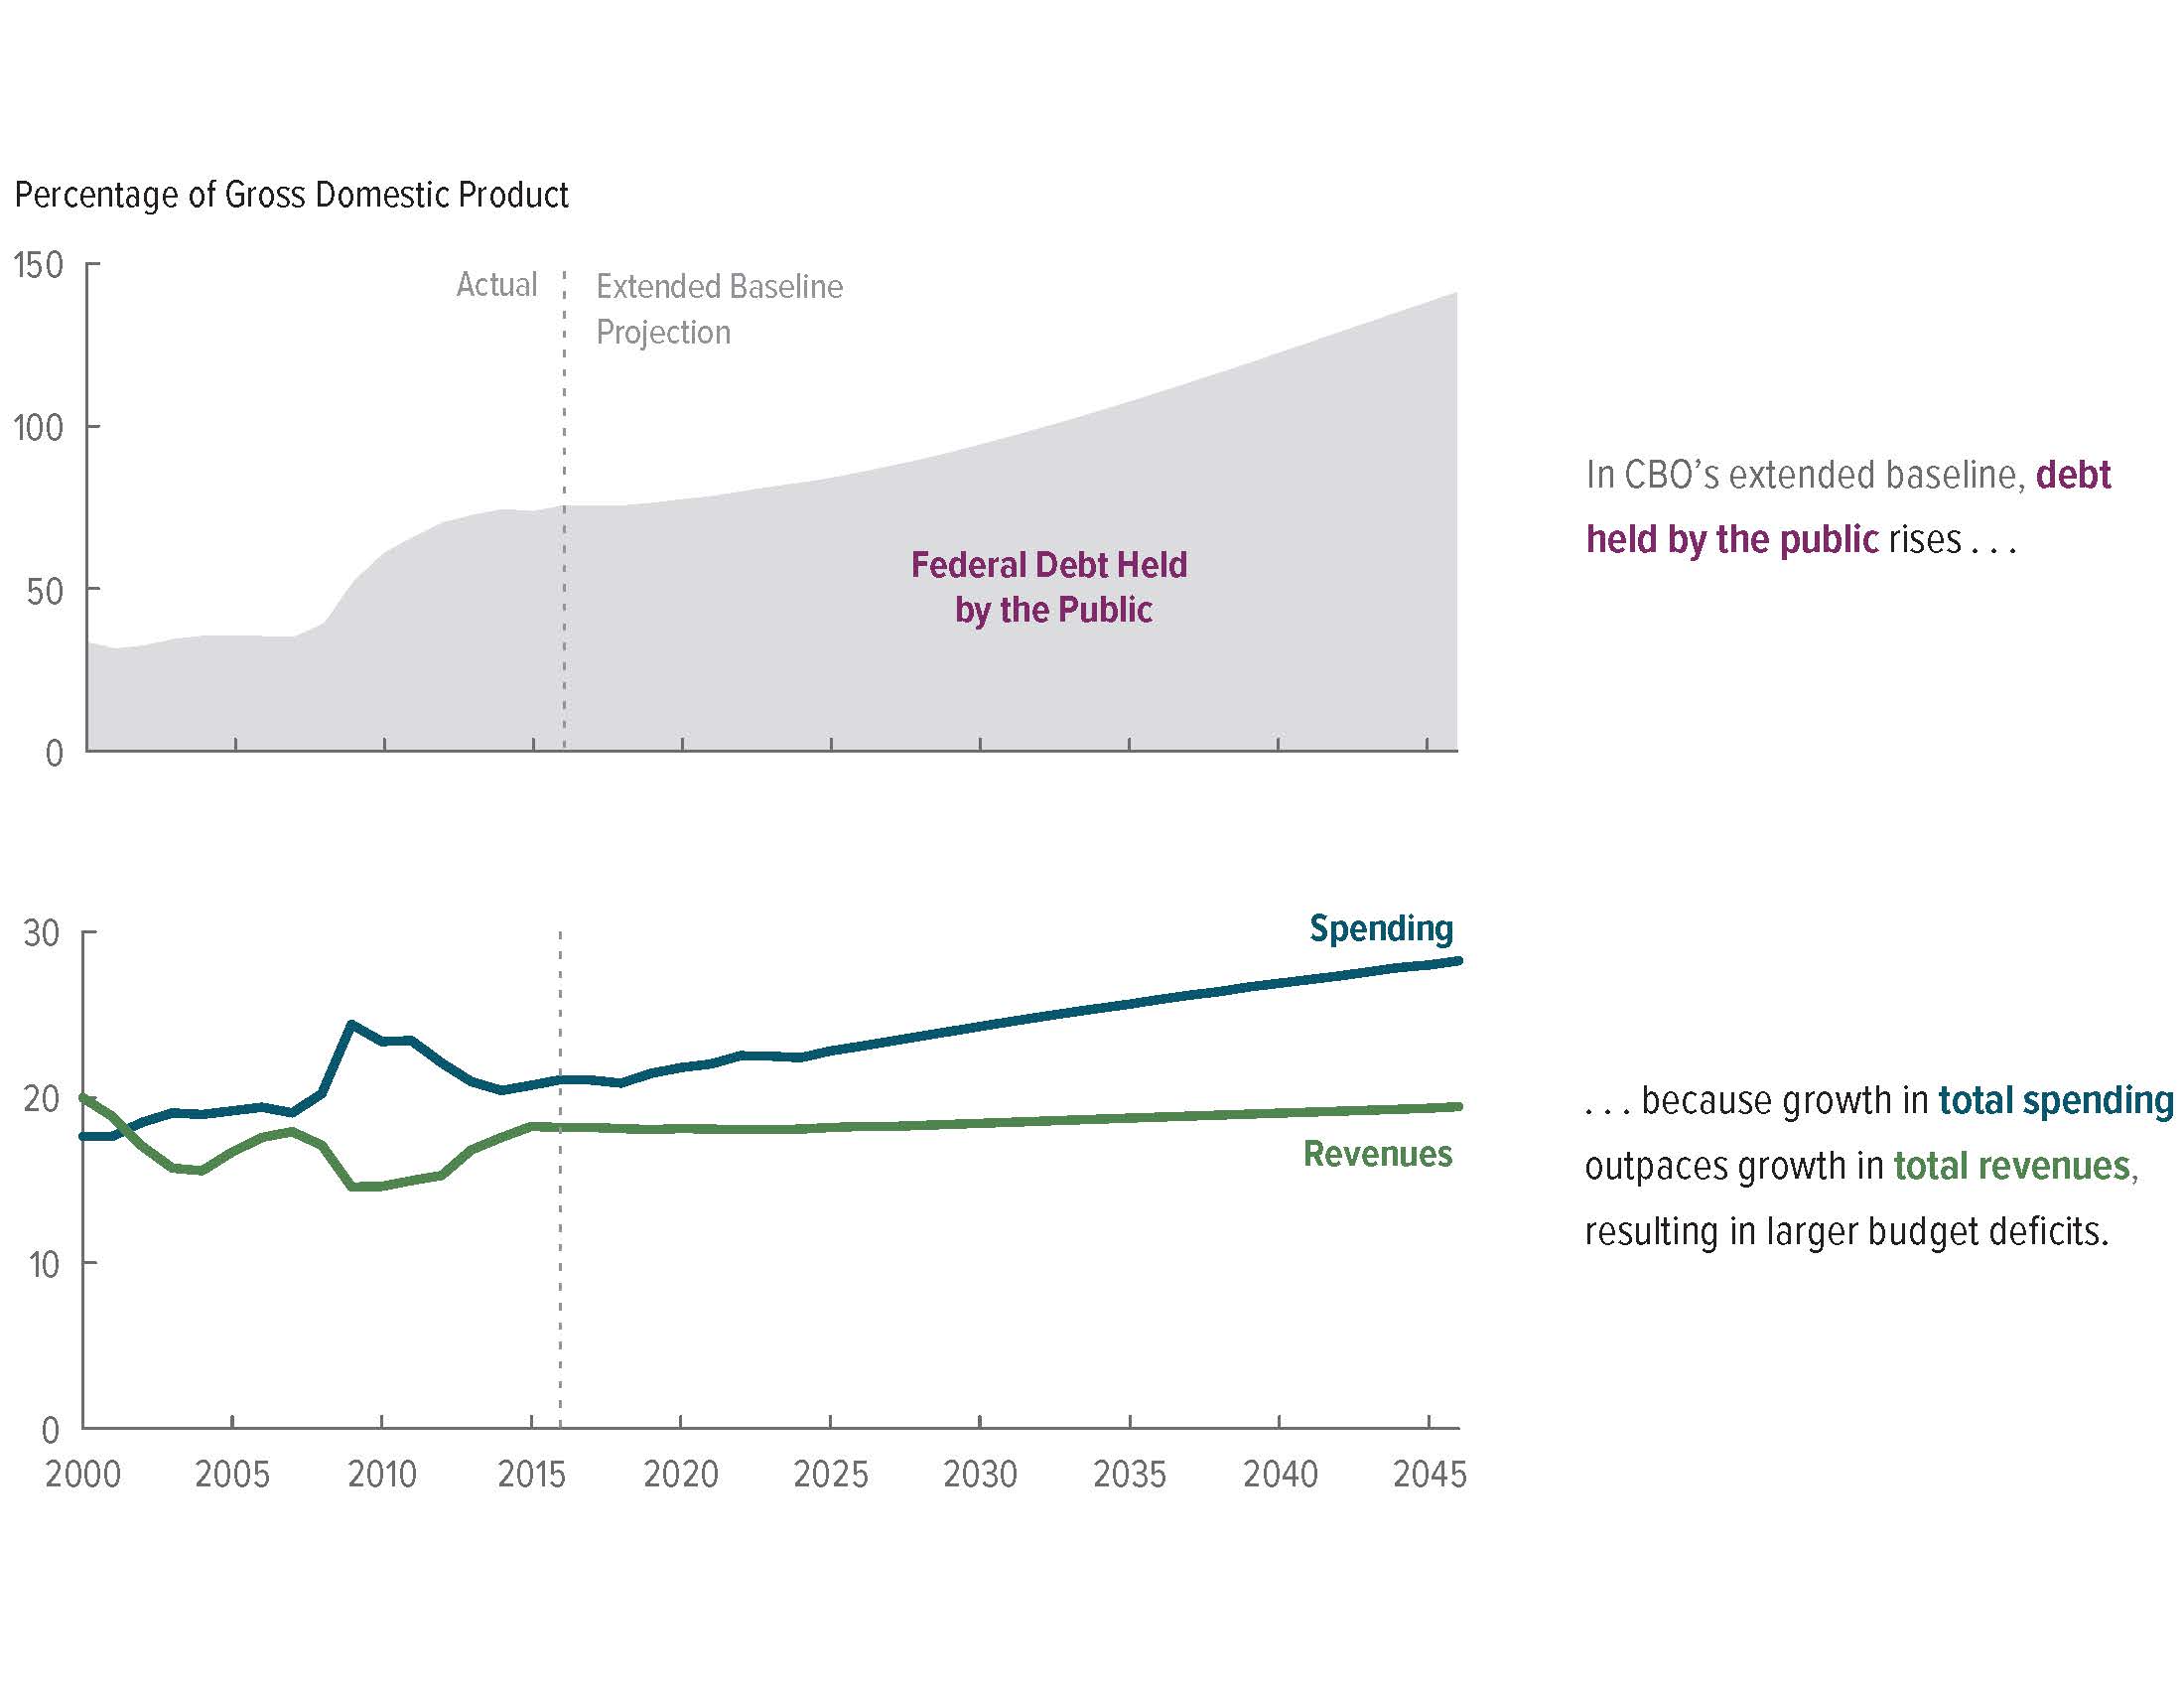
Projected Growth in Federal Debt and the Structural Deficit; Source: Congressional Budget Office
The federal government’s structural deficit is the single most important trend in public budgeting and finance today. Without major changes in federal government policy, especially in areas like Medicare and Social Security, the federal government will have no choice but to run enormous deficits and cut non-discretionary spending. Those cuts will mean less money for many of the key programs that you probably care about the most: basic scientific research, student loans, highways, transit systems, national parks, and every other discretionary program. In fact, some cynics have said that in the future, “the federal government will be an army with a health care system.” State and local governments will be forced to take on many of the services the federal government used to provide in areas like affordable housing, environmental protection, international trade promotion etc. At the same time, some optimists say this is a welcome change. Without the rigidity and uniformity of the federal government, local communities will have the latitude and flexibility to experiment with new approaches to social problems. What’s not debatable is that absent major changes in policy, especially for non-discretionary spending, federal government spending will look quite different in the not-too-distant future.
What Moves Interest Rates?
Interest rates are one of the most important numbers in public budgeting and finance. Interest is what it costs to use someone else’s money. Banks and other financial institutions lend consumers and governments money at “market interest rates” like the annual percentage rate (APR). Small changes in interest rates can mean big differences in the cost to deliver public projects. That’s why it behooves public managers to know what drives interest rates.
Interest rates fluctuate for a variety of macroeconomic reasons. If inflation is on the rise, then businesses will be less willing to spend money on new buildings, equipment, and other capital investments. If demand for capital investments is down, then so is demand for borrowed money to finance those investments. In those market conditions banks and other financial institutions will lower the interest rates they offer on loans to entice businesses to make those investments. The opposite is also true. Businesses will seek to invest during periods of low inflation, and that drives up demand for borrowed money, and that drives interest rates up. Government borrowing and capital investment can also drive demand for borrowed money. Macroeconomists have complex models that explain and predict these interrelationships between consumer spending, investments, and government spending.
The Federal Reserve Bank of the US – i.e. “The Fed” – is also a crucial and closely-watched player. The Fed is the central bank. It lends money to banks and holds deposits from banks throughout the US. Its mission is to fight inflation and keep unemployment to a minimum. In finance circles, this is called the Dual Mandate.
The Fed has many tools to achieve that mission, and most of those tools involve interest rates. It can raise or lower the Federal Funds Rate, or the interest rates at which banks lend money to each other. It can demand that banks keep more money on deposit at the Fed. Increases in either will reduce the amount of money banks have available to lend, and that drives up interest rates. It’s most powerful tool is called open market operations (OMO). If the Fed wishes to lower interest rates it buys short-term Treasury bonds and other financial securities from investors. This increases the money available for lending and reduces interest rates. When it wishes to raise rates it sells securities to banks. When banks buy those securities they have less money available to lend, and that increases interest rates.
State Governments
There’s an old adage that state governments are in charge of “medication, education, and incarceration.” That saying is both pithy and true. In 2015 state governments spent $1.6 trillion, and most of it was spent on schools, Medicaid, and corrections. That said, they vary a lot in how much of those services they deliver, and how they pay for those services. In some regions, the state is one of the largest employers. This is especially true in rural areas with state universities or state prisons. In other regions state government has a limited presence.
The figure below shows the trends in state government revenues and spending since the late 1970s. All the shaded areas above 0 are revenues, and all the area below 0 is spending. All figures are expressed in 2015 per capita dollars.
Three trends stand out from this chart. First, the size and scope of state governments varies a lot. Today Nevada, for example, spends just under $5,000 per capita. On a per capita basis it’s one of the smallest state governments. Vermont, by contrast, spends more than $9,000. Both states have roughly the same population, but one state’s government spends almost twice as much per capita. There are several reasons for this. One is that much of Nevada’s land is managed by the federal Department of Interior and by Native American Tribes. Those governments deliver many of the basic services that state governments deliver in other states. Citizens in Nevada have also historically preferred less government overall. In Vermont, the state government is largely responsible for roads, public health, primary and secondary education, and many other services that local governments deliver in most other states. That’s why state government spending in Vermont is roughly equivalent to state government spending plus total local government spending in most other states.
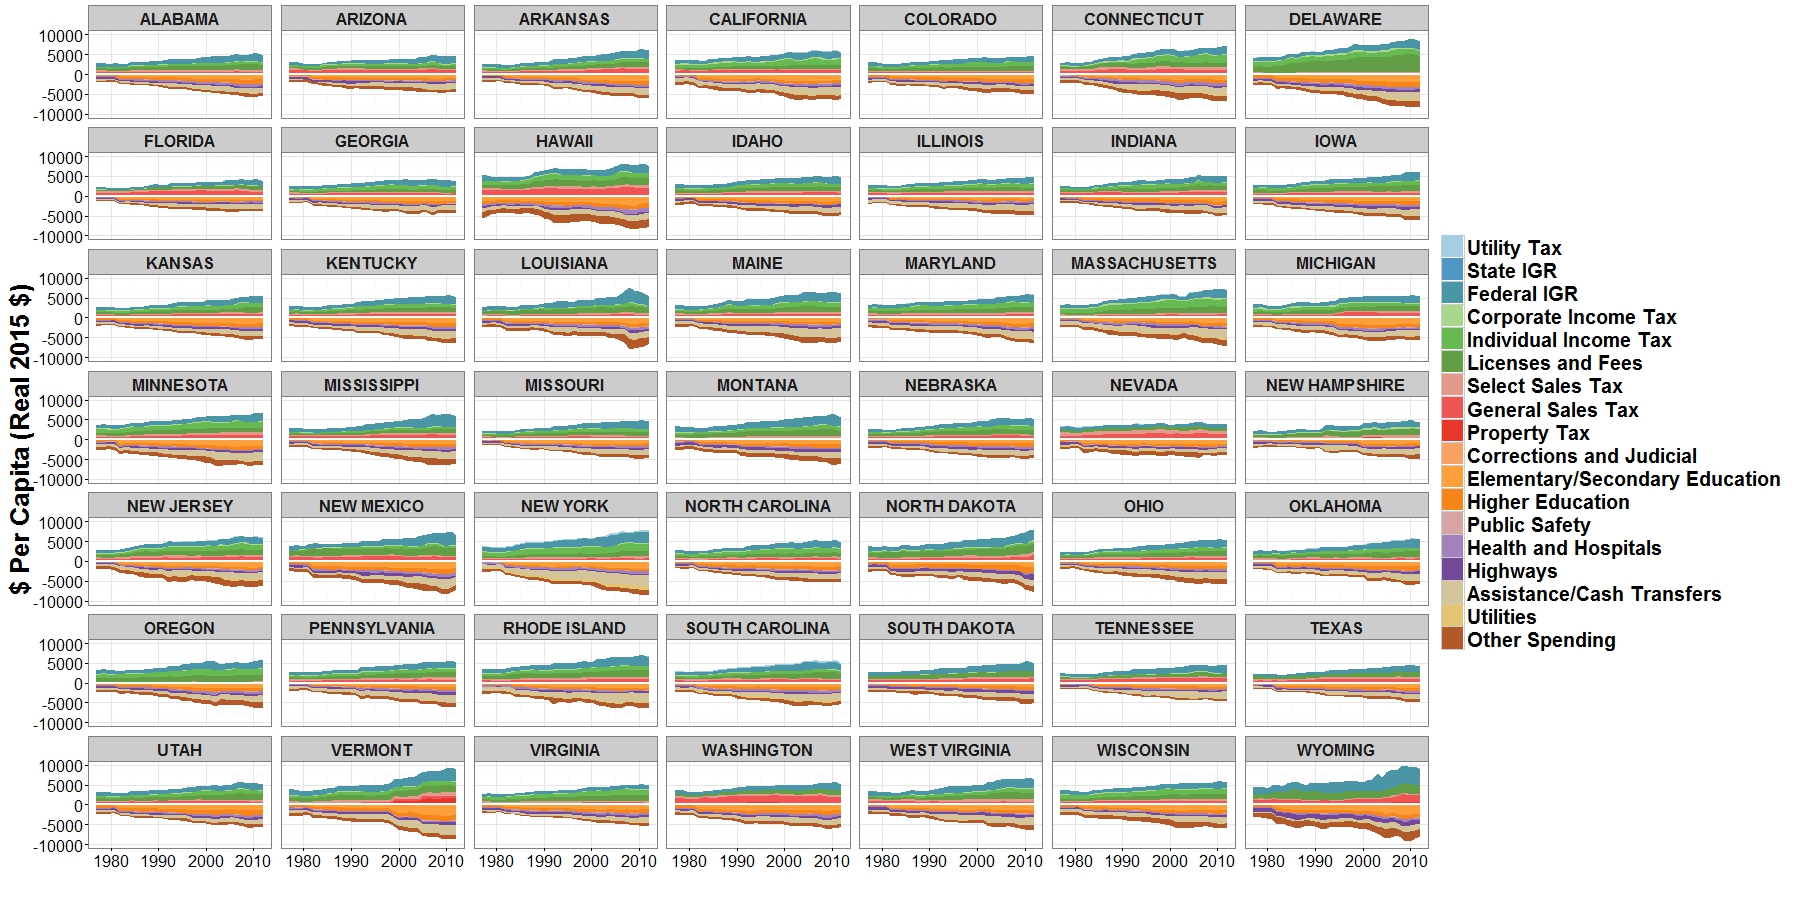
State Government Revenues and Spending, 1977-2012; Source: Authors’ Calculations Based on US Census of Governments Data; Note that Alaska is excluded because it is an outlier. In 2015 it spent more than $22,000 per capita.
A second key trend is that overall state spending grew substantially over the past few decades. In 1977, the average state per capita spending was around $2,800. In 2012 it was $5,100. Revenues have grown on a similar trajectory. But note that growth was not uniform. Spending in states like Arizona, California, Colorado, and Washington grew far slower than the average. This is not a coincidence. These states have passed strict laws, broadly known as tax and expenditure limitations, that restrict how quickly their revenues and spending can grow. States without those limits, like Connecticut, Delaware, New York, and Massachusetts, have seen much faster growth in both revenues and spending. North Dakota, Wyoming, and New Mexico saw large jumps in revenues and spending in the past decade or so, due mostly to growth of their respective shale oil industries (more commonly known as fracking).
Tax and Expenditure Limitations
Tax and expenditure limits (or TELs) restrict the growth of government revenues or spending. While there are no two TELs that are alike, they all share key elements. At the state-level, TELs are either dollar limits on tax revenues or procedural limits that mandate either voter approval or a legislative super-majority vote for new or higher taxes. In estimating the dollar limits, the state is required to establish base year revenues or appropriations subject to the limit and adjust for a factor of growth that is equal to changes in population, inflation, or personal income. States can only exceed the TEL revenue or appropriation caps if they exercise their override provision (e.g., legislative majority or super-majority vote). Funds in excess of the limitation are refunded to taxpayers, deposited in a reserve fund (commonly referred to as a rainy day fund), or used for purposes as provided by law (e.g., capital improvements, K-12 spending). Procedural limits are unique in that they are not part of the budgeting processes and apply only if the Governor seeks to levy new or higher taxes.
At the local level, TELs are either a limit on property tax rates, the taxable base (or assessed value of taxable property), property tax levy, or on the aggregate of local government taxing or spending authority. The limits on tax rates apply to either all municipal governments (an overall property tax rate limit) or specific municipalities (e.g., city, county, or a school district). Limits on assessed valuation are limits on annual growth in the valuation of property (e.g., 2 percent) while limits on property tax revenues are dollar limits on the total amount of revenue that can be raised from the property tax. Caps on the aggregate of local government taxing or spending authority are dollar limits on overall spending authority.
While these revenue suppression measures remain popular, they have had unintended and perhaps detrimental effects, especially at the local level. For example, data from 1977 through 2007 shows the precipitous decline in property tax revenues as a share of own-source revenues. In California, Massachusetts, and Oregon, revenues from the property tax revenues fell more than 15 percent. In response, local governments have come to rely more on intergovernmental transfers and user charges and fees. They have also adopted local-option sales and/or income taxes to make up for lost property tax revenues. As a result of changes, revenues are more volatile and local governments have less control over their budgets than they did prior to the tax-revolt movement. TELs have also altered how local governments are willing to borrow, market perceptions of their credit quality (or default risk), and their ability to manage their other long-term obligations and legacy costs.
A third important trend is that state revenues roughly equal state spending. Virtually every state’s constitution requires that its legislature and governor pass a balanced budget. As you’ll see later, “balanced budget” can mean rather different things in different places. But overall, states don’t spend more money than they collect. This is in sharp contrast to the federal government. As you saw above, throughout the past several decades the federal government’s spending has routinely exceeded its revenues. Unlike the federal government, the states cannot borrow money to finance budget deficit. In a number of states, restrictions on deficit spending are enshrined in law.
What is a “Fair” Tax?
Governments tax many different types of activity with many different types of revenue instruments (i.e. taxes, fees, charges, etc.). Each instrument is fair in some ways, but less fair in other ways. In public finance we typically define fairness along several dimensions:
- Efficiency. Basic economics tells us that if a good or service is taxed, then consumers will purchase or produce less of it. An efficient tax minimizes these market distortions. For instance, most tax experts agree the corporate income tax is one of the least efficient. Most large corporations are willing and able to move to the state or country where they face the lowest possible corporate income tax burden. When they move they take jobs, capital investments, and tax revenue with them. Property taxes, by contrast, are one of the most efficient. The quantity of land available for purchase is fixed, so taxing it cannot distort supply the same way that taxing income might discourage work, or that taxing investment might encourage near-term consumption.
- Vertical Equity. Vertical equity means the amount of tax someone pays increases with their ability to pay. Most income tax systems impose higher tax rates on individuals and businesses with higher incomes. This is meant to ensure taxpayers who have greater ability to pay will contribute a higher share of their income through taxes. A tax with a high degree of vertical equity, like the income tax, is known as a progressive tax. A regressive tax is a tax where those who have less ability to pay ultimately pay a higher share of their income in taxes.
- Horizontal Equity. Horizontal equity – sometimes called “tax neutrality” – means that people with similar ability to pay contribute a similar amount of taxes. The property tax is a good example of a tax that promotes horizontal equity. With a properly administered property tax system, homeowners or business owners with similar properties will pay similar amounts of property taxes. Income taxes are quite different. Because of tax preferences, it’s entirely possible for two people with the same income to pay very different amounts of income tax.Elasticity. An elastic tax responds quickly to changes in the broader economy. If the economy is growing and consumers are spending money, collections of elastic taxes increase and overall revenue grows. This is quite attractive to policymakers. With elastic taxes, they can see growth in tax collections without increasing the tax rate. Of course, the opposite is also true. If the economy is in recession, consumer spending decreases, and so do revenue collections. Sales taxes and income taxes are the most elastic revenues.
- Stability. A stable – or “inelastic” – tax does not respond quickly to changes in the economy. Property taxes are among the most inelastic taxes. Property values don’t typically fluctuate as much as prices of other goods, so property tax collections don’t increase or decrease nearly as fast as sales or income taxes. They’re more predictable, but they can only grow so fast.
- Administrative Costs. Some taxes require a lot of time and resources to administer. Property taxes are a good example. Tax assessors go to great lengths to make certain the appraised value they assign to a home or business is as close as possible to its actual market value. To do this they perform a lot of spatial analysis. That analysis demands time and expertise.
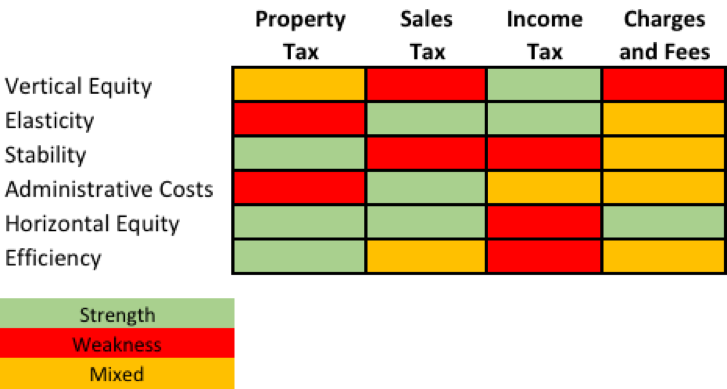
The chart below illustrates a basic fact about taxation: all taxes come with trade-offs. For instance, the property tax is stable and promotes horizontal equity, but it’s costly to administer and generally non-responsive to broader trends in the economy. The sales tax is cheap to administer and produces more revenue during good economic times, but it’s also quite regressive. Also note that for many of these instruments the evidence is mixed. That is, tax policy experts disagree on whether that characteristic is a strength or weakness for that particular revenue instrument.
States rely on a few key revenue sources:
- About one-third of state government revenues are from sales taxes. There are two basic types of sales taxes: 1) a general sales tax that applies to all retail sales transactions, and; 2) special sales taxes that apply only to sales of certain goods and services, such as gasoline, cigarettes, alcohol, and gambling. Some states tax construction, personal trainers, catering, and other professional services, while many do not. Many special sales taxes are administered as excise taxes. Like with the income tax, sales tax revenues are derived from a tax rate applied to a taxable base. A state’s sales tax base is all the retail sales of personal property that happen within its borders. The challenge is that it’s not always clear what is included in that taxable base. For instance, a business will remit state sales tax only if it has a substantial portion of its business, known as a sales tax nexus, in that state. When a company does business in multiple states, or in multiple countries, it must use complicated calculations, known as tax apportionment formulas, to determine the sales tax it owes in each state. Online retailers like Amazon.com have argued they should not pay state sales tax because they do not have a nexus in any one state. Some states require consumers to pay a use tax if they purchase a good without paying sales tax. In many states, the goods and services purchased by businesses, for the purposes or producing are good or delivering a service, are exempt from sales taxes. For these and other reasons sales tax administration is quite complex.
- Approximately 18% of total state revenues are from individual and corporate income taxes. For states that have them – 10 states do not have an income tax – income taxes are always the largest or the second largest revenue source. State income taxes are administered much like the federal income tax. In fact, most states apply the federal government’s definition of taxable income to determine state taxable income. Interestingly, overall spending has grown much slower in states that do not have an individual income tax.
- All state governments depend to some extent on intergovernmental revenues (IGR). For the states, most intergovernmental revenue is transfers from the federal government for its share of certain mandated programs. Medicaid (see below) is the largest and most important for most states. The federal government also sends states money for transportation infrastructure, the child health insurance program (or S-CHIP), federal student loan assistance, and many other programs. Federal IGR falls into roughly two categories: categorical grants that are restricted to specific purposes, and block grants that are less restricted but must produce measurable outcomes or deliverables. Federal funds for highways and university research are good examples of categorical grants. The Community Development Block Grant program is a good example of a block grant.
- Most state revenues are from the sales tax, income tax, and IGR. That said, states do depend on a variety of other smaller revenues. Some states levy a limited property tax (see below) on transactions of certain personal property, like vehicles. States also generate revenue through fees attached to everything from hunting to running a tavern to practicing medicine. Some states also tax private electricity and water utility operators.
As mentioned, most state spending is around health, education, and corrections.
- About one-third of total state spending is related to health. Most of that one-third is state Medicaid programs. Medicaid is the federal government’s healthcare program for the poor. It’s delivered through a partnership with the states. Each state designs its own Medicaid program, and the federal government covers 50-70% of the spending related to that program. That’s why it’s actually part of “Assistance/Cash Transfers” in the figure above. Medicaid is non-discretionary spending. In most states, an individual qualifies for it if their income falls below a certain level. It’s also the default health insurer for many vulnerable populations, including foster children, the permanently disabled, and the mentally ill. Older individuals who are poor or disabled often qualify for both Medicare and Medicaid. They are known as dual-eligibles. Medicaid is to the states what Medicare is to the federal government: a massive health insurance program that is expected to cover more people and become vastly more expensive over time. In fact, in most states the primary source of growth in Medicaid spending is spending on nursing homes and other long-term care for the elderly. Health and hospitals spending also includes public hospitals and free health clinics run by state governments, and state public health services like vaccinations, diabetes prevention, and outreach programs to prevent sexually-transmitted diseases.
Medicaid Expansion (and Contraction?)
As part of Affordable Care Act (i.e. “Obamacare”), the federal government offered states a once-in-a-generation opportunity. If states expanded their Medicaid programs to cover more uninsured people, the federal government would cover up to 90% of the costs for that expansion. By 2014 a total of 31 states had expanded or were seriously exploring expansion options. In early 2017, President Trump and Congressional Republicans called for the federal government to reduce or even eliminate its contribution to that Medicaid expansion, a move that would remove tens of millions of Americans from Medicaid-sponsored health insurance. If and how to do “Medicaid Contraction” is one of the central issues in health care policy today.
- Around 20% of state spending is related to public education. In most states, public education is delivered by local school districts but paid for in large part by the state government. Virtually every state constitution has language that calls out funding primary (Kindergarten through 8th grade) and secondary (9th through 12th grade) public education as the state’s principal responsibility. In most states, the state funding for public education is distributed to local school districts through a formula based on the number of students in the district, the district’s local demographic circumstances, and the district’s financial condition. Public education also includes community colleges and state universities, both of which are paid for through a combination of state funding and student tuition payments.
- Corrections and judicial services are around 5% of total state spending. This includes prisons, parole officers, state court systems, and state crime prevention programs.
- Highways are 5-12% of state spending, with lots of variation across the states. Rural states like Kansas and Texas have large and elaborate networks of state highways. They spend 10-12% of their annual budgets maintaining and building state highways. By contrast, in New England, the state highway systems are far smaller, so state highway spending is not nearly as large a share of overall state spending. State governments finance most of their highway and other infrastructure projects by borrowing money, usually through bonds that they repay over time.
- The other category includes state parks, state environmental conservation programs, law enforcement officials such as the state patrol, and interest on state government debt. Pensions and other post-employment benefits (OPEB) for retired state government workers are one of the most important and fastest growing components of this “other” category (see below).
The Problem with Pensions
The chronic underfunding of public sector retirement systems is arguably one of the most significant fiscal challenges facing states and local governments to date. The unfunded actuarial accrued liability or UAAL is a plan’s net position (or market value of plan investments minus actuarial accrued liabilities (AAL)). The AAL represents the projected cost of benefits for retirees and active employees that will eventually retire and draw benefits. If assets exceed liabilities, a retirement plan is fully funded, otherwise, it’s underfunded or simply, unfunded.
A vast majority of retirement plans are unfunded! The nation’s state-run retirement systems reported a $934 billion gap in FY2014 (Pew, 2016). When combined with the more than 3,000 local pension systems, the UAAL is in excess of $1.5 trillion. Funded ratios (ratio of market value of assets divided by plan liabilities) plunged 14 percentage points from 89 cents for every $1.00 in liabilities in 2002 to 75 cents for every $1.00 in 2011. Aggregate funded ratios of state-sponsored retirement plans in Connecticut, Illinois, Kentucky, and New Jersey are less than 50 cents for every $1.00 in liabilities. Distressed local governments, including those that recently filed for Chapter 9 Bankruptcy protection (e.g., City of Detroit MI, City of Central Falls RI) reported equally low funded ratios.
Why would pension underfunding present a fiscal challenge to governments? First, pension obligations are akin to general obligation (GO) debt in that general tax dollars will be used to make payments on retiree benefits. However, unlike general government long-term debt obligations, liabilities associated with retirement benefits are less visible to the public, face no constitutional or statutory limitations, and do not require voter approval. What’s more, once granted, governments can do little to modify benefits to existing employees, retirees, or their beneficiaries. They therefore represent a substantial reallocation of future cash flows on what are in essence unpaid historical costs.
While the Great Recession exacerbated the public sector retirement crisis, it did not create it. Before the downturn, many states opted to increase employee pension benefits in lieu of annual wage adjustments. At the same time, they either failed to make the necessary contributions or fell short of their annual required contribution (ARC). Instead, they relied on robust returns on investments and above average discount rates to value their long-term obligation. The result of which was inflated assets and understated liabilities.
For states (and local governments) to adequately fund their retirement systems, they will need to make structural changes to retirement systems that would ensure fiscal sustainability. While reforms have faced legal setbacks, a number of states have been able to scale back on their plan benefits including limiting benefits to current employees, demanding higher contributions, limiting or ending eligibility for new employees, and creating defined contribution plans or hybrid retirement plans. While policy changes represent improvements on the margin, they do not resolve plan insolvency. Governments will need to contribute at or above ARC to ensure retirement systems are sustainable. A sluggish economic recovery has made this even more difficult as politicians must choose between funding retirement benefits, a historical cost, or paying for schools, roads, and public safety.
The discretionary vs. non-discretionary spending distinction is also critically important to the states. Medicaid and primary/secondary education are effectively non-discretionary programs. State legislators can change their state Medicaid laws and policies, and many have. But without a policy change, Medicaid spending is formula-driven and locked in. Primary/secondary education spending is also driven by formulas that requires the state to send a given amount of money to local school districts each year, barring some substantial policy change. States must also pay the interest on their debts, and make good on their pension and OPEB promises. A quick glance at the figure above shows that non-discretionary spending is around 70% of total spending in most states. That’s why when revenues fall short of expectations, and states need to balance their budgets, they have little choice but to scale back on the 30% that remains in discretionary areas like higher education and public health. We’ve been reminded of this fact since the Great Recession. From 2008-2015, state governments cut spending on higher education by an average of 35%, and public health by an average of 50%.
Municipalities
There are just over 19,000 “municipal” governments in the US. They include cities, villages, towns, and a few incorporated townships. In 2015 these governments spent around $1.8 trillion, most of it in three core service areas: public safety, infrastructure, and community development.[2] When we think of local governments we think of police officers, firefighters, municipal parks, and local streets.
But beyond those core services, no two municipal governments are alike. Some operate their own electric utilities and water companies. Some operate golf courses, swimming pools, and other recreational facilities. Some have programs to fight homelessness and promote affordable housing, both areas that until recently were managed by the state and federal governments. Others have programs to fight climate change, promote tourism, and acclimate new immigrants to their communities. Of all the levels of government, municipalities offer the most variety in their size and scope of services.
The figure below shows revenues and spending for the 50 largest (by population) US cities from 1977 through 2012. This figure is similar to the previous figure for the states. All the shaded areas above 0 are revenues, and all the area below 0 is spending. All figures are expressed in 2015 per capita dollars.
At a glance, this chart shows the enormous variety in the size of municipal governments. Many of them collected and spent less than $1,000 per capita each year since 1977. They have not grown or shrunk in any appreciable way. By contrast, cities like Baltimore, Boston, Nashville, New York, Philadelphia, and San Francisco have grown substantially. Financially speaking, these municipalities are more like states than cities. They fund and manage public schools, utilities, large cash-transfer assistance programs, and major infrastructure networks. As a result, their total spending and the growth in total spending is orders of magnitude larger than many other cities. Cities like Austin, Jacksonville, and Seattle have financial structures dominated by large public utilities. To these jurisdictions, their utilities are both a major revenue source and a major spending item.
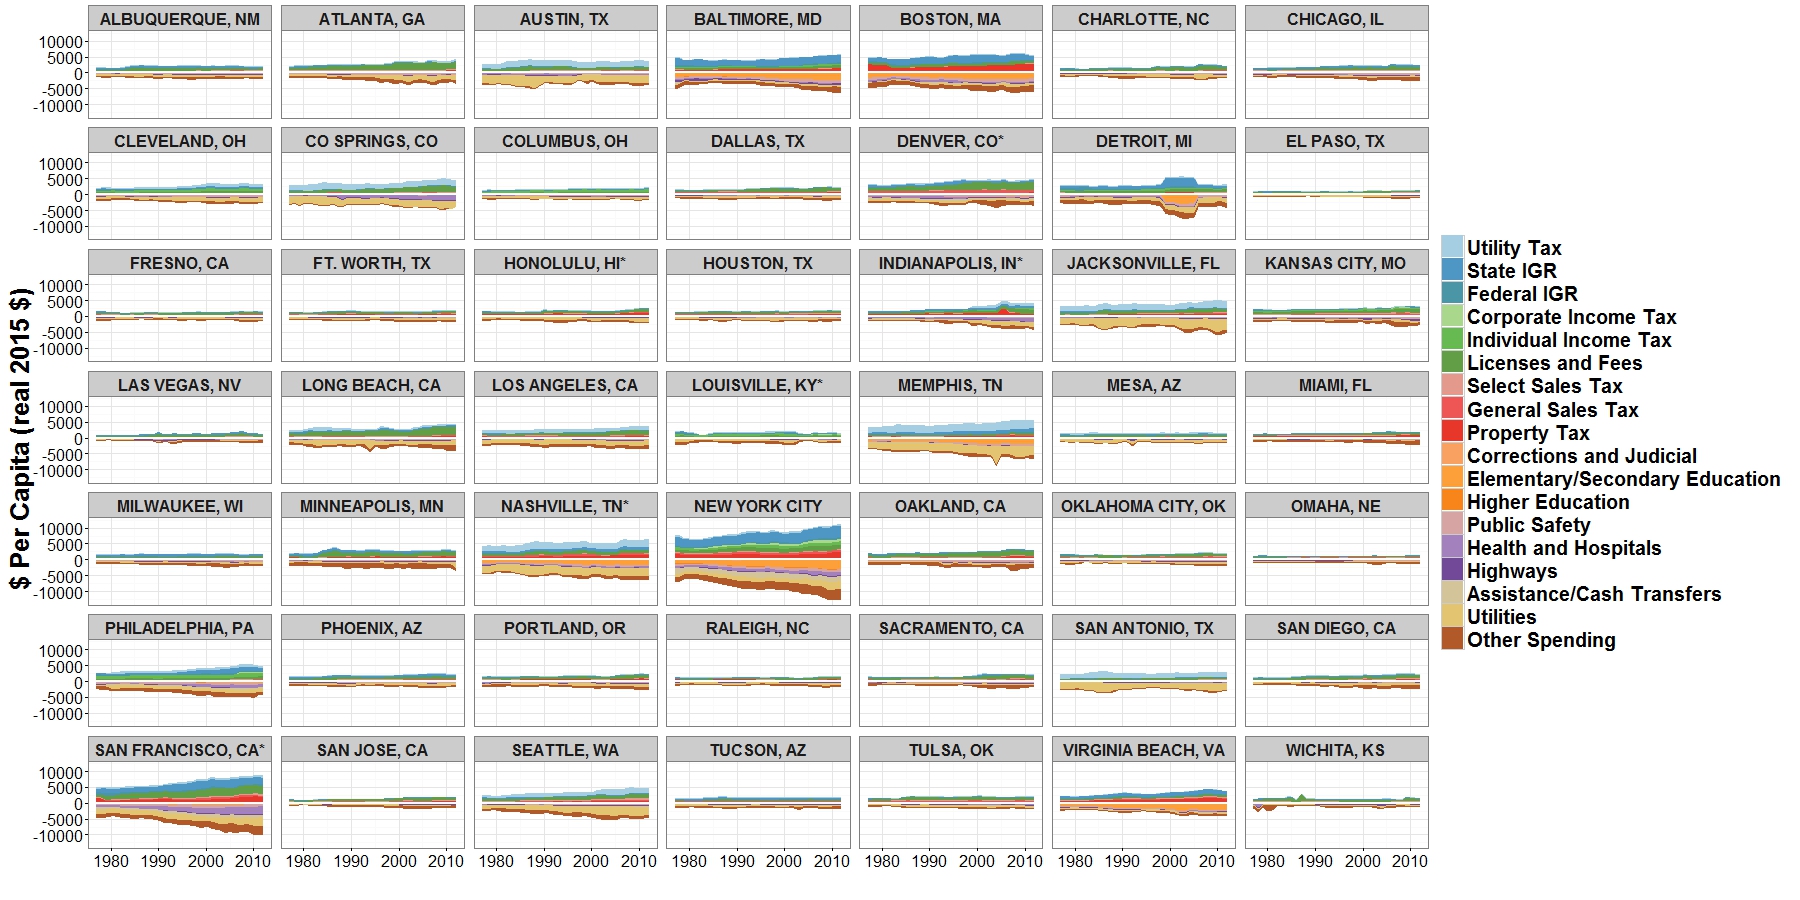
Revenues and Spending of the 50 Largest US Cities, 1977-2012; Source: Authors’ calculations based on US Census of Governments data
Municipalities depend on the same revenue sources as states, but in much different configurations.
- Property taxes are the local revenue workhorse. They are the oldest local revenue source and the only tax found in all 50 states. For the past two decades, they have accounted for at least 30% of all local government revenues. There are good reasons for this. Property taxes are simple and transparent. They follow the same basic taxable base times tax rate concept you’ve already seen with both the income tax and the sales tax (see below for more detail on property tax administration). And yet, property taxes are wildly unpopular. Taxpayers get angry when their tax bill increases, but their income does not. They also struggle to understand how the government determines their property value. That’s why the property tax is often called the “necessary evil” of local revenue systems.
A Primer on Property Taxes
The amount of property taxes a jurisdiction collects is called the tax levy. The tax levy is determined by three factors: the tax base, the tax rate, and any tax preferences. The property tax base is the value of all private land and buildings, and all business-related land and buildings within a jurisdiction. The local tax assessor determines that value. The assessor’s job is to determine the price someone would pay for a particular property and/or building in the current real estate market. This is broadly known as a property’s market value. It’s difficult to determine market value because real estate is not bought or sold that often. Assessors solve this problem by using statistical models to infer the market price of a property from the prices of similar properties that were recently sold.
Policymakers decide what percentage of the market value is subject to taxation. This is known as the assessed value. They must also decide the amount of the tax as a percent of the assessed value. This is the tax rate.
Tax rates are important, but some of the most consequential decisions about property taxes are about exceptions to the base-rate relationship. For example, non-profit organizations are not required to pay property taxes. Many senior citizens pay reduced property taxes as a way to keep home ownership affordable to people on a fixed income. Many municipalities and counties offer property tax abatements, or temporary property tax reductions or exemptions, to encourage businesses to locate, stay, or grow within their borders.
If a property’s assessed value increases, but the tax rate stays constant, the tax levy will still increase. In fact, if a property is subject to special assessments, or property taxes that apply only to certain properties, its levy can increase even if its assessed value decreases.
- In 33 states, the state government has authorized local governments to levy a local sales tax. In all, around 6,500 municipalities have a local sales tax, and since World War II sales taxes have grown from less than 5% of total local revenues to nearly 15%. Applicable rates and taxable bases vary. Some municipalities have a general sales tax to fund general local services. Rates on these general local sales taxes are usually between 2-3%. Other local sales taxes are much smaller rates but for more specific purposes like public safety, public health, or tourism. For example, in 2000, voters in Brown County, WI authorized a 0.5% sales tax to fund improvements to Lambeau Field, home of the Green Bay Packers of the National Football League (NFL).
- Local income taxes are common in areas with lots of commuters. In fact, they’re often called commuter taxes or head taxes. Central cities often lament commuters work in the central city and use central city services, but do not pay for those services because they own property outside the central city. Local income taxes impose a tax on wages, income, and other earnings in the jurisdiction where that income is earned. This is the logic behind local income taxes in several large cities like Birmingham, Denver, Kansas City, New York City, Philadelphia, St. Louis, and Washington, DC. Several municipalities in greater Portland, OR impose a local income tax to help fund Tri-Met, the regional light rail system. This is an interesting twist on the commuter tax model. Ohio authorizes all of its municipal governments to levy a local income tax. The central criticism of local income taxes is that they drive away business. That is, if a local business can avoid paying the local income tax simply by moving to another jurisdiction, it will have a strong incentive to do so.
- Municipalities depend on a variety of intergovernmental revenues. Many state governments offer municipalities grants to fund a variety of needs, especially infrastructure. Many states have grants and revolving loan programs to help municipalities pay for roads, bridges, drinking water systems, stormwater management systems, and other basic infrastructure. Federal intergovernmental revenues also assist municipalities with transportation infrastructure, affordable housing and community development, community policing, and many other initiatives. In a few states, municipalities receive up to 30-40% of their revenues through state revenue sharing programs. This is most common in states where local governments are not authorized to levy a local sales tax or are subject to strict property tax limits.
- Municipalities also employ dozens of “other” revenue sources. Some tax utilities, both publicly-owned and privately-owned, within their borders. Municipalities also impose fees on licenses for everything from owning a pet to operating a tavern to practicing massage therapy. Municipal courts also impose a variety of fines on everything from illegal parking to vagrancy. Like the sales tax, fees and other miscellaneous charges have become a much larger part of municipal revenue portfolios throughout the past two decades.
The figure above also illustrates that it’s difficult to broadly characterize municipal spending. That said –
- Public education accounts for around 30% of total municipal spending. However, that figure is driven by a few large school districts and a few states where municipal governments are obligated to provide or pay for public education. Most municipal governments are not directly responsible for public education.
- Most US municipalities spend 30-50% of their money on public safety. This includes police, fire, and emergency medical services. Public safety is also one of the fastest growing spending areas. On average, municipal spending on public safety has grown at more than three times the rate of inflation in the broader economy.
- The rest of municipal spending is split roughly between infrastructure and community development. Municipal infrastructure includes streets, sidewalks, bridges, drinking water treatment, wastewater treatment, stormwater management, electricity, cable television, and telecommunications. Many of our most basic human needs are met by municipal infrastructure. Community development includes programs to encourage small business growth, promote arts and culture, make neighborhoods safer and more walkable, among others.
- As mentioned above, the scope of municipal governments around the country has expanded dramatically in the past two decades. Today, many municipalities have programs and services designed to mitigate climate change, stop the emerging nationwide heroin epidemic, protect the civil rights of the LGBTQ community, prepare recent parolees for careers in emerging industries, promote international trade, and assist newly arriving refugees. In the past, these issues were considered state, national, or even international issues. What difference can a city make, the argument went, around a problem so vast as climate change? But in the midst of chronic political gridlock in state capitals and in Washington, DC, and in a new environment where “symbolic politics” are more potent than ever, many municipal officials feel compelled to go it alone.
When is a Business Not a Business?
The “sharing economy” is exciting unless you’re a tax collector. In April 2016 the San Francisco (CA) Office of the Treasurer and Tax Collector imposed a new requirement that all drivers for ride-sharing services like Uber and Lyft register as business owners. As a result of the requirement, drivers are now required to pay a business license fee of up to $15,000 depending on how much revenue they generate. Uber’s management bitterly opposed this measure, arguing that its drivers are not business owners but rather entrepreneurs who deliver a contracted service arranged through its app. This same basic challenge of defining and taxing a “business” applies to other sharing platforms like AirBnB, HomeAway, TaskRabbit, InstaCart, and many others.
County Governments
Counties are often called the “bottom of the fiscal food chain.” They deliver expensive and human capital-intensive services like public health, elections, tax administration, and regional transit systems, but they receive most or all of their money from property taxes with limited growth potential, from highly constrained sales taxes, and from categorical grants from the state that arrive with many “strings attached.” That’s why many counties have structural deficits that cannot be addressed without substantial policy changes. In some sense, counties are the opposite of municipalities. Where the scope of municipal government has expanded, the scope of county government has narrowed by about the same margin.
There are 3,144 counties in the US. The figure below shows revenues and spending for the 50 largest (by population) from 1977 through 2012. It’s similar to the figures above for states and municipalities. All the shaded areas above 0 are revenues, and all the area below 0 is spending. All figures are expressed in 2015 per capita dollars.
This figure shows that county governments are generally smaller and more narrow in scope than municipalities. According to the US Census of Governments, counties’ average per capita spending in 2012 was just over $1,200, where municipalities’ average spending was nearly $3,000 per capita. However, this figure also highlights some important exceptions. In the southeastern US county governments are often the major local service provider. They are responsible for schools, roads, public safety (i.e. the county sheriff), stormwater management, and most other major services. Municipal governments in the southeast have comparatively limited powers and responsibilities. That’s why Fairfax (VA), Mecklenberg (NC), Montgomery (MD), Prince Georges (MD), Shelby (TN), and Wake (NC) are orders of magnitude larger than most others. We see a similar dynamic in California. For most of California’s rural communities, the county government is the main service provider.
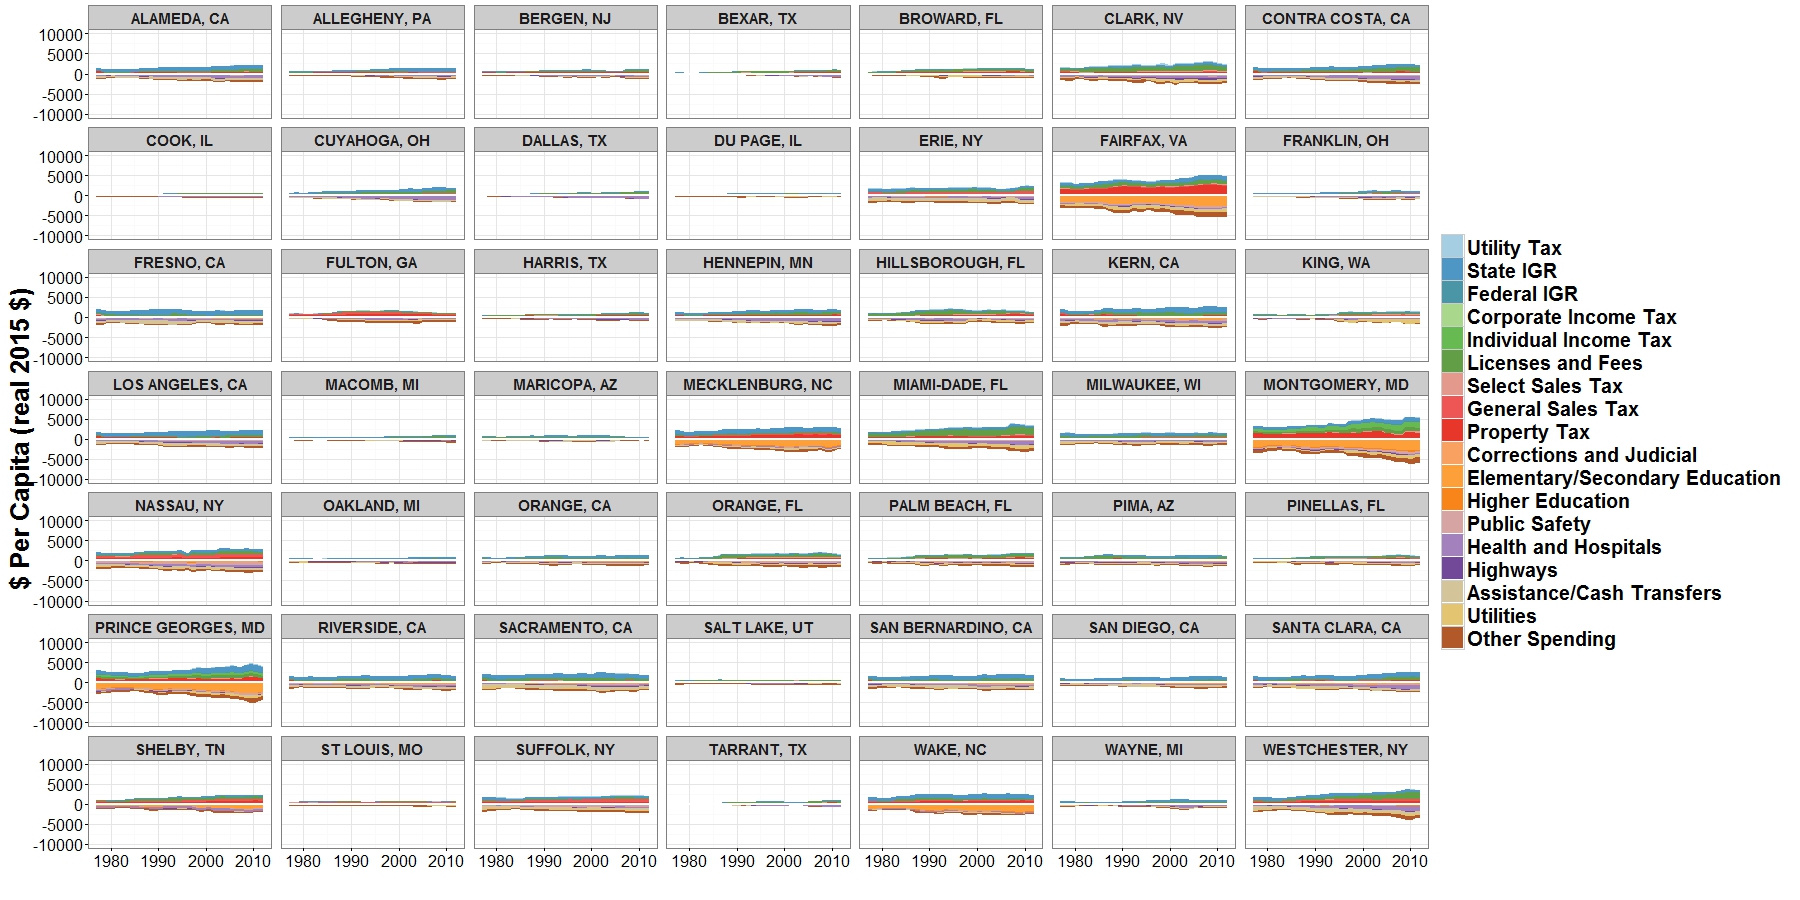
Revenues and Spending of the 50 Largest US Counties, 1977-2012; Source: Authors’ Calculations Based on US Census Data
In general, counties derive one-third of the revenues from property taxes, one-third from intergovernmental sources, and one-third from other sources including sales taxes, charges and fees, utility taxes, and others. All counties in Maryland and Indiana levy a local income tax.
On the spending side, counties have the same basic spending patterns as municipalities. Public safety and infrastructure are typically the largest spending items. At the same time, counties also manage services where a broader geographic reach, relative to municipalities, is more practical and economical. Elections, for example, are usually a county function. Instead of dozens of municipalities conducting their own elections, county governments manage county-wide elections that cover all the municipal and county officials elected within the county. Tax administration is another example. Property assessors are usually positioned within a county government but execute property assessments for all the municipalities and other taxing jurisdictions within their county. For this same reason counties are usually responsible for a majority of human service programs including public health and mental health services.
Special Districts
Special districts are local units of government that are independent from counties and municipalities. They are called many different things, including public authorities, special-purpose districts, autonomous governments, special taxing districts, and public corporations, among others. By definition, they’re narrow in scope. Most special districts are authorized by their respective state governments to deliver one particular service. School districts are authorized to collect property taxes and operate public schools. Utility districts are authorized to deliver electricity to customers and collect fees in exchange. Hospital districts are authorized to operate public hospitals and collect fees, grants, and other revenues to that effect. And so forth.
The term “special district” means radically different things in different settings. Consider the following examples:
- The Milwaukee (WI) Metropolitan Sewerage District (MMSD) is a regional agency that provides wastewater and stormwater management services for about 1.1 million people. Its service area covers 411 square miles that includes six watersheds. It is one of the largest urban sewerage districts in the country. In 1996 it contracted out most of its basic operations to the private firm United Water, making it the largest urban sewer system in the US under private management. It collects revenues from charges to businesses and homes who use its sewer system, a .5% property tax on all land within the District, state and federal grants, and sales of “Milorganite,” an organic compost product it developed and patented, among other revenue sources. In 2015 it spent $252 million and employed 1,200 people.
- The Port of Seattle (WA) manages one of the fastest growing airports in the world (Seattle-Tacoma International Airport), the third largest cargo container port on the west coast, a real estate portfolio worth more than $15 billion, and a variety of technical education programs that train young people to work in the maritime and aviation industries. It employs 1,800 people and in 2015 it spent $336 million. It collects revenues from rental fees paid by airlines and shipping companies, fees on cargo and airline passengers, and real estate rentals and sales. It also has authority to levy a property tax.
- The Barberton-Norton (OH) Mosquito Abatement District manages populations of “biting arthropods” across 60 square miles of northeast Ohio. In its own words, the District is successful if “you can prepare a picnic, play cards by moonlight, even sit on your front porch without the hassle of mosquitoes.” It employs 3 full-time staff and in 2015 it spent $784,000. It’s sole revenue source is a .05% property tax.
- The Holley-Navarre (FL) Fire District began as a volunteer fire squad with no equipment or funding. It operated from 1965 through 1980 using borrowed equipment and was funded solely by donations. In 1980 the District was created by a special act of the Florida legislature. Today it covers approximately 50 square miles in the Florida “panhandle,” with 30 full time firefighters across four fire stations. In 2015 it spent $2.5 million. All its revenue is from property taxes and impact fees (i.e. excise taxes levied on new construction).
- The New Jersey Sports and Exposition Authority (NJSEA) is the planning and land use agency for a 30 square mile area just across the Hudson River from New York City. It was created in 1971 to develop sports and entertainment facilities near the “Meadowlands,” a marshy and heavily polluted former industrial area (see the opening credits of “The Sopranos”). Today it manages Met Life Stadium (home of the New York Giants and New York Jets of the NFL), IZOD Arena (former home of the New Jersey Devils of the National Hockey League), and several other racetracks, convention facilities, aquariums, and amusement parks. In 2015 the New Jersey Meadowlands Commission, the authority originally tasked with land use planning and restoration of the Meadowlands, was folded into the NJSEA. As a result of that merger the NJSEA now delivers services that include planning, zoning, floodplain management, solar energy, methane recovery, a marina, and pontoon boat cruises. In 2014 it employed 85 full-time staff and spent $90 million. It derives most of its revenue from rental fees and leases, and a local tourism tax paid on hotel rooms and rental cars.
- The Utah Housing Corporation is a statewide authority created by the Utah legislature in 1975. It’s mission is to raise funds to make housing affordable for lower-income Utah households. It does this mostly by offering home loans – or mortgages – to first time home buyers and to developers building or renovating affordable apartment projects. The Authority is self-supporting and raises hundreds of millions of dollars each year through prartnerships with banks, real estate developers, realtors, and others. In 2015 it employed 80 people and spent $75 million. It collects interest payments on its mortgages, it buys and sells mortgages for a profit, and it receives corporate donations.
Special districts deliver a wide variety of local government services, and the variation in their scope and scale is staggering.
They are the most dynamic area of public finance today. According to the US Census Bureau, in 1977 there were just under 26,000 special districts in the US. Today there are just under 40,000. The figure below shows the growth in special district revenues and spending from 1977-2012. Each line represents the total revenues (solid lines) and total spending (dashed lines) for eight different types of special districts. Most districts increased their total revenues and spending by 30-75% during this period. Spending and revenues in the “other” category – which includes soil and water conservation, libraries, cemeteries, parks and recreation, and many other types of districts – increased more than 200% during this time. Also note that like state and local governments, special districts’ aggregate spending is less than their aggregate revenues. This is because special districts, like states, municipalities, and counties, must balance their budgets.
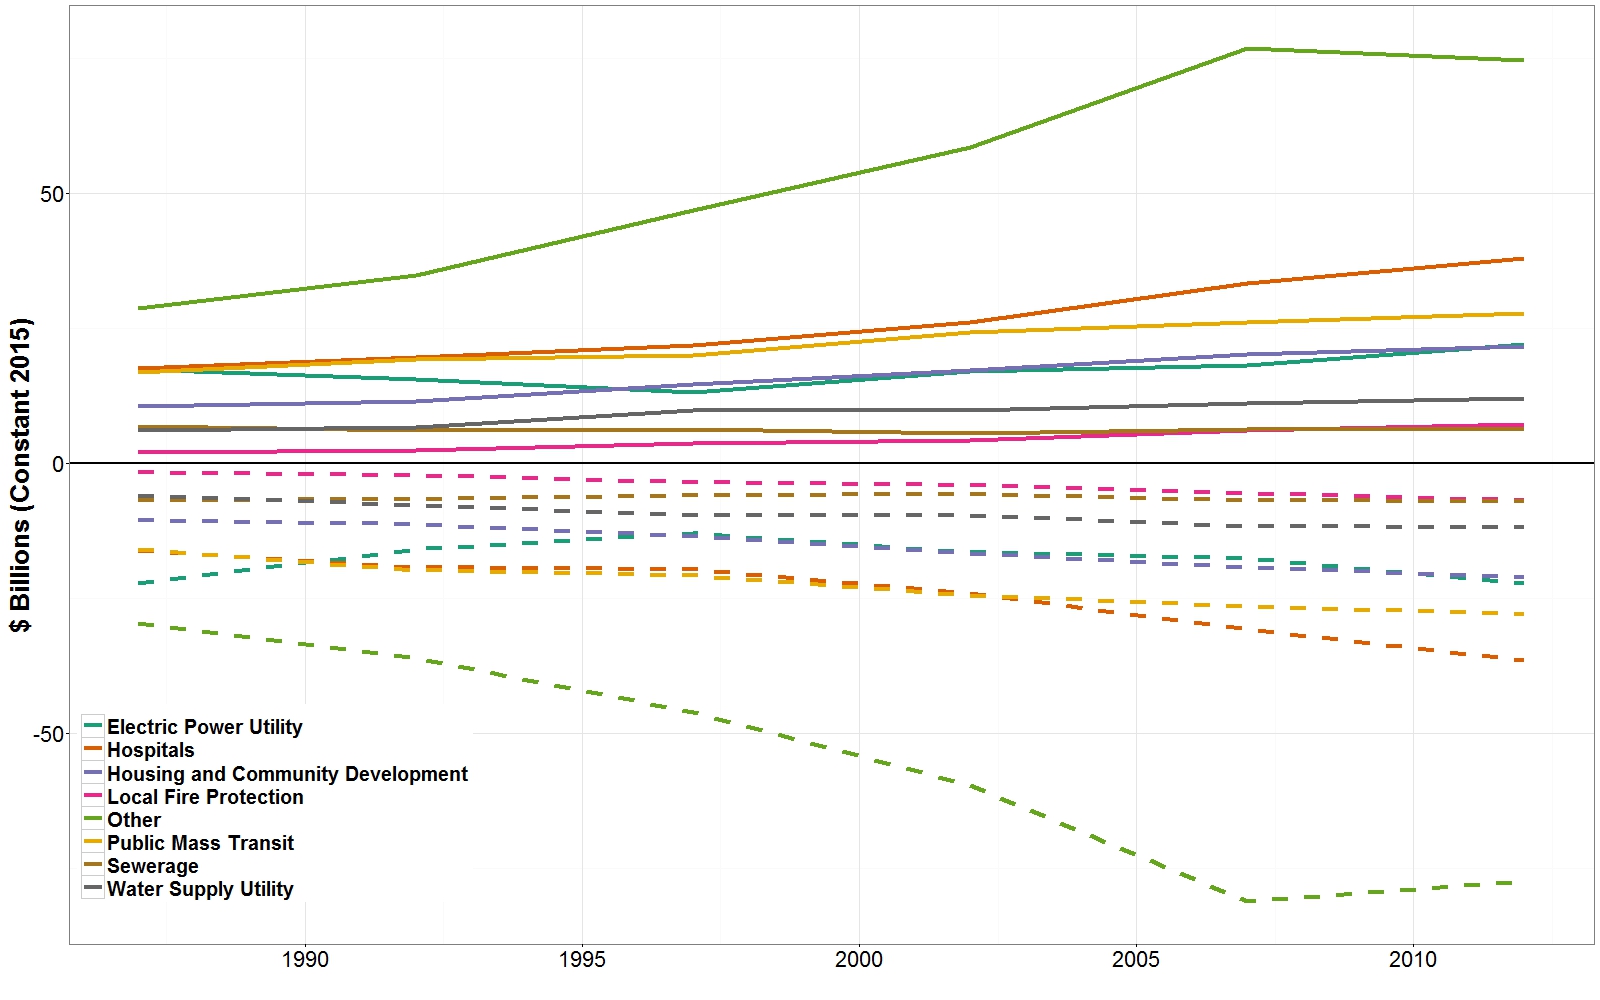
Total Special District Revenues and Spending by Type of District, 1987-2012; Source: Authors’ Calculations from US Census of Governments Data; Note: School Districts excluded.
The next figure shows the composition of special districts’ revenues. This figure is based on data from 2012 only. It shows each revenue source as a percentage of total revenues for each type of special district. For example, in 2012 public hospitals derived 77% of their revenues from charges and fees. In other words, a typical hospital earns revenue by collecting fees from patients (and patients’ health insurers including Medicare and Medicaid). Public hospitals levy property taxes (12%) and receive federal (4%) and state (7%) intergovernmental revenues.
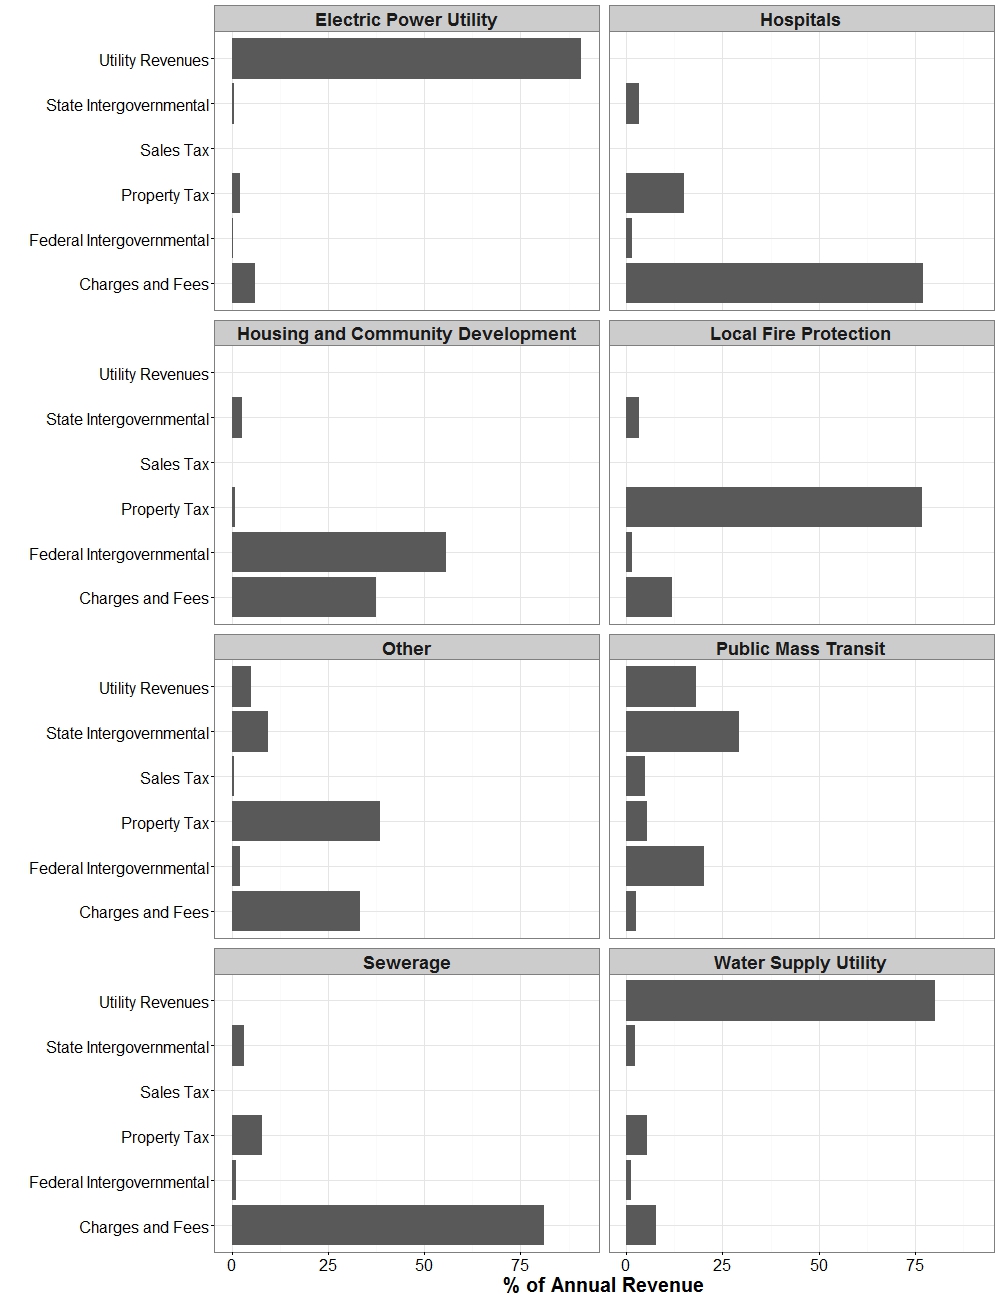
Revenue Composition of US Special Districts by Type of District, Year 2012; Source: Authors’ Calculations Based on US Census of Governments Data; Note: Figures may not add to 100% due to rounding and excluding of smaller categories
The key takeaway from this chart is that most special districts depend on one or two main revenue sources. This is not a coincidence. State and local legislatures typically grant special districts limited taxing authority. That said, many districts are deeply engaged in business-type activities where they deliver a specific service to a particular customer in exchange for a fee. This is quite different from state and local governments where taxpayers pay general revenue sources like property and sales taxes, and receive general services like public safety and public health.
What accounts for the explosive growth of special districts? Two, sometimes contradictory factors. First, special districts allow for more direct taxpayer control. If citizens receive a service through their municipal or county government, and they wish to change how they pay for that service or how that service is delivered, they can only affect that change through their city council member or other local representative who must also attend to dozens of other service delivery concerns. With special districts, citizens elect a separate governing body that attends only to that specific service, and they pay taxes or fees dedicated to that service. The relationship between governance, funding, and service delivery is, in concept, much clearer.
Fire protection is a good example. Citizens in unincorporated areas (i.e. areas that fall outside the boundaries of any municipality) often receive fire protection from a county government or nearby municipality. In rural communities that are growing often want better fire protection. In the event of a fire, they’d rather not wait for the county or nearby municipal fire service to arrive. They’d much rather have local firefighters who understand the local terrain and can offer specialized services that a municipal or county fire service is less likely to deliver, like wilderness rescue and wildfire prevention and outreach. So they’ll create a local fire protection district, pay a specialized property tax to that district, and elect a specialized fire protection district board. We see a similar dynamic in service areas like flood control, agricultural irrigation, and parks. It’s also quite common in the western US, where local political culture tends to favor populist, local control of government. For instance, Tennessee and Washington State have roughly the same population. Tennessee has 347 municipal governments and 475 special districts. Washington State has 281 municipal governments and 1,670 special districts.
Special districts have also proliferated because they can help citizens circumvent tax and expenditure limitations. Sometimes those limitations are political. For instance, taxpayers across the country have voted often to move traditional municipal services like libraries and parks from their municipal government to a special district. When these services are delivered through a special district they have a dedicated revenue source. They need not compete with public safety, roads, water/sewer, and other municipal services for limited tax dollars. And sometimes those limitations are legal. For example, school districts in many states must get voter approval for new school buildings. Before a district can borrow money to build, voters must approve the additional property taxes needed to pay back that borrowed money. Voters in many districts are reticent to approve those additional property taxes. So as an alternative, a district can authorize the creation of a school building authority. That authority will borrow money, build the new school building, lease the building to the district, and then repay the borrowed money with the district’s lease payments. At one point in the early 2000s, nearly half the public school buildings in Texas were financed through this “leaseback” model.
This proliferation presents a variety of trade-offs for governance and accountability. Special districts do offer more local control, but the evidence suggests they often do the opposite. Voter turnout for special district elections is usually among the lowest for all elected offices. Academic research shows citizens rarely know that special districts even exist, and almost never know who they voted for in the last special district election. So there’s little evidence that special districts offer better democratic accountability. Another practical concern is that the proliferation of special districts has drastically increased the total amount of local government debt outstanding. This raises a variety of concerns about whether local governments are able to repay those debts.
Non-Profits
Non-profits are big business! According to the National Center for Charitable Statistics, in 2013 there are approximately 1.4 million nonprofit organizations registered with the Internal Revenue Service (IRS). They collected $1.73 trillion of revenue and spent $1.62 trillion. Collectively, they contribute an estimated $900 billion to the US economy each year and employ almost 10% of the entire US workforce.
To understand where non-profits get their money and where their money goes you must first understand the many different types of organizations that comprise the “non-profit sector.”
The table below illustrates some of these differences. It shows the ten largest non-profits by expenses in 2014. The “All” category covers all non-profits, and the other four categories are specific types: environment, human services, international, and civil rights. Abbreviations in parentheses are the state where that non-profit is incorporated. Most of the organizations listed here are incorporated in one state but have a national presence.
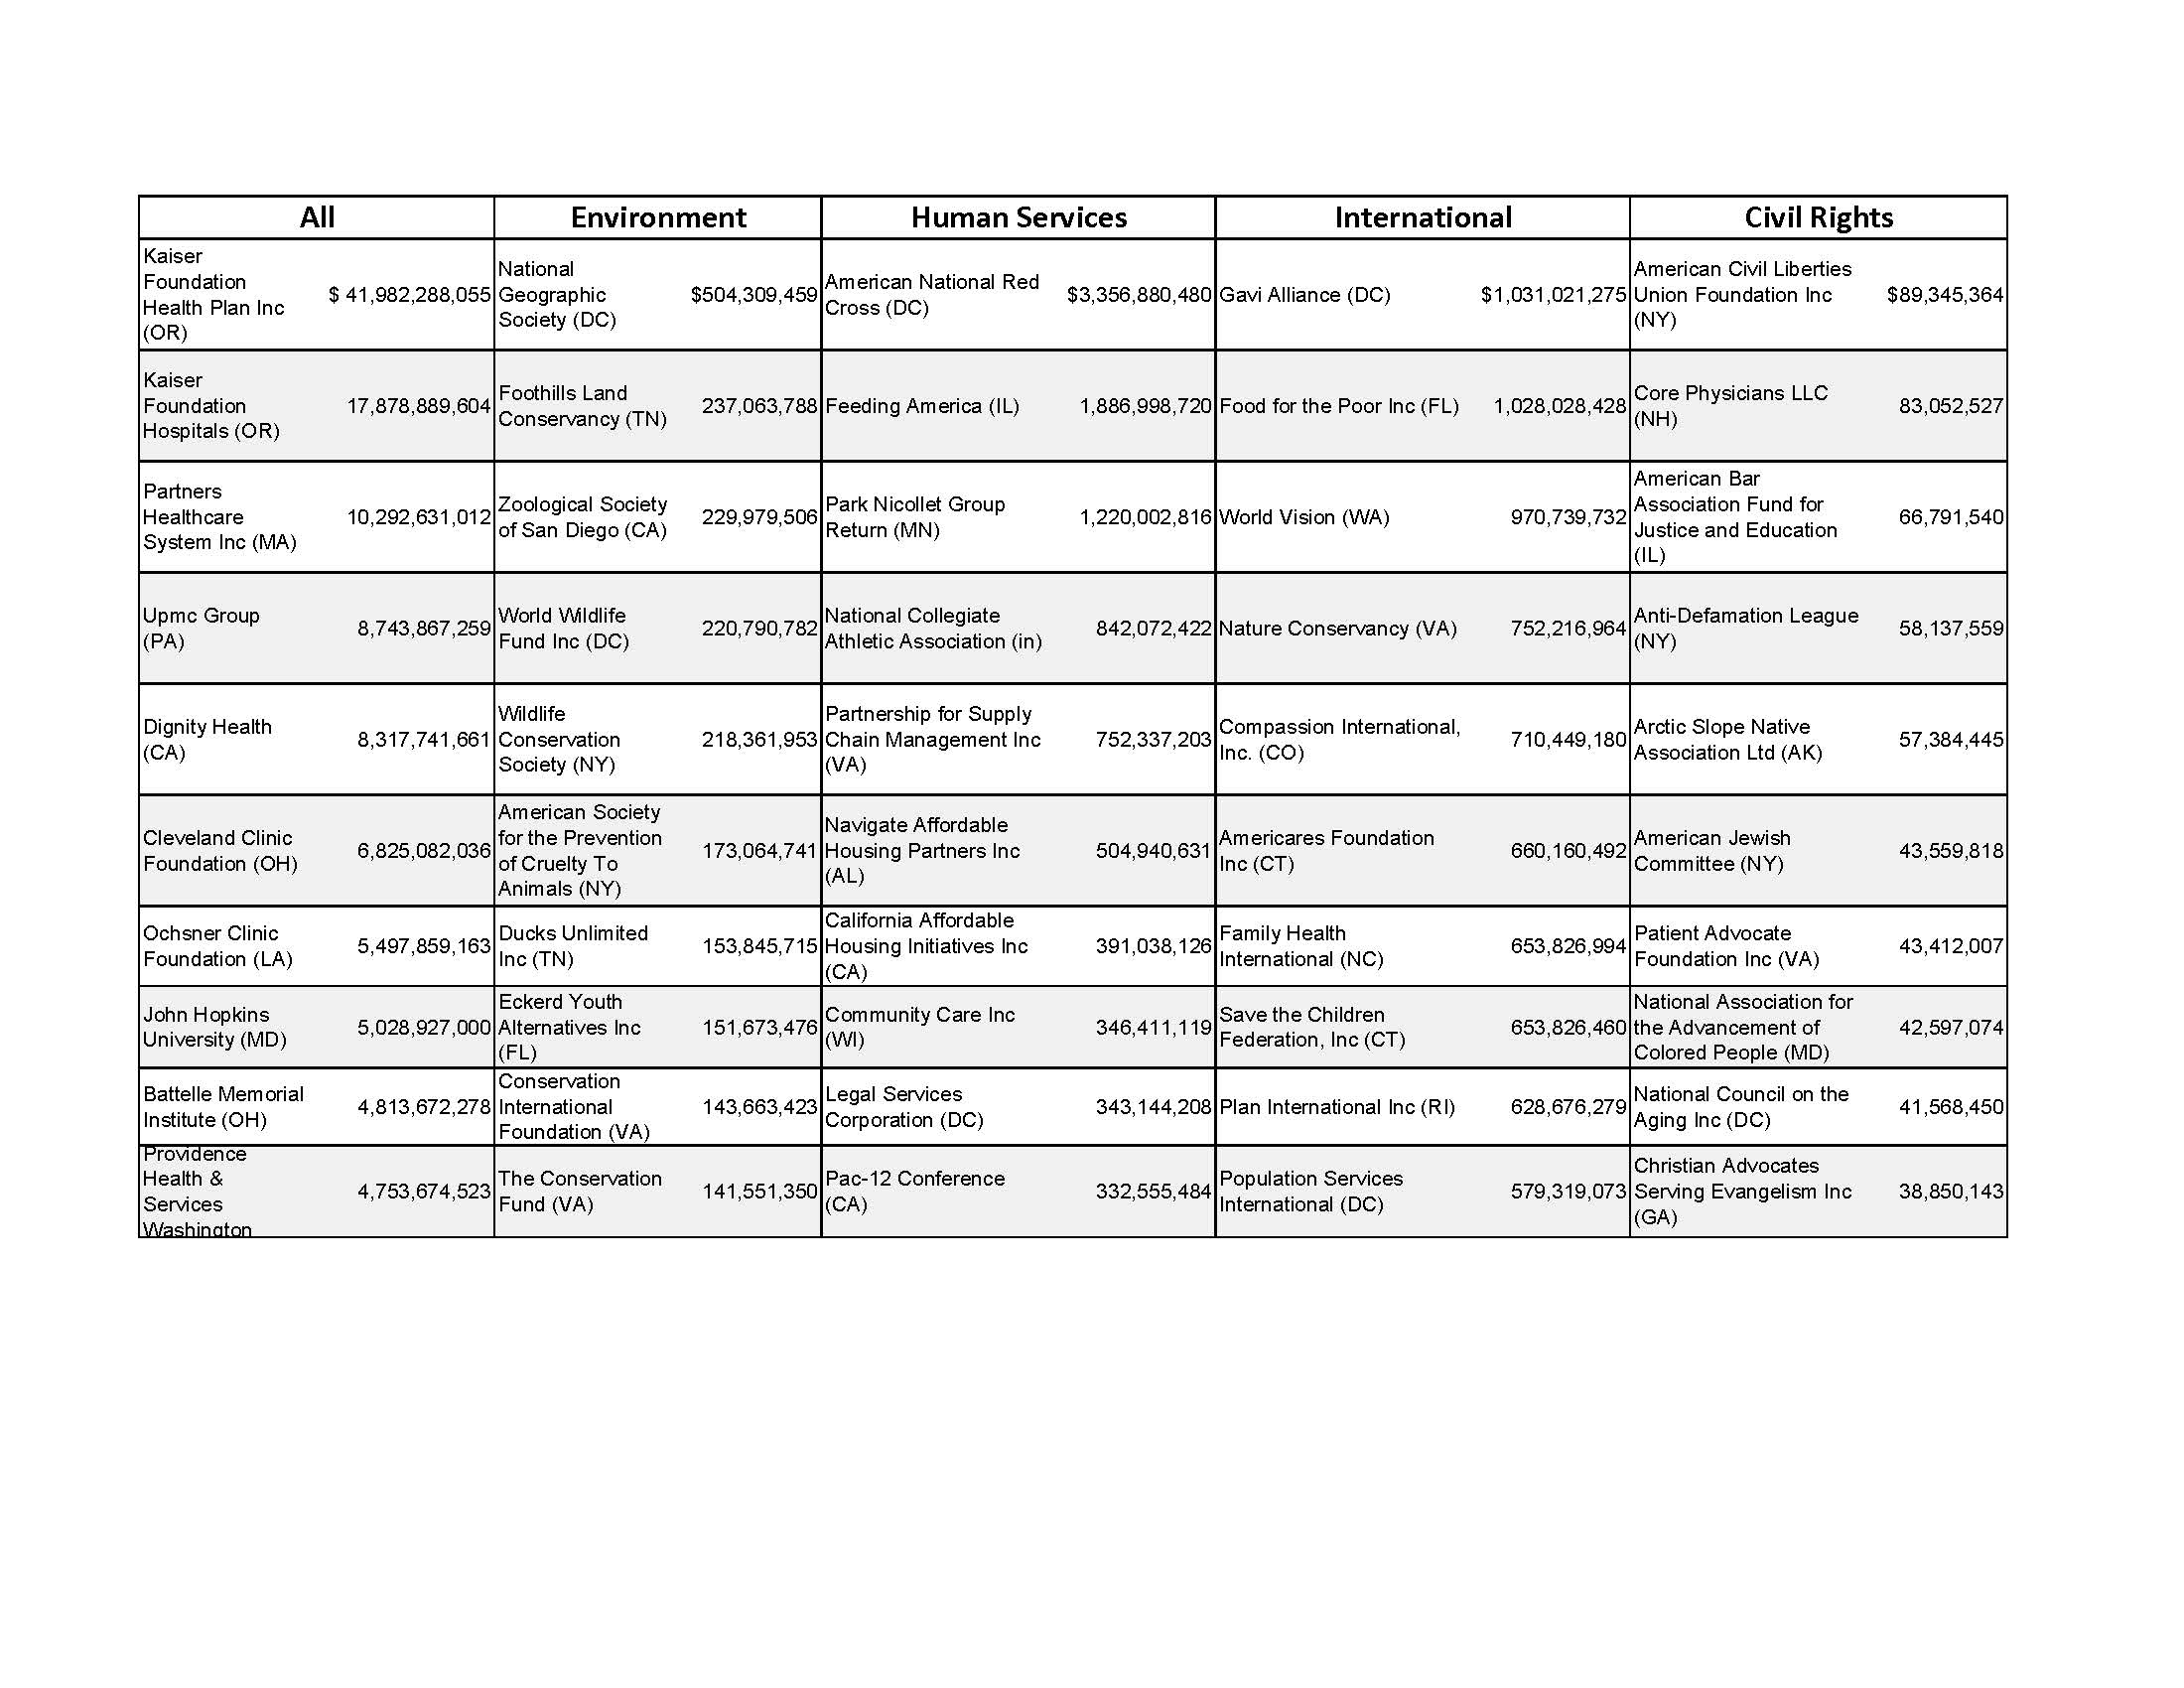
Ten Largest Non-Profits by Total Expenses in 2014, by Type of Organization; Source: National Center for Charitable Statistics
A few key trends stand out. Eight of the ten largest US non-profits are health care organizations. Some are health systems that employ physicians, nurses, and other networks of health care providers. Others are health insurance companies. Some are research institutions that focus on health care. It’s also noteworthy that many of these large health care organizations defy the conventional wisdom that “non-profit” means “not profitable.” For instance, Dignity Health, the fifth largest overall non-profit, reported profits in excess of $550 million in 2015. The other health care organizations are similarly profitable.
How can an organization be so profitable yet remain “non-profit”? Because “non-profit” is a tax distinction, not a business model. Non-profit organizations do not pay state and local taxes, and they receive a considerable subsidy through a tax preference (see below). We grant them these benefits because they deliver goods and services that benefit the public. Most non-profit hospitals accomplish this by delivering free or low-cost health care to people who can’t afford it. As long as they provide that service, there’s little if any restriction on how much profit they can earn.
Note also the staggering variety of services provided and populations served. Many of those services are not unlike governments. Non-profits conserve land for future generations, manage affordable housing programs, and provide pro bono legal services for the poor. Like governments, most of their money is spent on employee wages and benefits. And like governments, the non-profit sector is comprised of thousands of small organizations but dominated by a handful of larger organizations. In fact, by some estimates, more than half of all non-profits have total annual revenues less than one million dollars.
But non-profits are also quite different from governments. Many non-profits are deeply engaged in political advocacy. They fight for everything from endangered species to vulnerable populations around the world. And unlike governments, who are funded mostly through general taxes, almost half of non-profit revenue is “fee-for-service” or “exchange like” transactions. This includes everything from tuition payments to revenues from sales of specialty goods, club memberships, patient revenues etc.
That said, keep in mind that non-profits and governments interact in two crucial ways. Revenues from government sources, including government contracts and Medicare/Medicaid, account for just under one-quarter of non-profit revenues. Government grants represent another eight percent. Put differently, more than one-third of non-profit revenue is directly connected with government. Also note that government revenues are not distributed evenly across non-profits. In fact, a large portion of non-profits, perhaps as much as 20-30%, depend on governments for more than half of their revenues. This suggests that many non-profits are not necessarily independent entities with their own mission and organizational capacity, but rather low-priced government contracts. In later chapters we explore some of the advantages, disadvantages, and criticisms of this part of the nonprofit-government nexus.
Governments also support the non-profit sector through a powerful tax preference. The federal government and most state governments offer a tax deduction for charitable giving. Donors give to non-profits for many reasons. Perhaps they like a non-profit’s mission or strategy. Maybe they or someone they know received that organization’s services. Or, maybe the decision to give had a lot to do with tax planning. When a donor gives to a non-profit, that donor’s taxable income is reduced by the amount of that gift. So for many individuals and corporations, in addition to supporting their favorite non-profit, charitable giving can also reduce their income tax liability, by sometimes up to 50%. According to the US Congress’ Joint Committee on Taxation, the charitable deduction costs the federal government about $50 billion annually, in foregone revenue.
There is considerable controversy around the deduction. Some believe it only benefits the wealthy and does little to encourage giving. Others believe that highly profitable non-profit organizations, including many of the health care entities listed above, do not need or deserve an implicit government subsidy.
Practice Problems
- What are the three biggest financial challenges that public organizations will face in the next decade? What opportunities do those challenges present to sophisticated public financial managers?
- You are the City Manager of the City of Whoville and are considering options to raise new revenues. Describe the advantages, disadvantages, and implications for fairness of the following:
- Increase property taxes
- Increase user charges and fees
- Implement a local sales tax
- In 2013 the City of Pittsburgh, PA sued the University of Pittsburgh Medical Center (UPMC). The goal of the lawsuit was to strip UPMC of its tax-exempt status. According to the City’s compliant, UPMC does not deliver adequate charity care to justify its tax-exempt status, does not contribute any payments in lieu of taxes (PILOTs), and pays its executives lavish compensation packages. Had the City won in court, it planned to impose a .55% income tax on wages earned by UPMC employees. UPMC counter-sued, claiming it had been unfairly singled-out among Pittsburgh’s dozens of large tax-exempt organizations. The City dropped its suit in July 2014, and both sides have since been negotiating a solution. What are the advantages and disadvantages of the City’s proposed income tax? How would you suggest Pittsburgh and UPMC resolve this conflict?
- You are the chief finance officer (CFO) of the City of Pulaski and are about to borrow $10 million for repairs to your city sewer system. A week before you’re scheduled to close on the borrowing with your lender, the Federal Reserve announces its intention to increase the Federal Funds Rate by 0.25%. How will this affect your sewer system project?
- Throughout the 2016 Presidential election virtually every candidate has proposed “comprehensive federal income tax reform” that would require “closing the loopholes and lowering the rate.” What are these “loopholes,” and how would closing them allow for a lower federal income tax rate? What other financial or economic implications might follow from closing those loopholes? Is a lower tax rate good fiscal policy?
- In 2014 voters in the City of Seattle, WA voted to create a Metropolitan Parks District. This new District has the power to levy its own property tax, and its borders are contiguous with the City of Seattle. Through an interlocal agreement, the City agreed to receive all of its parks services from the new District for the next 20 years. What are the advantages and disadvantages of this approach to funding parks?