2. Rich and Poor
The World Bank divides the world’s economies into 4 groups – low income, lower-middle income, upper-middle income, and high income – based on their GNI per capita measured in current USD. The income classification thresholds are denoted in nominal terms but kept constant in real terms by annual adjustments for inflation.
The first two columns of Table 5 show the income levels the World Bank classifications are based upon for 2021. Notice the large difference between the threshold levels for low- and high-income economies, which signals the large disparities between rich and poor in the world. In 2021, 27 countries fell into the low-income group, most of them in Africa. African and South Asian economies are also highly represented in the lower-middle income group. A diverse group of economies falls into the upper-middle income group, from large economies such as Russia, China, and Brazil to the poorest two members of the European Union, Bulgaria and Romania, and the oil rich Equatorial Guinea in Central Africa. The high-income group is the most populous, with 80 countries falling into that category in 2021. However, only one of these countries, Seychelles, is in Africa.
| Income classification* | GNI per capita (current USD) |
Life expectancy at birth, total (years) | Mortality rate, under-5 (per 1,000 live births) |
Primary school completion rate |
| Low income | < 1,046 | 64 | 68 | 66 |
| Lower-middle income | 1,046 – 4,095 | 49 | 49 | 90 |
| Upper-middle income | 4,096 – 12,695 | 72 | 35 | 92 |
| High income | > 12,695 | 81 | 5 | 98 |
* Income classification is based on data for 2021
Low income (27 countries): for example, most sub-Saharan Africa, North Korea, Syria, Yemen, and Afghanistan
Lower-middle income (55 countries): for example, many in Africa, former Soviet Union, Caribbean, Middle East, most of South Asia
Upper-middle income (55 countries): for example, Brazil, Mexico, China, Russia, South Africa, Turkey, Bulgaria, and Thailand
High income (80 countries): for example, United States, Canada, most of Europe, Japan, Korea, Chile, Saudi Arabia, and Israel; only one, Seychelles, in Africa
Data Source: World Bank
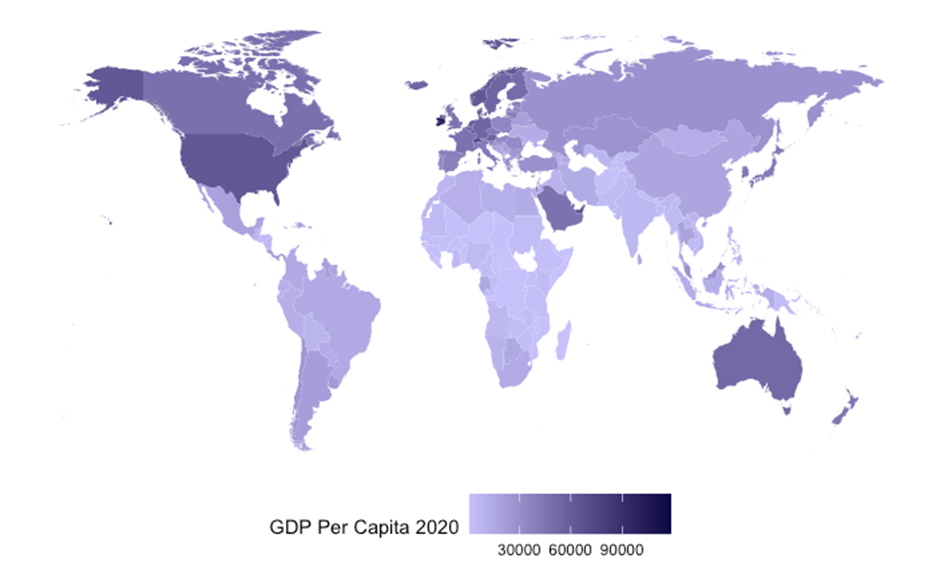
The stark disparities between rich and poor are easy to spot on the map in Figure 2, which depicts real GDP per capita around the world. The darker the purple colour, the higher the average standard of living in the country. For example, the average person in Canada in 2020 enjoyed a standard of living five times higher than that of the average person in the Philippines, a developing country. In general, there are large inequalities in the standard of living across the world.
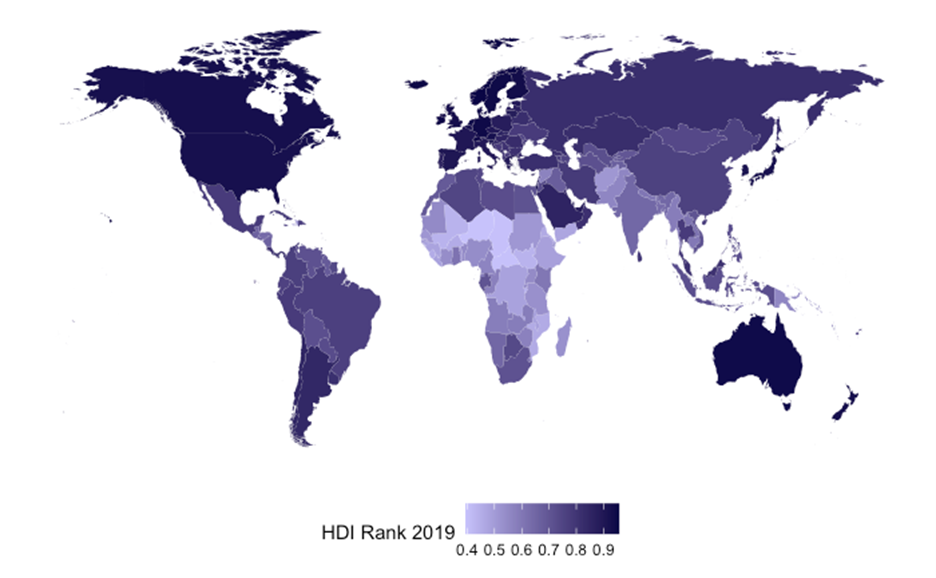
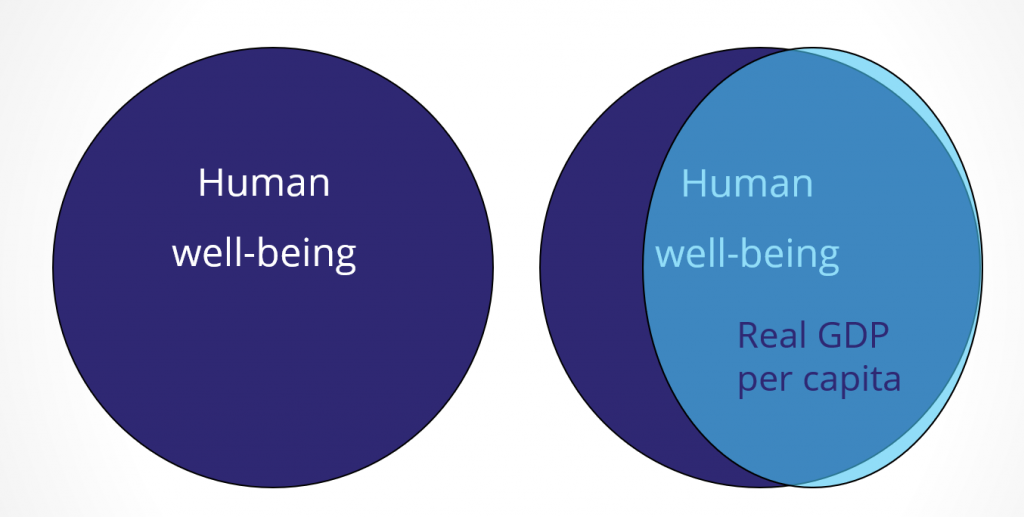
Compare Figure 2 to Figure 3, which depicts the Human Development Index (HDI) around the world. As before, the higher the HDI, the deeper the purple colour on the map. Computed by the United Nations Development Programme, HDI is intended as a broader measure of human well-being than real per capita GDP. HDI is a summary measure of average achievement in three key dimensions of human development: a long and healthy life, being knowledgeable, and having a decent standard of living. Notice the high correlation in the HDI/GDP data used for the two maps – richer countries tend to have higher HDI. While real GDP is not a perfect measure of well-being, it is positively correlated with a broad range of indicators of quality of live across nations. Live during growth does tend to be better – people in richer countries tend to enjoy longer and healthier lives and more and better quality of education. However, the correlation is not perfect reflecting national policy choices. For example, Greece has the same HDI in 2019 as the United Arab Emirates (UAE), but its real income per capita is less than half that of the UAE. Equatorial Guinea has real per capita income comparable to that of Serbia in 2019. However, Equatorial Guinea’s 2019 HDI index positions the country in the medium human development category while Serbia falls in the very high human development category (ranked 145 and 64, respectively, of 189 countries).
Compare the Maps
As the target date for achieving the Millennium Development Goals (MDG) loomed in 2015, 17 Sustainable Development Goals (SDGs) were formally adopted by the United Nations General Assembly to govern the international development agenda until 2030. These goals, such as eradication of poverty and hunger, good health and well-being, quality of education, gender equality, reduced income inequalities, and climate action, are aspects of human well-being, which are relevant for both developed and developing nations. SDG 8 is about decent work and fostering sustained, inclusive, and sustainable economic growth, which, as we learned, is a reliable albeit imperfect indicator of welfare.
In conclusion, real GDP is an imperfect measure of economic and human well-being. Therefore, economic growth per se should not be the sole goal for an economy. However, GDP correlates with measures of prosperity that we value, and its growth is the engine for improvements in the standard of living over time. We dedicate the next section on understanding the major factors that foster economic growth.