4.3 Take-up Rates for Microinsurance
It is hoped that microinsurance will follow in the steps of its closely related cousin, microfinance, and become the next “revolution” in developing countries by enabling low-income individuals to break the poverty trap.[1] In the example given at the beginning of this module, life microinsurance could have offered a safety net to the family of the young girl living in Freetown and prevented it from slipping into poverty after the death of the breadwinner.
Emerging from the shadows of microfinance, microinsurance has witnessed an explosive growth over the last decades. In 2006, microinsurance covered 75 million low-income individuals in developing countries all over the world[2] while this number increased to 135 million in 2009[3] and up to 377 million in 2020.[4]
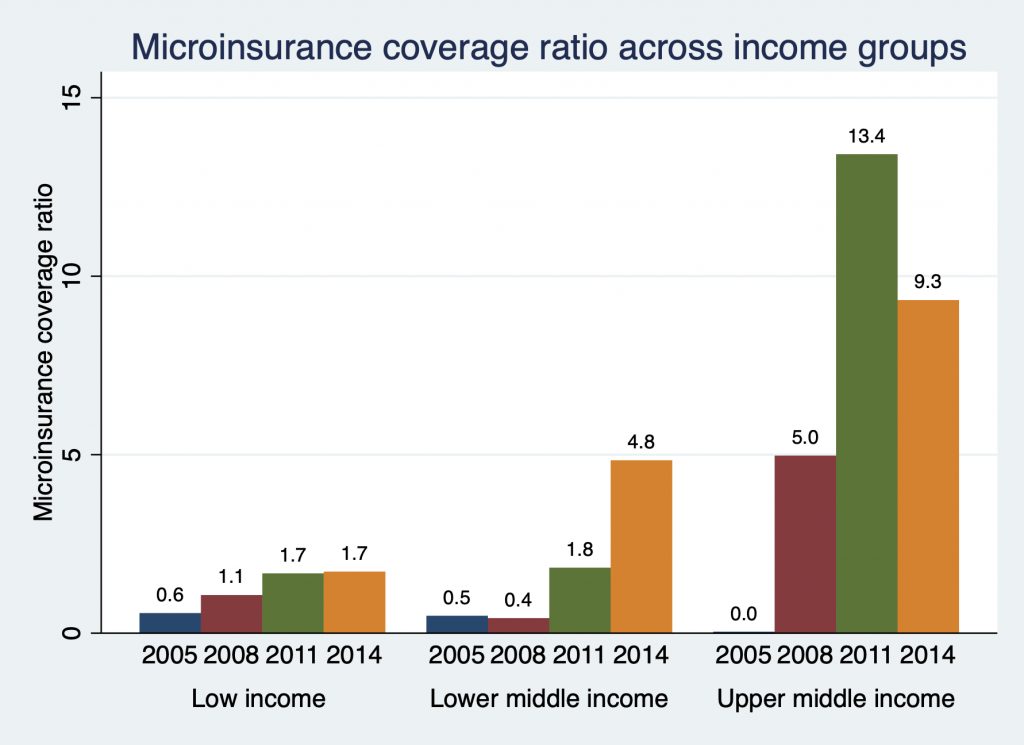
In Africa, for example, data collected by the MicroInsurance Centre at Milliman suggest that microinsurance was offered in 20 countries in 2005. This number grew to 32 in 2008 and 36 in 2014. Figure 6 shows the percentage of population with microinsurance coverage or the microinsurance coverage ratio across income groups in Africa for 2005, 2008, 2011, and 2014. Microinsurance is more prevalent in upper-middle income countries (South Africa, which has high microinsurance coverage ratio, was not included in the 2005 sample). While, on average, less than 0.5% of the African population was covered by microinsurance in 2005, this number grew to more than 3.5% in 2011 and reached about 6% in 2014. Microinsurance is still not offered in many countries in the continent. However, in Namibia and South Africa more than 50% of the population purchased microinsurance coverage in 2011. In Namibia, the microinsurance take-up rate grew from 0 in 2005 to 6.7% in 2008 and to a staggering 57.5% of the population in 2011.
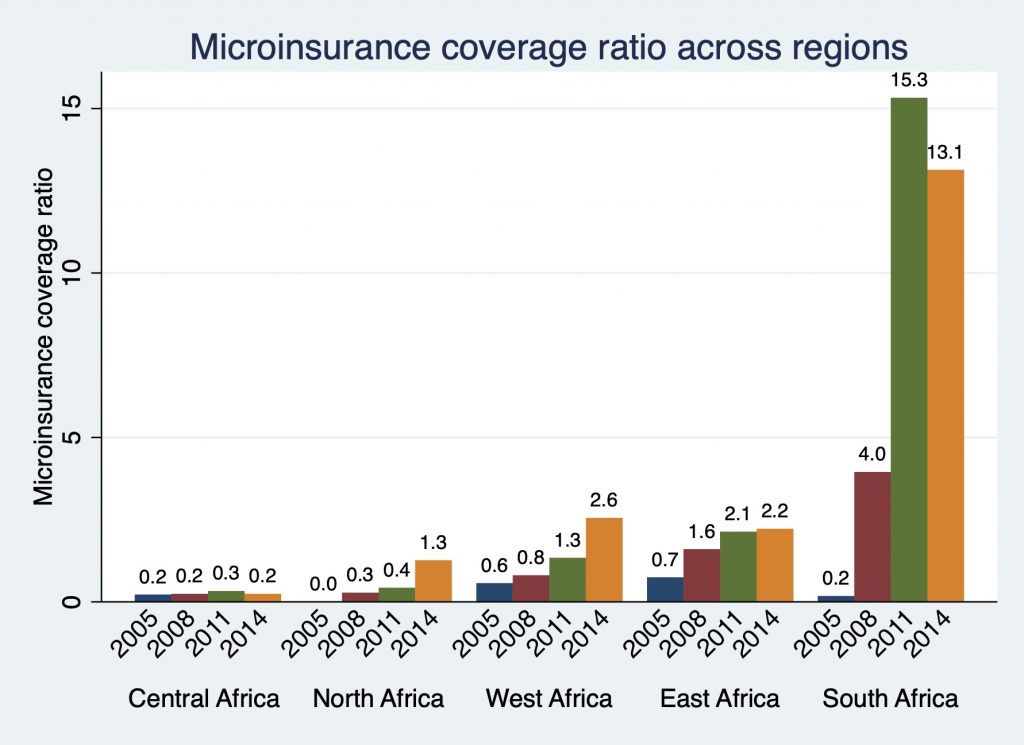
Figure 7 shows the microinsurance coverage ratio across African regions. The microinsurance coverage ratio varies substantially across geographic regions. Microinsurance is less prevalent in North and Central Africa compared to the rest of the continent.
There is a large potential market for microinsurance in developing countries. However, the current outreach of microinsurance is far below its global market potential estimated by Swiss Re at 4 billion people that could generate premium income of $40 billion.[5] This modest reach of microinsurance relative to its potential has left academicians, practitioners, and policymakers alike with what we call in economics a “puzzle,” observed economic data or empirical findings which are inconsistent with theoretical predictions.
