10 Economics

Learning Objectives
Explain the relationship between production and division of labor.
Evaluate the significance of scarcity.
Explain demand and supply, quantity demanded and supplied, and the law of demand and supply.
Introduction
What is economics and why should you spend your time learning it? After all, there are other disciplines you could be studying and other ways you could be spending your time. Making choices is at the heart of what economists study, and your decision to take this course is as much an economic decision as anything else.
Economics is probably not what you think. It is not primarily about money or finance. It is not primarily about business. It is not mathematics. What is it then? It is both a subject area and a way of viewing the world.
What Is Economics, and Why Is It Important?
Economics is the study of how humans make decisions in the face of scarcity. These can be individual decisions, family decisions, business decisions, or societal decisions. If you look around carefully, you will see that scarcity is a fact of life. Scarcity means that human wants for goods, services, and resources exceed what is available. Resources, such as labour, tools, land, and raw materials are necessary to produce the goods and services we want but they exist in limited supply. Of course, the ultimate scarce resource is time- everyone, rich or poor, has just 24 hours in the day to try to acquire the goods they want. At any point in time, there is only a finite amount of resources available for a larger demand than what is available.
Example
Think about it this way: In 2015 the labour force in the United States contained over 158.6 million workers, according to the U.S. Bureau of labour Statistics. Similarly, the total area of the United States is 3,794,101 square miles (Bureau of Labor Statistics, 2015). These are large numbers for such crucial resources, however, they are limited. Because these resources are limited, so are the numbers of goods and services we produce with them. With limited goods and services, there are bound to be situations where the demand for them exceeds the production rate, scarcity of the item a problem.
If you still do not believe that scarcity is a problem, consider the following: Does everyone need food to eat? Does everyone have access to healthcare? In every country in the world, there are people who are hungry or in need of healthcare, just to focus on a few critical goods and services. Why is this the case? It is because of scarcity. Let’s delve into the concept of scarcity a little deeper, because it is crucial to understanding economics.
The Problem of Scarcity
Think about all the things you consume: food, shelter, clothing, transportation, healthcare, and entertainment. How do you acquire those items? You may not be able to produce them yourself. You buy them. How do you afford the things you buy? You work for pay. Or if you do not, someone else does on your behalf. Yet most of us never have enough to buy all the things we want. This is because of scarcity. So how do we solve it?
Every society, at every level, must make choices about how to use its resources. Families must decide whether to spend their money on a new car or a fancy vacation. Towns must choose whether to put more of the budget into police and fire protection or into the school system. Nations must decide whether to devote more funds to national defence or to protect the environment. In most cases, there just isn’t enough money in the budget to do everything. So why do we not each just produce all of the things we consume? The simple answer is most of us do not know how, but that is not the main reason. When you study economics, you will discover that the obvious choice is not always the right answer—or at least the complete answer. Studying economics teaches you to think in a different way. Think back to pioneer days, when individuals knew how to do so much more than we do today, from building their homes to growing their crops, to hunting for food, to repair their equipment. Most of us do not know how to do any of those things. It is not because we could not learn. Rather, we do not have to. The reason why is something called the division and specialization of labour, a production innovation first put forth by Adam Smith, in his book, The Wealth of Nations (O’rourke, 2007).
The Division of and Specialization of Labour
To illustrate the division of labour, Smith counted how many tasks went into making a pin: drawing out a piece of wire, cutting it to the right length, straightening it, putting a head on one end and a point on the other, and packaging pins for sale, to name just a few. Smith counted 18 distinct tasks that were often done by different people—all for a pin, believe it or not!
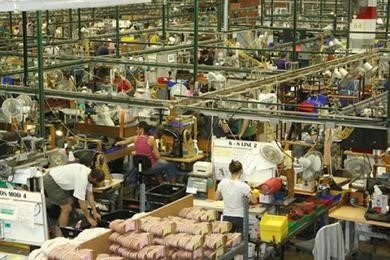
Modern businesses divide tasks as well. Even a relatively simple business like a restaurant divides up the task of serving meals into a range of jobs like a top chef, sous chefs, less-skilled kitchen help, servers to wait on the tables, a greeter at the door, janitors to clean up, and a business manager to handle paychecks and bills—not to mention the economic connections a restaurant has with suppliers of food, furniture, kitchen equipment, and the building where it is located. A complex business like a large manufacturing factory, such as the shoe factory shown in Figure 2.12, or a hospital can have hundreds of job classifications.
Why the Division of Labour Increases Production
When the tasks involved with producing a good or service are divided and subdivided, workers and businesses can produce a greater quantity of output. In his observations of pin factories, Smith observed that one worker alone might make 20 pins in a day, but that small business of 10 workers (some of whom would need to do two or three of the 18 tasks involved with pin-making), could make 48,000 pins in a day (Smith & Cannan, 2003). How can a group of workers, each specializing in certain tasks, produce so much more than the same number of workers who try to produce the entire good or service by themselves? Smith offered three reasons.
First, specialization in a particular small job allows workers to focus on the parts of the production process where they have an advantage. Now in modern-day extreme specialization, such as the pin example, is rather rare. Instead, the specialization that is sought out for is a specialization within an area of study. An example would be an HR generalist having to know how to perform payroll, recruitment, training, and more. This HR generalist is a jack of all trades under the HR duties but a specialist in HR. People have different skills, talents, and interests, so they will be better at some jobs than at others. The particular advantages may be based on educational choices, which are in turn shaped by interests and talents. Those who have an interest in biology may go on to pursue a medical degree and qualify to become doctors, for instance. This can be a benefit since those with an interest in their field of study tend to be more motivated in their field of work rather than someone who is unmotivated (R, H, 2019). For some goods, the specialization will be affected by geography—it is easier to be a wheat farmer in Bradford than in Toronto, but easier to be a hotel operator in Toronto than in Bradford. If you live in or near a big city, it is easier to attract enough customers to operate a successful dry cleaning business or movie theatre than if you live in a sparsely populated rural area. In theory, if people specialize in the production of what they do best, they will be more productive than if they produce a combination of things, some of which they are good at and some of which they are not (Smith & Cannan, 2003). There are exceptions and other factors that should be taken into accounts such as happiness and mental well being of a person, but most of the time this theory is held true. Imagine a business organization, there will be a department of different specialization, from marketing, accounting, finance, and HR, it’s more effective to work with 4 specialists in each field of work rather than have 4 jack of all trades. This is so that everyone can work at their peak since they focus so much of their efforts into one subject.
Second, workers who specialize in certain tasks often learn to produce more quickly and with higher quality. This pattern holds true for many workers, including assembly line labourers who build cars, stylists who cut hair, and doctors who perform heart surgery. In fact, specialized workers often know their jobs well enough to suggest innovative ways to do their work faster and better (O’rourke, 2007). Even small things like memorizing a building’s layout enough to path efficiently is an example of more efficient work.
Third, specialization allows businesses to take advantage of economies of scale, which means that for many goods, as the level of production increases, the average cost of producing each individual unit declines. For example, if a factory produces only 100 cars per year, each car will be quite expensive to make on average. However, if a factory produces 50,000 cars each year, then it can set up an assembly line with huge machines and workers performing specialized tasks, and the average cost of production per car will be lower. The ultimate result of workers who can focus on their preferences and talents, learn to do their specialized jobs better, and work in larger organizations is that society as a whole can produce and consume far more than if each person tried to produce all of their own goods and services. The division and specialization of labour have been a force against the problem of scarcity.
Why Study Economics?
Now that we have an overview of what economics studies, let’s quickly discuss why this is a field of study worth acknowledging. Economics is not primarily a collection of facts to be memorized, though there are plenty of important concepts to be learned. Instead, economics is better thought of as a collection of questions to be answered or puzzles to be worked out. Most important, economics provides the tools to work out those puzzles.
- Virtually every major problem facing the world today, from global warming to world poverty, to the conflicts in Syria, Afghanistan, and Somalia, has an economic dimension. If you are going to be part of solving those problems, you need to be able to understand them. Economics is crucial.
- It is hard to overstate the importance of economics to good citizenship. You need to be able to vote intelligently on budgets, regulations, and laws in general. When the U.S. government came close to a standstill at the end of 2012 due to the “fiscal cliff,” what were the issues involved? Do you know?
- When you read articles about economic issues, you will understand and be able to evaluate the writer’s argument. When you hear classmates, co-workers, or political candidates talking about economics, you will be able to distinguish between common sense and nonsense. You will find new ways of thinking about current events and about personal and business decisions, as well as current events and politics.
The study of economics does not dictate the answers, but it can illuminate different choices.
Microeconomics and Macroeconomics
Economics is concerned with the well-being of all people, including those with jobs and those without jobs, as well as those with high incomes and those with low incomes. Economics acknowledges that the production of useful goods and services can create problems of environmental pollution. It explores the question of how investing in education helps to develop workers’ skills. It probes questions such as how to tell when big businesses or big labour unions are operating in a way that benefits society as a whole and when they are operating in a way that benefits their owners or members at the expense of others. It looks at how government spending, taxes, and regulations affect decisions about production and consumption.
It should be clear by now that economics covers a lot of ground. That ground can be divided into two parts: Microeconomics focuses on the actions of individual agents within the economy, like households, workers, and businesses; Macroeconomics looks at the economy as a whole. It focuses on broad issues such as the growth of production, the number of unemployed people, the inflationary increase in prices, government deficits, and levels of exports and imports. Microeconomics and macroeconomics are not separate subjects, but rather complementary perspectives on the overall subject of the economy.
To understand why both microeconomic and macroeconomic perspectives are useful, consider the problem of studying a biological ecosystem like a lake. One person who sets out to study the lake might focus on specific topics: certain kinds of algae or plant life; the characteristics of particular fish or snails; or the trees surrounding the lake. Another person might take an overall view and instead consider the entire ecosystem of the lake from top to bottom; what eats what, how the system stays in a rough balance, and what environmental stresses affect this balance. Both approaches are useful, and both examine the same lake, but the viewpoints are different. In a similar way, both microeconomics and macroeconomics study the same economy, but each has a different viewpoint.
Whether you are looking at lakes or economies, the micro and the macro insights should blend with each other. In studying a lake, the micro insights about particular plants and animals help to understand the overall food chain, while the macro insights about the overall food chain help to explain the environment in which individual plants and animals live.
In economics, the micro-decisions of individual businesses are influenced by whether the macroeconomy is healthy; for example, firms will be more likely to hire workers if the overall economy is growing. In turn, the performance of the macroeconomy ultimately depends on the microeconomic decisions made by individual households and businesses.
Microeconomics
What determines how households and individuals spend their budgets? What combination of goods and services will best fit their needs and wants, given the budget, they have to spend? How do people decide whether to work and if so, whether to work full time or part-time? How do people decide how much to save for the future, or whether they should borrow to spend beyond their current means?
What determines the products, and how many of each, a firm will produce and sell? What determines what prices a firm will charge? What determines how a firm will produce its products? What determines how many workers it will hire? How will the firm finance its business? When will a firm decision to expand, downsize, or even close? In the microeconomic part of this book, we will learn about the theory of consumer behaviour and the theory of the firm.
Macroeconomics
What determines the level of economic activity in a society? In other words, what determines how many goods and services a nation actually produces? What determines how many jobs are available in an economy? What determines a nation’s standard of living? What causes the economy to speed up or slow down? What causes firms to hire more workers or to lay workers off? Finally, what causes the economy to grow over the long term?
An economy’s macroeconomic health can be defined by a number of goals: growth in the standard of living, low unemployment, and low inflation, to name the most important. How can macroeconomic policy be used to pursue these goals? Monetary policy, which involves policies that affect bank lending, interest rates, and financial capital markets, is conducted by a nation’s central bank. For Canadians, this is the Bank of Canada. Fiscal policy, which involves government spending and taxes, is determined by a nation’s legislative body. These are just some of the issues in macroeconomics.
Demand, Supply, and Equilibrium in Markets
Demand for Goods and Services
Economists use the term demand to refer to the amount of some good or service consumers are willing and able to purchase at each price. Demand is based on needs and wants—a consumer may be able to differentiate between a need and a want, but from an economist’s perspective they are the same thing. Demand is also based on the ability to pay. If you cannot pay for it, you have no effective demand.
What a buyer pays for a unit of the specific good or service is called price. The total number of units purchased at that price is called the quantity demanded. A rise in the price of a good or service almost always decreases the quantity demanded of that good or service. Conversely, a fall in price will increase the quantity demanded. When the price of a litre of gasoline goes up, for example, people look for ways to reduce their consumption by combining several errands, commuting by carpool or mass transit, or taking weekend or vacation trips closer to home. Economists call this the inverse relationship between price and quantity demanded the law of demand (Chappelow, 2020). The law of demand assumes that all other variables that affect demand (to be explained in the next module, Figure 2.1) are held constant.
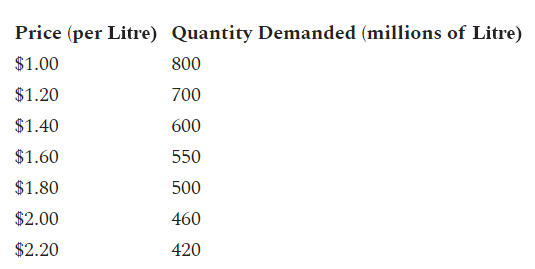
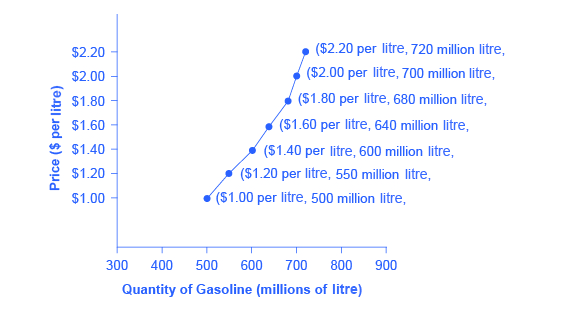
An example from the market for gasoline can be shown in the form of a table or a graph. A table that shows the quantity demanded at each price, such as Table 2.31, is called a demanding schedule. Price in this case is measured in dollars per litre of gasoline. The quantity demanded is measured in millions of litres over some time period (for example, per day or per year) and over some geographic area (like a state or a country). A demand curve shows the relationship between price and quantity demanded on a graph like Figure 2.31, with quantity on the horizontal axis and the price per litre on the vertical axis. (Note that this is an exception to the normal rule in mathematics that the independent variable (x) goes on the horizontal axis and the dependent variable (y) goes on the vertical. Economics is not math.)
The demand schedule is shown in Table 2.31 and the demand curve shown by the graph in Figure 2.31 are two ways of describing the same relationship between price and quantity demanded (Chappelow, 2020).
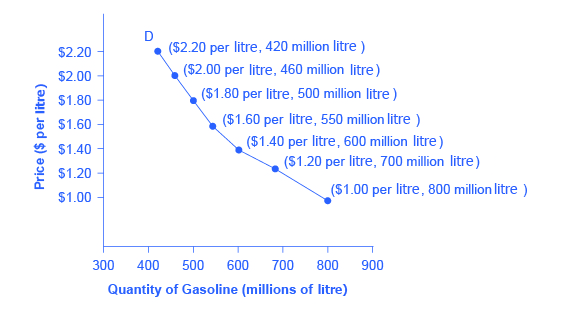
The demand schedule shows that as price rises, quantity demanded decreases and vice versa. These points are then graphed, and the line connecting them is the demand curve (D). The downward slope of the demand curve again illustrates the law of demand—the inverse relationship between prices and quantity demanded.
Demand curves will appear somewhat different for each product. They may appear relatively steep or flat, or they may be straight or curved. Nearly all demand curves share the fundamental similarity that they slope down from left to right. So demand curves embody the law of demand: As the price increases, the quantity demanded decreases, and conversely, as the price decreases, the quantity demanded increases.
Key Takeaways
Is demand the same as quantity demanded?
In economic terminology, demand is not the same as quantity demanded. When economists talk about demand, they mean the relationship between a range of prices and the quantities demanded at those prices, as illustrated by a demand curve. When economists talk about quantity demanded, they mean only a certain point on the demand curve or one quantity on the demand schedule. In short, demand refers to the curve and quantity demanded refers to the (specific) point on the curve.
Supply of Goods and Services
When economists talk about supply, they mean the amount of some good or service a producer is willing to supply at each price. Price is what the producer receives for selling one unit of a good or service. A rise in price almost always leads to an increase in the quantity supplied of that good or service, while a fall in price will decrease the quantity supplied. When the price of gasoline rises, for example, it encourages profit-seeking firms to take several actions: expand exploration for oil reserves; drill for more oil; invest in more pipelines and oil tankers to bring the oil to plants where it can be refined into gasoline; build new oil refineries; purchase additional pipelines and trucks to ship the gasoline to gas stations, and open more gas stations or keep existing gas stations open longer hours. Economists call this positive relationship between price and quantity supplied—that a higher price leads to a higher quantity supplied and a lower price leads to a lower quantity supplied—the law of supply. The law of supply assumes that all other variables that affect supply (to be explained in the next module, Figure 2.32) are held constant.
Key Takeaways
Is supply the same as quantity supplied?
In economic terminology, supply is not the same as quantity supplied. When economists refer to supply, they mean the relationship between a range of prices and the quantities supplied at those prices, a relationship that can be illustrated with a supply curve or a supply schedule. When economists refer to quantity supplied, they mean only a certain point on the supply curve or one quantity on the supply schedule. In short, supply refers to the curve and quantity supplied refers to the (specific) point on the curve.
Figure 2.32 illustrates the law of supply, again using the market for gasoline as an example. Like demand, supply can be illustrated using a table or a graph. A supply schedule is a table, like Table 2.32, that shows the quantity supplied at a range of different prices. Again, price is measured in dollars per litre of gasoline and quantity supplied is measured in millions of litres. A supply curve is a graphic illustration of the relationship between price, shown on the vertical axis, and quantity, shown on the horizontal axis. The supply schedule and the supply curve are just two different ways supply curves of showing the same information. Notice that the horizontal and vertical axes on the graph for the supply curve are the same as for the demand curve.
The supply schedule is the table that shows the quantity supplied of gasoline at each price. As price rises, quantity supplied also increases and vice versa. The supply curve (S) is created by graphing the points from the supply schedule and then connecting them. The upward slope of the supply curve illustrates the law of supply—that a higher price leads to a higher quantity supplied, and vice versa.
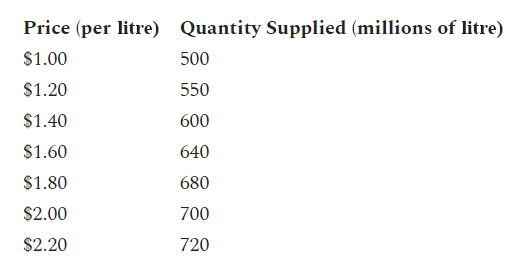
The shape of supply curves will vary somewhat according to the product: steeper, flatter, straighter, or curved. Nearly all supply curves, however, share a basic similarity: they slope up from left to right and illustrate the law of supply: as the price rises, say, from $1.00 per litre to $2.20 per litre, the quantity supplied increases from 500 litres to 720 litres. Conversely, as the price falls, the quantity supplied decreases.
Equilibrium—Where Demand and Supply Intersect
Because the graphs for demand and supply curves both have a price on the vertical axis and quantity on the horizontal axis, the demand curve and supply curve for a particular good or service can appear on the same graph. Together, demand and supply determine the price and the quantity that will be bought and sold in a market
Figure 2.33 illustrates the interaction of demand and supply in the market for gasoline. The demand curve (D) is identical to Figure 2.32. The supply curve (S) is identical to Figure 2.33. Table 2.33 contains the same information in tabular form.
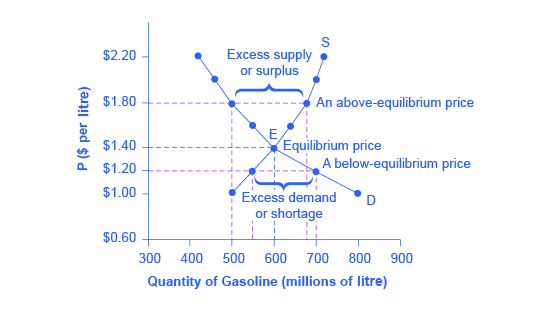
The demand curve (D) and the supply curve (S) intersect at the equilibrium point E, with a price of $1.40 and a quantity of 600. The equilibrium is the only price where the quantity demanded is equal to quantity supplied. At a price above equilibrium like $1.80, the quantity supplied exceeds the quantity demanded, so there is excess supply. At a price below equilibrium such as $1.20, quantity demanded exceeds quantity supplied, so there is excess demand.
Remember this: When two lines on a diagram cross, this intersection usually means something. The point where the supply curve (S) and the demand curve (D) cross, designated by point E in Figure 2.33, is called the equilibrium. The equilibrium price is the only price where the plans of consumers and the plans of producers agree—that is, where the amount of the product consumers want to buy (quantity demanded) is equal to the amount producers want to sell (quantity supplied). This common quantity is called the equilibrium quantity. At any other price, the quantity demanded does not equal the quantity supplied, so the market is not in equilibrium at that price.
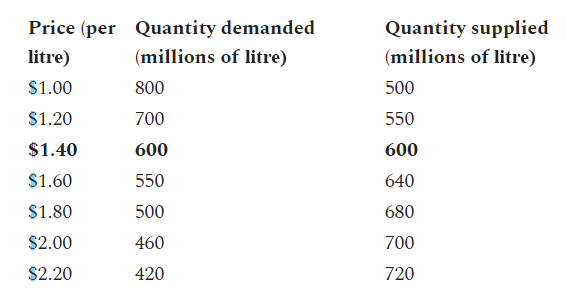
In Figure 2.33, the equilibrium price is $1.40 per litre of gasoline and the equilibrium quantity is 600 million litres. If you had only the demand and supply schedules, and not the graph, you could find the equilibrium by looking for the price level on the tables where the quantity demanded and the quantity supplied are equal.
The word “equilibrium” means “balance.” If a market is at its equilibrium price and quantity, then it has no reason to move away from that point. However, if a market is not at equilibrium, then economic pressures arise to move the market toward the equilibrium price and the equilibrium quantity.
Imagine, for example, that the price of a litre of gasoline was above the equilibrium price—that is, instead of $1.40 per litre, the price is $1.80 per litre. This above-equilibrium price is illustrated by the dashed horizontal line at the price of $1.80 in Figure 2.34. At this higher price, the quantity demanded drops from 600 to 500. This decline in quantity reflects how consumers react to the higher price by finding ways to use less gasoline.
Moreover, at this higher price of $1.80, the quantity of gasoline supplied rises from 600 to 680, as the higher price makes it more profitable for gasoline producers to expand their output. Now, consider how quantity demanded and quantity supplied are related at this above-equilibrium price. Quantity demanded has fallen to 500 litres, while quantity supplied has risen to 680 litres. In fact, at any above-equilibrium price, the quantity supplied exceeds the quantity demanded. We call this an excess supply or a surplus.
With a surplus, gasoline accumulates at gas stations, in tanker trucks, in pipelines, and at oil refineries. This accumulation puts pressure on gasoline sellers. If a surplus remains unsold, those firms involved in making and selling gasoline are not receiving enough cash to pay their workers and to cover their expenses. In this situation, some producers and sellers will want to cut prices, because it is better to sell at a lower price than not to sell at all. Once some sellers start cutting prices, others will follow to avoid losing sales. These price reductions in turn will stimulate a higher quantity demanded. So, if the price is above the equilibrium level, incentives built into the structure of demand and supply will create pressures for the price to fall toward the equilibrium.
Now suppose that the price is below its equilibrium level at $1.20 per litre, as the dashed horizontal line at this price in Figure 2.33 shows. At this lower price, the quantity demanded increases from 600 to 700 as drivers take longer trips, spend more minutes warming up the car in the driveway in wintertime, stop sharing rides to work, and buy larger cars that get fewer miles to the litre. However, the below-equilibrium price reduces gasoline producers’ incentives to produce and sell gasoline, and the quantity supplied falls from 600 to 550.
When the price is below equilibrium, there is excess demand or a shortage—that is, at the given price the quantity demanded, which has been stimulated by the lower price, now exceeds the quantity supplied, which had been depressed by the lower price. In this situation, eager gasoline buyers mob the gas stations, only to find many stations running short of fuel. Oil companies and gas stations recognize that they have an opportunity to make higher profits by selling what gasoline they have at a higher price. As a result, the price rises toward the equilibrium level.
Shifts in Demand and Supply for Goods and Services
The previous section explored how price affects the quantity demanded and the quantity supplied. The result was the demand curve and the supply curve. Price, however, is not the only thing that influences demand. Nor is it the only thing that influences supply. For example, how is the demand for vegetarian food affected if, say, health concerns cause more consumers to avoid eating meat? Or how is the supply of diamonds affected if diamond producers discover several new diamond mines? What are the major factors, in addition to the price, that influence demand or supply?
What Factors Affect Demand?
We defined demand as the amount of some product a consumer is willing and able to purchase at each price. That suggests at least two factors in addition to the price that affects demand. Willingness to purchase suggests a desire, based on what economists call tastes and preferences. If you neither need nor want something, you will not buy it. The ability to purchase suggests that income is important. Professors are usually able to afford better housing and transportation than students because they have more income. Prices of related goods can affect demand also. If you need a new car, the price of a Honda may affect your demand for a Ford. Finally, the size or composition of the population can affect demand. The more children a family has, the greater their demand for clothing. The more driving-age children a family has, the greater their demand for car insurance, and the less for diapers and baby formula.
How Does Income Affect Demand?
Let’s use income as an example of how factors other than price affect demand. Figure 2.41 shows the initial demand for automobiles as D0. At point Q, for example, if the price is $20,000 per car, the quantity of cars demanded is 18 million. D0 also shows how the number of cars demanded would change as a result of a higher or lower price. For example, if the price of a car rose to $22,000, the quantity demanded would decrease to 17 million, at point R.
The original demand curve D0, like every demand curve, is based on the ceteris paribus assumption that no other economically relevant factors change. Now imagine that the economy expands in a way that raises the incomes of many people, making cars more affordable. How will this affect demand? How can we show this graphically?
Go to Figure 2.41. The price of cars is still $20,000, but with higher incomes, the quantity demanded has now increased to 20 million cars, shown at point S. As a result of the higher income levels, the demand curve shifts to the right to the new demand curve D1, indicating an increase in demand. Table 2.41 shows clearly that this increased demand would occur at every price, not just the original one.
Increased demand means that at every given price, the quantity demanded is higher, so that the demand curve shifts to the right from D0 to D 1. Decreased demand means that at every given price, the quantity demanded is lower so that the demand curve shifts to the left from D0 to D2 (Demand shifts, 2020).
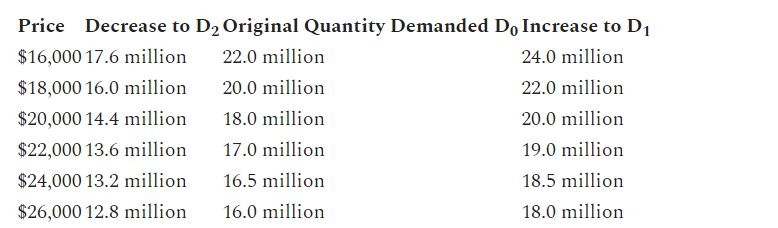
Now, imagine that the economy slows down so that many people lose their jobs or work fewer hours, reducing their incomes. In this case, the decrease in income would lead to a lower quantity of cars demanded at every given price, and the original demand curve D0 would shift left to D2. The shift from D0 to D2 represents such a decrease in demand: At any given price level, the quantity demanded is now lower. In this example, a price of $20,000 means 18 million cars sold along the original demand curve, but only 14.4 million sold after demand fell.
When a demand curve shifts, it does not mean that the quantity demanded by every individual buyer changes by the same amount. In this example, not everyone would have a higher or lower income and not everyone would buy or not buy an additional car. Instead, a shift in a demand curve captures a pattern for the market as a whole.
In the previous section, we argued that higher income causes greater demand at every price. This is true for most goods and services. For some—luxury cars, vacations in Europe, and fine jewelry—the effect of a rise in income can be especially pronounced. A product whose demand rises when income rises, and vice versa, is called a normal good. A few exceptions to this pattern do exist. As incomes rise, many people will buy fewer generic brand groceries and more name brand groceries. They are less likely to buy used cars and more likely to buy new cars. They will be less likely to rent an apartment and more likely to own a home, and so on. A product whose demand falls when income rises, and vice versa, is called an inferior good. In other words, when income increases, the demand curve shifts to the left.
Other Factors That Shift Demand Curves
Income is not the only factor that causes a shift in demand. Other things that change demand include tastes and preferences, the composition or size of the population, the prices of related goods, and even expectations. A change in any one of the underlying factors that determine what quantity people are willing to buy at a given price will cause a shift in demand. Graphically, the new demand curve lies either to the right (an increase) or to the left (a decrease) of the original demand curve. Let’s look at these factors.
Changing Tastes or Preferences
From 1980 to 2019, the amount of chicken available per Canadians rose from 17 pounds per year to 35 pounds per year, and the consumption of beef fell from 39 pounds per year to 24 pounds per year, according to the Government of Canada (Government of Canada, 2020). Changes like these are largely due to movements in taste, which change the quantity of a good demanded at every price: that is, they shift the demand curve for that good, rightward for chicken and leftward for beef.
Changes in the Composition of the Population
The proportion of elderly citizens in the Canadian population is rising. It rose by 20% from 2011 to 2016 This increase has made it so that the number of elderly has surpassed the number of children (Grenier, 2017). A society with relatively more children, like Canada in the 2000s, will have a greater demand for goods and services like tricycles and daycare facilities. A society with relatively more elderly persons, as Canada is headed towards, has a higher demand for nursing homes and hearing aids. Similarly, changes in the size of the population can affect the demand for housing and many other goods. Each of these changes in demand will be shown as a shift in the demand curve.
The demand for a product can also be affected by changes in the prices of related goods such as substitutes or complements. A substitute is a good or service that can be used in place of another good or service. As electronic books, like this one, become more available, you would expect to see a decrease in demand for traditional printed books. A lower price for a substitute decreases demand for the other product. For example, in recent years as the price of tablet computers has fallen, the quantity demanded has increased (because of the law of demand). Since people are purchasing tablets, there has been a decrease in demand for laptops, which can be shown graphically as a leftward shift in the demand curve for laptops. A higher price for a substitute good has the reverse effect.
Other goods are complements for each other, meaning that the goods are often used together because the consumption of one good tends to enhance the consumption of the other. Examples include breakfast cereal and milk; notebooks and pens or pencils, golf balls and golf clubs; gasoline and sport utility vehicles; and the five-way combination of bacon, lettuce, tomato, mayonnaise, and bread. If the price of golf clubs rises, since the quantity demanded of golf clubs falls (because of the law of demand), demand for a complement good like golf balls decreases, too. Similarly, a higher price for skis would shift the demand curve for a complement good like ski resort trips to the left, while a lower price for a complement has the reverse effect.
Changes in Expectations about Future Prices or Other Factors that Affect Demand
While it is clear that the price of a good affects the quantity demanded, it is also true that expectations about the future price (or expectations about tastes and preferences, income, and so on) can affect demand. For example, if people hear that a hurricane is coming, they may rush to the store to buy flashlight batteries and bottled water. If people learn that the price of a good like coffee is likely to rise in the future, they may head for the store to stock up on coffee now. These changes in demand are shown as shifts in the curve. Therefore, a shift in demand happens when a change in some economic factor (other than price) causes a different quantity to be demanded at every price.
Key Takeaways
Summing Up Factors That Change Demand
Six factors that can shift demand curves are summarized in Figure 2.42. The direction of the arrows indicates whether the demand curve shifts represent an increase in demand or a decrease in demand. Notice that a change in the price of the good or service itself is not listed among the factors that can shift a demand curve. A change in the price of a good or service causes a movement along a specific demand curve, and it typically leads to some change in the quantity demanded, but it does not shift the demand curve.
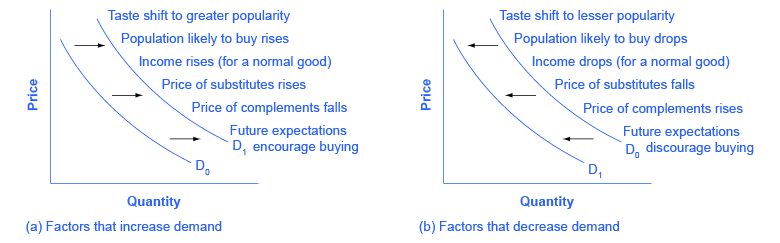
Graph A shows a list of factors that can cause an increase in demand from D0 to D1 while graph B has the same factors but if their direction was reversed, can cause a decrease in demand from D0 to D1.
When a demand curve shifts, it will then intersect with a given supply curve at a different equilibrium price and quantity. We are, however, getting ahead of our story. Before discussing how changes in demand can affect equilibrium price and quantity, we first need to discuss shifts in supply curves.
How Production Costs Affect Supply
A supply curve shows how quantity supplied will change as the price rises and falls, assuming ceteris paribus so that no other economically relevant factors are changing. If other factors relevant to supply do change, then the entire supply curve will shift. Just as a shift in demand is represented by a change in the quantity demanded at every price, a shift in supply means a change in the quantity supplied at every price.
In thinking about the factors that affect supply, remember what motivates firms: profits, which are the difference between revenues and costs. Goods and services are produced using combinations of labour, materials, and machinery, or what we call inputs or factors of production. If a firm faces lower costs of production, while the prices for the goods or services the firm produces remain unchanged, a firm’s profits go up. When a firm’s profits increase, it is more motivated to produce output, since the more it produces the more profit it will earn. So, when costs of production fall, a firm will tend to supply a larger quantity at any given price for its output. This can be shown by the supply curve shifting to the right.
Take, for example, a messenger company that delivers packages around a city. The company may find that buying gasoline is one of its main costs. If the price of gasoline falls, then the company will find it can deliver messages more cheaply than before. Since lower costs correspond to higher profits, the messenger company may now supply more of its services at any given price. For example, given the lower gasoline prices, the company can now serve a greater area and increase its supply.
Conversely, if a firm faces higher costs of production, then it will earn lower profits at any given selling price for its products. As a result, a higher cost of production typically causes a firm to supply a smaller quantity at any given price. In this case, the supply curve shifts to the left.
Consider the supply for cars, shown by curve S0 in Figure 2.43. Point J indicates that if the price is $20,000, the quantity supplied will be 18 million cars. If the price rises to $22,000 per car, ceteris paribus, the quantity supplied will rise to 20 million cars, as point K on the S0 curve shows. The same information can be shown in table form, as in Table 2.42.
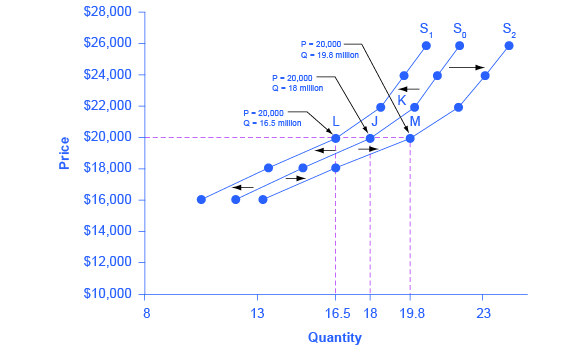
Decreased supply means that at every given price, the quantity supplied is lower, so that the supply curve shifts to the left, from S0 to S1. Increased supply means that at every given price, the quantity supplied is higher, so that the supply curve shifts to the right, from S0 to S2.
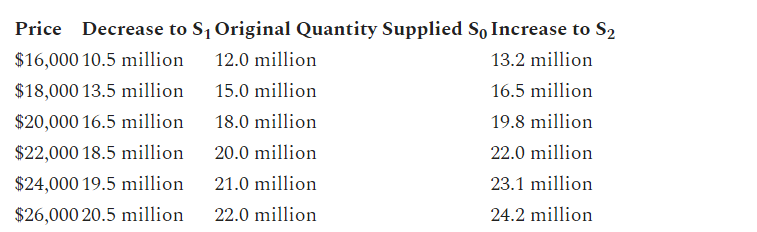
Now, imagine that the price of steel, an important ingredient in manufacturing cars, rises, so that producing a car has become more expensive. At any given price for selling cars, car manufacturers will react by supplying a lower quantity. This can be shown graphically as a leftward shift of supply, from S0 to S1, which indicates that at any given price, the quantity supplied decreases. In this example, at a price of $20,000, the quantity supplied decreases from 18 million on the original supply curve (S0) to 16.5 million on the supply curve S1, which is labelled as point L. Conversely, if the price of steel decreases, producing a car becomes less expensive. At any given price for selling cars, car manufacturers can now expect to earn higher profits, so they will supply a higher quantity. The shift of supply to the right, from S0 to S2, means that at all prices, the quantity supplied has increased. In this example, at a price of $20,000, the quantity supplied increases from 18 million on the original supply curve (S0) to 19.8 million on the supply curve S2, which is labelled M.
Other Factors That Affect Supply
In the example above, we saw that changes in the prices of inputs in the production process will affect the cost of production and thus the supply. Several other things affect the cost of production, too, such as changes in weather or other natural conditions, new technologies for production, and some government policies.
The cost of production for many agricultural products will be affected by changes in natural conditions. For example, in 2014 the Manchurian Plain in Northeastern China, which produces most of the country’s wheat, corn, and soybeans, experienced its most severe drought in 50 years. A drought decreases the supply of agricultural products, which means that at any given price, a lower quantity will be supplied; conversely, especially good weather would shift the supply curve to the right.
When a firm discovers a new technology that allows the firm to produce at a lower cost, the supply curve will shift to the right, as well. For instance, in the 1960s a major scientific effort nicknamed the Green Revolution focused on breeding improved seeds for basic crops like wheat and rice. By the early 1990s, more than two-thirds of the wheat and rice in low-income countries around the world was grown with these Green Revolution seeds—and the harvest was twice as high per acre. A technological improvement that reduces costs of production will shift supply to the right so that a greater quantity will be produced at any given price.
Government policies can affect the cost of production and the supply curve through taxes, regulations, and subsidies. For example, the Canadian government has an additional tax on alcoholic beverages such as beer and wine, for those who manufacture the drinks (Beer and Wine Tax, 2020). Taxes are treated as costs by businesses. Higher costs decrease supply for the reasons discussed above. Other examples of policy that can affect cost are the wide array of government regulations that require firms to spend money to provide a cleaner environment or a safer workplace; complying with regulations increases costs.
A government subsidy, on the other hand, is the opposite of a tax. A subsidy occurs when the government pays a firm directly or reduces the firm’s taxes if the firm carries out certain actions. From the firm’s perspective, taxes or regulations are an additional cost of production that shifts supply to the left, leading the firm to produce a lower quantity at every given price. Government subsidies reduce the cost of production and increase supply at every given price, shifting supply to the right.
Key Takeaways
Summing Up Factors That Change Supply
Changes in the cost of inputs, natural disasters, new technologies, and the impact of government decisions all affect the cost of production. In turn, these factors affect how much firms are willing to supply at any given price.
Figure 2.44 summarizes factors that change the supply of goods and services. Notice that a change in the price of the product itself is not among the factors that shift the supply curve. Although a change in the price of a good or service typically causes a change in quantity supplied or a movement along the supply curve for that specific good or service, it does not cause the supply curve itself to shift.
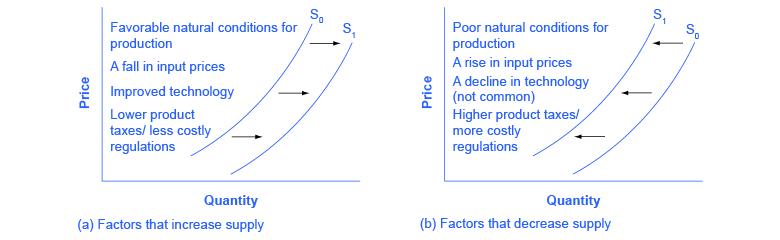
Graph A shows a list of factors that can cause an increase in supply from S0 to S1 while graph B has the same factors but if their direction was reversed, can cause a decrease in supply from S0 to S1.
Because demand and supply curves appear on a two-dimensional diagram with only price and quantity on the axes, an unwary visitor to the land of economics might be fooled into believing that economics is about only four topics: demand, supply, price, and quantity. However, demand and supply are really “umbrella” concepts: demand covers all the factors that affect demand, and supply covers all the factors that affect supply. Factors other than price that affect demand and supply are included by using shifts in the demand or the supply curve. In this way, the two-dimensional demand and supply model becomes a powerful tool for analyzing a wide range of economic circumstances.
Information Technology in the Economy
Competitive Advantage
It is important when new technologies arrive onto the scene, it allows organizations to work more efficiently and create products at a faster rate making more supply while costing less. This overall increases the demand causing a movement to the right. However, how does technology affect business?
What does it mean when a company has a competitive advantage? What are the factors that play into it? Michael Porter in his book Competitive Advantage: Creating and Sustaining Superior Performance. writes that a company is said to have a competitive advantage over its rivals when it is able to sustain profits that exceed the average for the industry. According to Porter, there are two primary methods for obtaining competitive advantage: cost advantage and differentiation advantage (Porter,1985). So the question for I.T. becomes: How can information technology be a factor in one or both of these methods?
The following sections address this question by using two of Porter’s analysis tools: the value chain and the five forces model. Porter’s analysis in his 2001 article “Strategy and the Internet,” which examines the impact of the Internet on business strategy and competitive advantage, will be used to shed further light on the role of information technology in gaining competitive advantage (Porter, 2001, March).
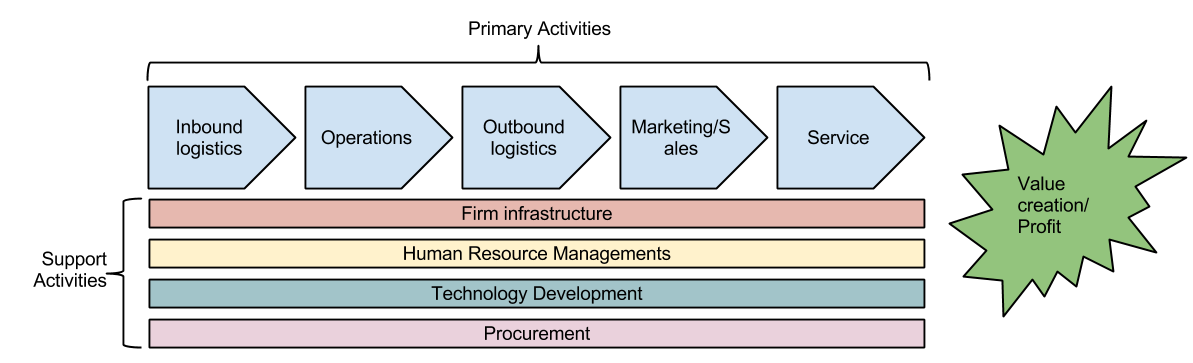
In his book, Competitive Advantage: Creating and Sustaining Performance Porter describes exactly how a company can create value and therefore profit. Value is built through the value chain: a series of activities undertaken by the company to produce a product or service. Each step in the value chain contributes to the overall value of a product or service. While the value chain may not be a perfect model for every type of company, it does provide a way to analyze just how a company is producing value. The value chain is made up of two sets of activities: primary activities and support activities. An explanation of these activities and a discussion of how information technology can play a role in creating value by contributing to cost advantage or differentiation advantage appears next.
Primary activities are the functions that directly impact the creation of a product or service. The goal of a primary activity is to add value that is greater than the cost of that activity. The primary activities are:
- Inbound logistics. These are the processes that bring in raw materials and other needed inputs. Information technology can be used to make these processes more efficient, such as with supply-chain management systems that allow the suppliers to manage their own inventory.
- Operations. Any part of a business that converts the raw materials into a final product or service is a part of operations. From manufacturing to business process management (covered in Chapter 8), information technology can be used to provide more efficient processes and increase innovation through flows of information.
- Outbound logistics. These are the functions required to get the product out to the customer. As with inbound logistics, IT can be used here to improve processes, such as allowing for real-time inventory checks. IT can also be a delivery mechanism.
- Sales/Marketing. The functions that will entice buyers to purchase the products are part of sales and marketing. Information technology is used in almost all aspects of this activity. From online advertising to online surveys, IT can be used to innovate product design and reach customers as never before. The company website can be a sales channel itself.
- Service. Service activity involves the functions a business performs after the product has been purchased to maintain and enhance the product’s value. Service can be enhanced via technology as well, including support services through websites and knowledge bases.
The support activities are the functions of an organization that support all of the primary activities. Support activities can be considered indirect costs to the organization. The support activities are:
- Firm infrastructure. An organization’s infrastructure includes finance, accounting, ERP systems (covered in Chapter 9) and quality control. All of these depend on information technology and represent functions where I.T. can have a positive impact.
- Human Resource Management Human Resource Management (HRM) consists of recruiting, hiring, and other services needed to attract and retain employees. Using the Internet, HR departments can increase their reach when looking for candidates. I.T. also allows employees to use technology for a more flexible work environment.
- Technology development. Technology development provides innovation that supports primary activities. These advances are integrated across the firm to add value in a variety of departments. Information technology is the primary generator of value in this support activity.
- Procurement. Procurement focuses on the acquisition of raw materials used in the creation of products. Business-to-business e-commerce can be used to improve the acquisition of materials.
This analysis of the value chain provides some insight into how information technology can lead to a competitive advantage. Another important concept from Porter is the “Five Forces Model.”
Using Information Systems for Competitive Advantage
A strategic information system is designed specifically to implement an organizational strategy meant to provide a competitive advantage. These types of information systems began popping up in the 1980s, as noted in a paper by Charles Wiseman entitled “Creating Competitive Weapons From Information Systems (Wiseman & MacMillan, 1984)
A strategic information system attempts to do one or more of the following:
- Deliver a product or a service at a lower cost;
- Deliver a product or service that is differentiated;
- Help an organization focus on a specific market segment;
- Enable innovation.
Here are some examples of information systems that fall into this category.
Collaborative Systems
As organizations began to implement networking technologies, information systems emerged that allowed employees to begin collaborating in different ways. These systems allowed users to brainstorm ideas together without the necessity of physical, face-to-face meetings. Tools such as video conferencing with Skype or WebEx, collaboration and document sharing with Microsoft SharePoint, and project management with SAP’s Project System makes collaboration possible in a variety of endeavours.
Broadly speaking, any software that allows multiple users to interact on a document or topic could be considered collaborative. Electronic mail, a shared Word document, and social networks fall into this broad definition. However, many software tools have been created that are designed specifically for collaborative purposes. These tools offer a broad spectrum of collaborative functions. Here is just a shortlist of some collaborative tools available for businesses today:
- Google Drive. Google Drive offers a suite of office applications (such as a word processor, spreadsheet, drawing, presentation) that can be shared between individuals. Multiple users can edit the documents at the same time and the threaded comments option is available.
- Microsoft SharePoint. SharePoint integrates with Microsoft Office and allows for collaboration using tools most office workers are familiar with. SharePoint was covered in greater detail in chapter 5.
- Cisco WebEx. WebEx combines video and audio communications and allows participants to interact with each other’s computer desktops. WebEx also provides a shared whiteboard and the capability for a text-based chat to be going on during the sessions, along with many other features. Mobile editions of WebEx allow for full participation using smartphones and tablets.
- GitHub. Programmers/developers use GitHub for web-based team development of computer software.
Decision Support Systems
A decision support system (DSS) helps an organization make a specific decision or set of decisions. DSSs can exist at different levels of decision-making within the organization, from the CEO to first-level managers. These systems are designed to take inputs regarding a known (or partially-known) decision-making process and provide the information necessary to make a decision. DSSs generally assist a management level person in the decision-making process, though some can be designed to automate decision-making. Of course, this can be used by economists as well to help them see the problem with a clear picture.
An organization has a wide variety of decisions to make, ranging from highly structured decisions to unstructured decisions. A structured decision is usually one that is made quite often and one in which the decision is based directly on the inputs. With structured decisions, once you know the necessary information you also know the decision that needs to be made. For example, inventory reorders levels can be structured decisions. Once your inventory of widgets gets below a specific threshold, automatically reorder ten more. Structured decisions are good candidates for automation, but decision-support systems are generally not built for them.
An unstructured decision involves a lot of unknowns. Many times unstructured decisions are made for the first time. An information system can support these types of decisions by providing decision-makers with information-gathering tools and collaborative capabilities. An example of an unstructured decision might be dealing with a labour issue or setting policy for the implementation of new technology.
Decision support systems work best when the decision-makers are having to make semi-structured decisions. A semi-structured decision is one in which most of the factors needed for making the decision are known but human experience and other outside factors may still impact the decision. A good example of a semi-structured decision would be diagnosing a medical condition.
As with collaborative systems, DSSs can come in many different formats. A nicely designed spreadsheet that allows for input of specific variables and then calculates required outputs could be considered a DSS. Another DSS might be one that assists in determining which products a company should develop. Input into the system could include market research on the product, competitor information, and product development costs. The system would then analyze these inputs based on the specific rules and concepts programmed into it. The system would report its results with recommendations and/or key indicators to be used in making a decision. A DSS can be looked at as a tool for competitive advantage because it can give an organization a mechanism to make wise decisions about products and innovations.
Exercises
- What is scarcity? Can you think of two causes of scarcity?
- A consultant works for $200 per hour. She likes to eat vegetables but is not very good at growing them. Why does it make more economic sense for her to spend her time at the consulting job and shop for her vegetables?
- A computer systems engineer could paint his house, but it makes more sense for him to hire a painter to do it. Explain why.
- What is an example of a problem in the world today, not mentioned in the chapter, that has an economic dimension?
- Give the three reasons that explain why the division of labour increases an economy’s level of production.
- What are three reasons to study economics?
- What is the difference between microeconomics and macroeconomics?
- What are the three main goals of macroeconomics?
- How did John Maynard Keynes define economics?
- Suppose you have a team of two workers: one is a baker and one is a chef. Explain why the kitchen can produce more meals in a given period of time if each worker specializes in what they do best than if each worker tries to do everything from appetizer to dessert.
- Can you think of any examples of free goods, that is, goods or services that are not scarce?
- A balanced federal budget and a balance of trade are considered secondary goals of macroeconomics, while growth in the standard of living (for example) is considered a primary goal. Why do you think that is so?
- Macroeconomics is an aggregate of what happens at the microeconomic level. Would it be possible for what happens at the macro level to differ from how economic agents would react to some stimulus at the micro level? Hint: Think about the behavior of crowds.
- Why is it unfair or meaningless to criticize a theory as “unrealistic?”
- What determines the level of prices in a market?
- What does a downward-sloping demand curve mean about how buyers in a market will react to a higher price?
- Will demand curves have the same exact shape in all markets? If not, how will they differ?
- Will supply curves have the same shape in all markets? If not, how will they differ?
- What is the relationship between quantity demanded and quantity supplied at equilibrium? What is the relationship when there is a shortage? What is the relationship when there is a surplus?
- How can you locate the equilibrium point on a demand and supply graph?
- If the price is above the equilibrium level, would you predict a surplus or a shortage? If the price is below the equilibrium level, would you predict a surplus or a shortage? Why?
- When the price is above the equilibrium, explain how market forces move the market price to equilibrium. Do the same when the price is below the equilibrium.
- What is the difference between the demand and the quantity demanded of a product, say milk? Explain in words and show the difference on a graph with a demand curve for milk.
- What is the difference between the supply and the quantity supplied of a product, say milk? Explain in words and show the difference on a graph with the supply curve for milk.
- Name some factors that can cause a shift in the demand curve in markets for goods and services.
- Name some factors that can cause a shift in the supply curve in markets for goods and services.
- What is total surplus? How is it illustrated on a demand and supply diagram?
- Consider the demand for hamburgers. If the price of a substitute good (for example, hot dogs) increases and the price of a complement good (for example, hamburger buns) increases, can you tell for sure what will happen to the demand for hamburgers? Why or why not? Illustrate your answer with a graph.
- We know that a change in the price of a product causes a movement along the demand curve. Suppose consumers believe that prices will be rising in the future. How will that affect demand for the product in the present? Can you show this graphically?
Citations
Porter, M. (1985). Competitive Advantage: Creating and Sustaining Superior Performance. New York: The Free Press. ↵
Porter, M. (2001, March). Strategy and the Internet. Harvard Business Review, 79 ,3. Retrieved from http://hbswk.hbs.edu/item/2165.html ↵
Wiseman, C. and MacMillan, I. C. (1984). Creating Competitive Weapons From Information Systems. Journal Of Business Strategy, 5(2)., 42.↵
Bureau of Labor Statistics, U.S. Department of Labor. 2015. “The Employment Situation—February 2015.” Accessed March 27, 2015. http://www.bls.gov/news.release/pdf/empsit.pdf.
Williamson, Lisa. “US Labor Market in 2012.” Bureau of Labor Statistics. Accessed December 1, 2013. http://www.bls.gov/opub/mlr/2013/03/art1full.pdf.
O’rourke, P. (2007, January 07). ‘On “The Wealth of Nations”‘. Retrieved June 23, 2020, from https://www.nytimes.com/2007/01/07/books/chapters/0107-1st-orou.html
Smith, A., & Cannan, E. (2003). The wealth of nations. New York, N.Y: Bantam Classic.
Chappelow, J. (2020, March 27). Law of Demand Definition. Retrieved June 24, 2020, from https://www.investopedia.com/terms/l/lawofdemand.asp
Government of Canada / Gouvernement du Canada. (2020, May 29). Retrieved June 25, 2020, from https://www.agr.gc.ca/eng/animal-industry/poultry-and-eggs/poultry-and-egg-market-information/industry-indicators/per-capita-disappearance/?id=1384971854413
Grenier, E. (2017, May 07). Seniors now outnumber children in Canada, census figures show | CBC News. Retrieved June 25, 2020, from https://www.cbc.ca/news/politics/2016-census-age-gender-1.4095360
Demand shifts. (2020, January 25). Retrieved June 25, 2020, from https://www.economicsonline.co.uk/Competitive_markets/Demand_shifts.html
Beer and Wine Tax. (2020, June 23). Retrieved June 25, 2020, from https://www.fin.gov.on.ca/en/tax/bwt/index.html
R, H. (2019, August 26). Why Employee Motivation Is Important (& How to Improve It). Retrieved July 06, 2020, from https://inside.6q.io/employee-motivation-important/
Attributions
Principles of Economics by Rice University is licensed under CC BY 4.0, except where otherwise noted.
Information Systems for Business and Beyond by David T. Bourgeois is licensed under CC BY 4.0
the study of how humans make choices under conditions of scarcity
when wants for goods and services exceed the available supply
the way in which the work required to produce a good or service is divided into tasks performed by different workers
when workers or firms focus on particular tasks for which they are well-suited within the overall production process
when the average cost of producing each individual unit declines as total output increases exports products (goods and services) made domestically and sold abroad fiscal policy economic policies that involve government spending and taxes
the branch of economics that focuses on actions of particular agents within the economy, like households, workers, and business firms
the branch of economics that focuses on broad issues such as growth, unemployment, inflation, and trade balance
policy that involves altering the level of interest rates, the availability of credit in the economy, and the extent of borrowing
the total number of units of a good or service consumers are willing to purchase at a given price
the common relationship that a higher price leads to a lower quantity demanded of a certain good or service and a lower price leads to a higher quantity demanded, while all other variables are held constant
a table that shows a range of prices for a certain good or service and the quantity demanded at each price
a graphic representation of the relationship between price and quantity demanded of a certain good or service, with quantity on the horizontal axis and the price on the vertical axis
the total number of units of a good or service producers are willing to sell at a given price
the common relationship that a higher price leads to a greater quantity supplied and a lower price leads to a lower quantity supplied, while all other variables are held constant
a table that shows a range of prices for a good or service and the quantity supplied at each price surplus at the existing price, quantity supplied exceeds the quantity demanded; also called excess supply total surplus see social surplus
a line that shows the relationship between price and quantity supplied on a graph, with quantity supplied on the horizontal axis and price on the vertical axis
the quantity at which quantity demanded and quantity supplied are equal for a certain price level excess demand at the existing price, the quantity demanded exceeds the quantity supplied; also called a shortage excess supply at the existing price, quantity supplied exceeds the quantity demanded; also called a surplus
when a change in some economic factor (other than price) causes a different quantity to be supplied at every price
the combination of labour, materials, and machinery that is used to produce goods and services; also called factors of production
