34 Marketing Your Venture: Engagement and Analytics
Jessica Pucci
Far too often, entrepreneurs focus squarely on conversion and forget about the rest of the funnel.[1] It can sound tempting to measure the success of your business solely by tickets sold, apps downloaded or T-shirts shipped. But evaluating a venture that way neglects the value and impact of your audience—the audience you have now, and the audiences you want but don’t have yet. Is your company really successful if it sells 750 hats at a music festival? To really say one way or the other, you’d need to know what your audience opportunity was first: Did 1,000 people attend the festival (if so, you sold hats to 75% of them, and that’s excellent!), or did 50,000 people attend (if so, you sold hats to only 1.5% of them, and that’s not so excellent, assuming everyone at the festival had a head)? And what about the 200 festival-goers who came to browse your hat booth but didn’t buy anything… yet? What about the 450 attendees who saw your hats around the festival and started following your brand on Instagram? Shouldn’t we include them when we tally up our successes? Don’t they count for something?
Your job as an entrepreneur is not just to make a single sale: It’s to build relationships with audiences who will grow your company. Focusing on a one-time sale will get you just that: one sale. But focusing on audience development—strategic growth and engagement of likely, long-term customers—creates a sustainable business.
Growth and engagement go hand-in-hand. Tomatoes don’t just grow: They need a particular patch of dirt with at least six hours of sun; they need a trellis; they need regular water, pruning and support—and that’s just tomatoes. Other veggies need different care. The point is, you don’t toss down some seeds and expect a harvest. Growth takes research, planning, hands-on care, and recognition that no two crops need the same thing. Gardening isn’t so far from digital audience growth. Just like produce, digital audiences are all different, and all require different forms of nurturing and nourishment to thrive. The way we feed and care for our digital audiences is engagement.
Engagement
Broadly, entrepreneurs and marketers use the term “engagement” to capture the many ways people and organizations identify, listen to, interact with, and activate digital audiences. When a company states it wants to “ramp up engagement,” it usually wants to increase discussion and activity around its brand, content or product. When a company hires an “engagement manager,” it usually intends for that person to manage the connections to and conversations with its audiences, on digital platforms or otherwise.
More specifically, however, engagement is defined as any action taken on digital content. A tweet, for example, is a piece of digital content; engagements with tweets include likes, retweets, and replies. A page on a website is a piece of digital content; engagements on web pages include scrolls, clicks, taps, video views, cursor or mouse movements, and form submissions.
Music is digital content, too; engagements include downloads and listens. All of these engagements are tangible and quantifiable. When we speak of “engagement” in the general sense, we can include face-to-face community outreach, magazine ads, and garage-sale posters. When we talk about “engagement” in the digital sense, we’re referring only to measurable content interactions.
Most organizations recognize that digital engagement is a critical marketing channel, though not all companies engage well. To work effectively—that is, to not only increase conversions, but to build a thriving customer pipeline—engagement has to occur at every stage of the funnel, and every stage requires strategy. Businesses should engage with users who are new to their brand differently than they engage with customers who have been brand-loyal for years. Companies selling baby products should engage with customers differently than a political organization engages. Here are four examples of companies with vastly different identities using digital engagement to achieve organizational success:
Engagement Example 1: Brand Discovery
https://www.instagram.com/p/BWam9YmDzTI/?taken-by=minimalistbaker
Your audience can’t engage with you until they know you exist, and brand discovery is one of the things Instagram does best. Here, the gluten-free food blogger Minimalist Baker, aka Dana Shultz, is showing off a vegan taco recipe. Shultz wants to sell cookbooks, of course, but she knows that to do that, she must first build awareness and authority within the food content market by forging and nurturing relationships with audiences who enjoy eating and looking at pretty pictures of food. Shultz has almost 1 million followers, but even a robust Instagram account isn’t likely to directly drive too many users to her blog, or to Amazon to buy her book. It is likely to reach Shultz’s target audiences: people who like to cook, particularly vegan and gluten-free folks. Users will discover the Minimalist Baker account if someone they follow mentions @minimalistbaker, but more likely, they’ll discover the brand by clicking a hashtag in another post—say, #tacos. If someone I follow shares a photo of family taco night and uses #tacos, I may tap that hashtag to see more tacos… and then I’d see @minimalistbaker’s droolworthy photo. As soon as I tap it, I’d find myself suddenly aware of the Minimalist Baker brand. From here, any action I take is an engagement. If I like, save, or comment on any Minimalist Baker post, that’s an engagement. If I share a Minimalist Baker post with my sister, that’s an engagement. If I tap another hashtag—say, #vegan—on any Minimalist Baker post, or if I click on the link in her profile, those are engagements, too, even though performing those actions take me away from Minimalist Baker. None of those engagement actions made Minimalist Baker any money. There were no conversions in this scenario. But what did happen is that I became aware of the Minimalist Baker brand, and perhaps I began to take some small actions with the brand’s content, which officially makes me part of the Minimalist Baker audience, at the top of the Minimalist Baker funnel.
Engagement Example 2: Content Consumption
This image is linked to, not embedded. It is not CC BY.
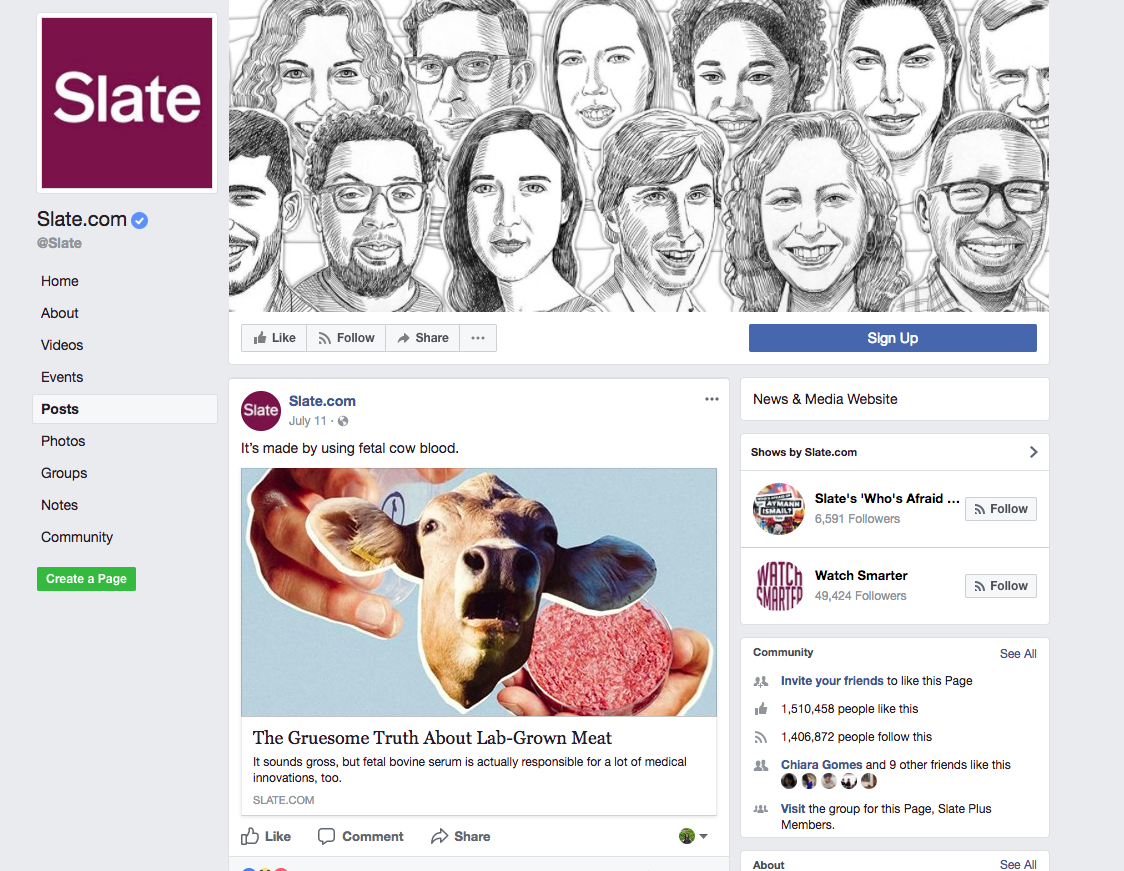
Here, online magazine Slate wants something a bit more than the typical social media engagement. Slate produced a story about lab-grown meat that the company would like its audience to read. But they can’t see the story in Facebook—they have to click. So Slate combined an eye-catchingly bizarre image with a text hat-trick of novel post, practical headline, and a story description that teases the story (but doesn’t tell all!) to persuade users who view this post to click the cow for more. Now, Slate would absolutely love for readers to like, comment about, and share this article within Facebook—those engagements are great, because they help put this story in front of more people—but it’s also very important to the organization to get users to take the specific “click” engagement action. Doing so brings the user away from Facebook and onto Slate.com, which brings that user further down Slate’s funnel toward conversion. (Conversion, for Slate, may be subscriptions to SlatePlus, its membership-only content experience.)
Engagement Example 3: Group Discussion
https://www.facebook.com/groups/yourmoneyandlife/
NPR hosts a personal finance podcast called Your Money and Your Life, but the star of the show might just be its corresponding Facebook group of the same name. Originally intended as a forum where listeners could ask questions and swap ideas (and NPR could promote the podcast), the group has taken on a life of its own and boasts more than 30,000 members. Within the group—which anyone can join—members join in rich discussions on money advice, credit scores and retirement planning. NPR still shares podcast episodes within the group, but some of the group’s loudest conversations have nothing to do with NPR[2]… which is fine by NPR, because all of the engagement happens within an NPR-created and -facilitated environment. Robust online communities—just like offline groups—are excellent spaces to create or join as an organization. They’re where you can listen, research, network—and build a captive audience for your content.
Engagement Example 4: Video Views and More

This video, a creative PSA on gun violence awareness with a shocking twist, has a clear objective: raise awareness of the warning signs of at-risk behavior. But you only get that message if you complete the entire video—and getting digital audiences to actually complete a video they begin is no small feat. You may notice that Sandy Hook Promise, the organization that created and posted this video, turned off comment functionality. So, truly, the only digital engagements a user can make with this video are to watch it, like or dislike it, or share it. Those are the only physical actions audiences can take. However, it’s Sandy Hook Promise’s hope that engagement around this video will go far beyond those three digital actions: After watching it, viewers can talk it about it at the dinner table, or initiate deeper discussions at school. And hopefully, because of this video, a viewer may be able to prevent a violent tragedy. Those are all engagements, too—and they may be more impactful than a like or a share.
Indeed, there are many types of engagement that are important, but not necessarily digital or measurable: A shoe company can count when a user likes a Facebook post, clicks an ad or actually buys a pair of sneakers, but the company cannot count when the shoes are worn. Wearing a brand is engaging with that brand!
In-person engagement is valuable, too: If you see a band play, you may choose to download their music, follow them on Twitter, or buy a ticket to their next show. You attending the concert wasn’t a digital event, but you and the band were absolutely engaging with each other as they rocked and you listened. Reading a vendor’s poster, seeing a choir sing, clipping a mailbox coupon, and reading a paper newsletter are all forms of engagement. However, some engagements are just easier to track—and thus, easier to grow strategically—than others.
Indeed, offline engagement is still alive and well. There’s an entire discipline of marketing dedicated to physical experiences; “experiential marketing” seeks to connect a brand to audiences directly via physical experiences such as flash mobs, taste tests, competitions, performances, art installations, and other events designed to evoke emotion and interaction. You may have seen the 2012 viral video “A Dramatic Surprise on a Quiet Square[3],” which captured an offline experiential marketing event. The cable channel TNT was launching in Belgium, and to encourage audiences to feel drama—in line with TNT’s tagline, “We know drama”—the channel placed a big, red button in the middle of a quiet town square and waited for a brave soul to push it. When the button’s finally pushed, drama ensues! The bystanders didn’t know it was a stunt at the time, and you can see their expressions of surprise; it was TNT’s hope that participants in the marketing event would forever connect their feelings to the brand, and that the campaign would grow its Belgian audience.
Even good, old-fashioned word-of-mouth is more important than ever: While academics have tuned focus to digital word-of-mouth (think Yelp reviews, comments and sharing), offline word of mouth can still grow and engage audiences. If I recommend my plumber to you in conversation, that’s engagement—and meaningful, high-quality engagement at that!
Engagement for engagement’s sake is fine if engagement alone is your goal. But if you have another goal—that is, if you need to get an audience to do or buy something—you have to use engagement as a stepping stone, one that builds and ushers potential and existing customers through your marketing funnel. It can be difficult to do all of that in a bubble: How do you know if you’re reaching your target customer? How do you know if all the time you spend on engagement is making your organization money? For those answers, we turn to analytics.
Analytics
Digital analytics are the data organizations use to measure the audience’s interactions with, quantify the impact of and inform the messages of our content and brand. Analytics is a collection of individual numbers called metrics that, when analyzed, tell the story of how far our brand or content reaches, how users engage with it, who those users are, where they are in the funnel, and when they take conversion actions. Nearly every digital activity can be recorded and counted, and analytics is the quantitative and qualitative analysis of that activity.
Analyzing your company’s digital performance is a critical step in understanding your overall business performance; understanding when, where and why users convert and how they interact with your brand adds necessary context to more traditional business data like revenue and supply-chain analysis. Analytics also help understand how our products and messages resonate with our audience, and suggest how to pivot our content to build stronger audience connections. But companies also use analytics to understand how digital audiences engage with their competitors—called “competitive analysis”—which helps businesses understand why, say, one furniture brand outsells another. Marketers also use analytics to identify audience opportunity. Before we ever start trying to feed audiences into our funnel, we can use analytics to determine what audiences we should target for our funnel in the first place.
![]() Assignment: Facebook Audience Insights
Assignment: Facebook Audience Insights
You can use Facebook Audience Insights–the same tool all companies use to target specific audiences in Facebook–to research audience opportunities.
STEP 1: To access Facebook Audience Insights, you’ll need to be an editor or an administrator of a public Facebook page (a page is different from your regular profile). Don’t have a page? Make one! Visit facebook.com/pages/create and follow the directions to create a page of your own.
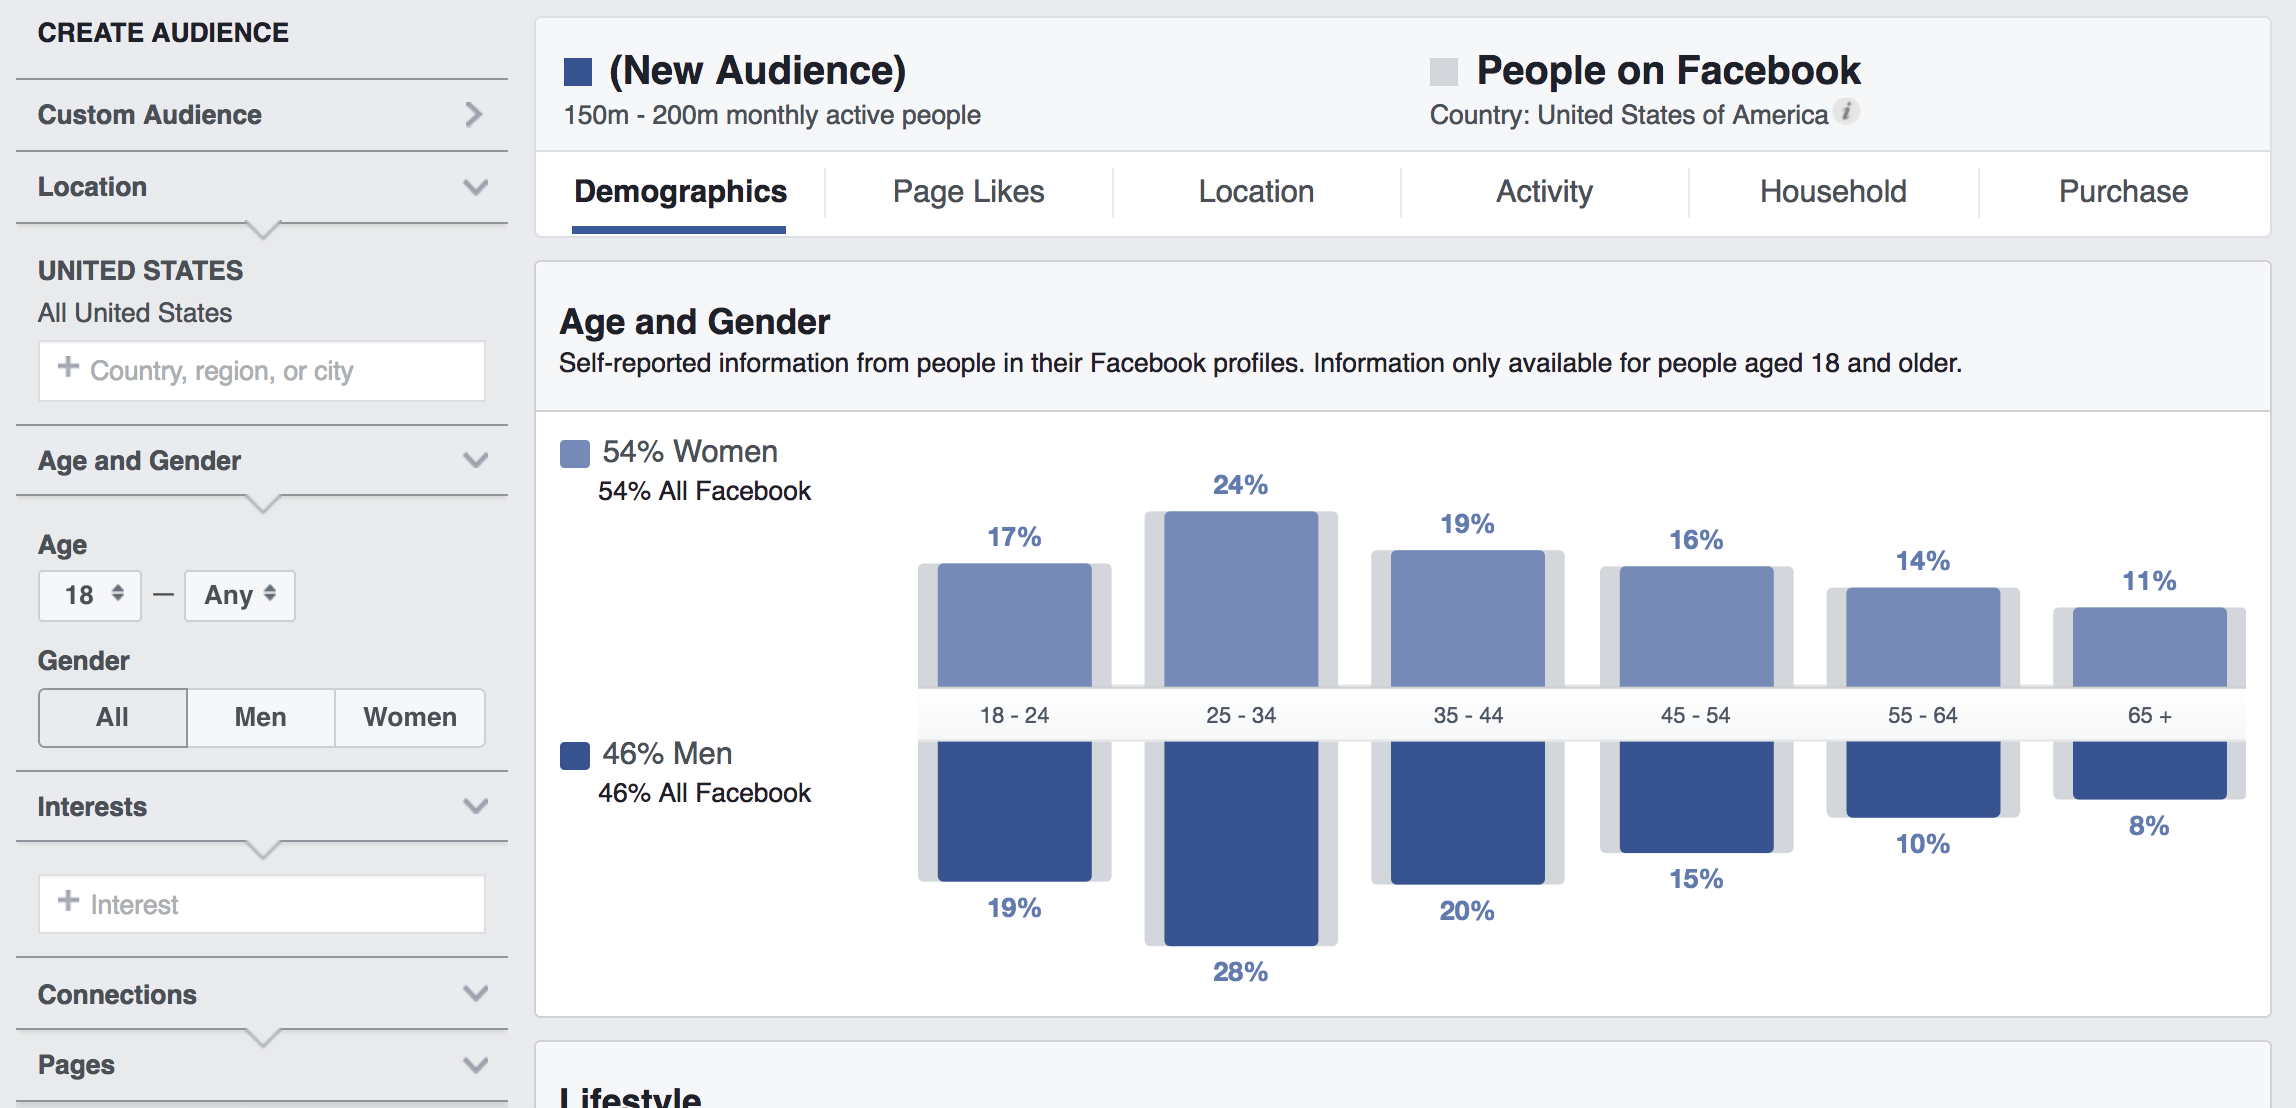
STEP 2: Visit Facebook.com/ads/audience-insights to access the Insights tool. Select “Everyone on Facebook” from the initial options; this ensures you can research Facebook audiences from scratch. Right away, you see data that represents all Facebook users; at the top, Facebook explains that the data you see represents all 150 to 200 million monthly active Facebook users in the United States.
STEP 3: Make your potential audience more specific by narrowing it down. Instead of looking at everyone in the country, select a state. Type a state into the “Location” box in the left-hand menu; here, we’ve selected Arizona. Immediately, we see that the data changes a bit: Now, the Insights tool tells us that the data we’re examining represents the 4 to 4.5 million monthly active Facebook users. You’ll also notice that the demographic data has shifted; the blue bars represent data for Arizona users, but the gray bars behind the blue ones represent the same United States Facebook users you started with, so you can compare your new audience to the “typical” Facebook user.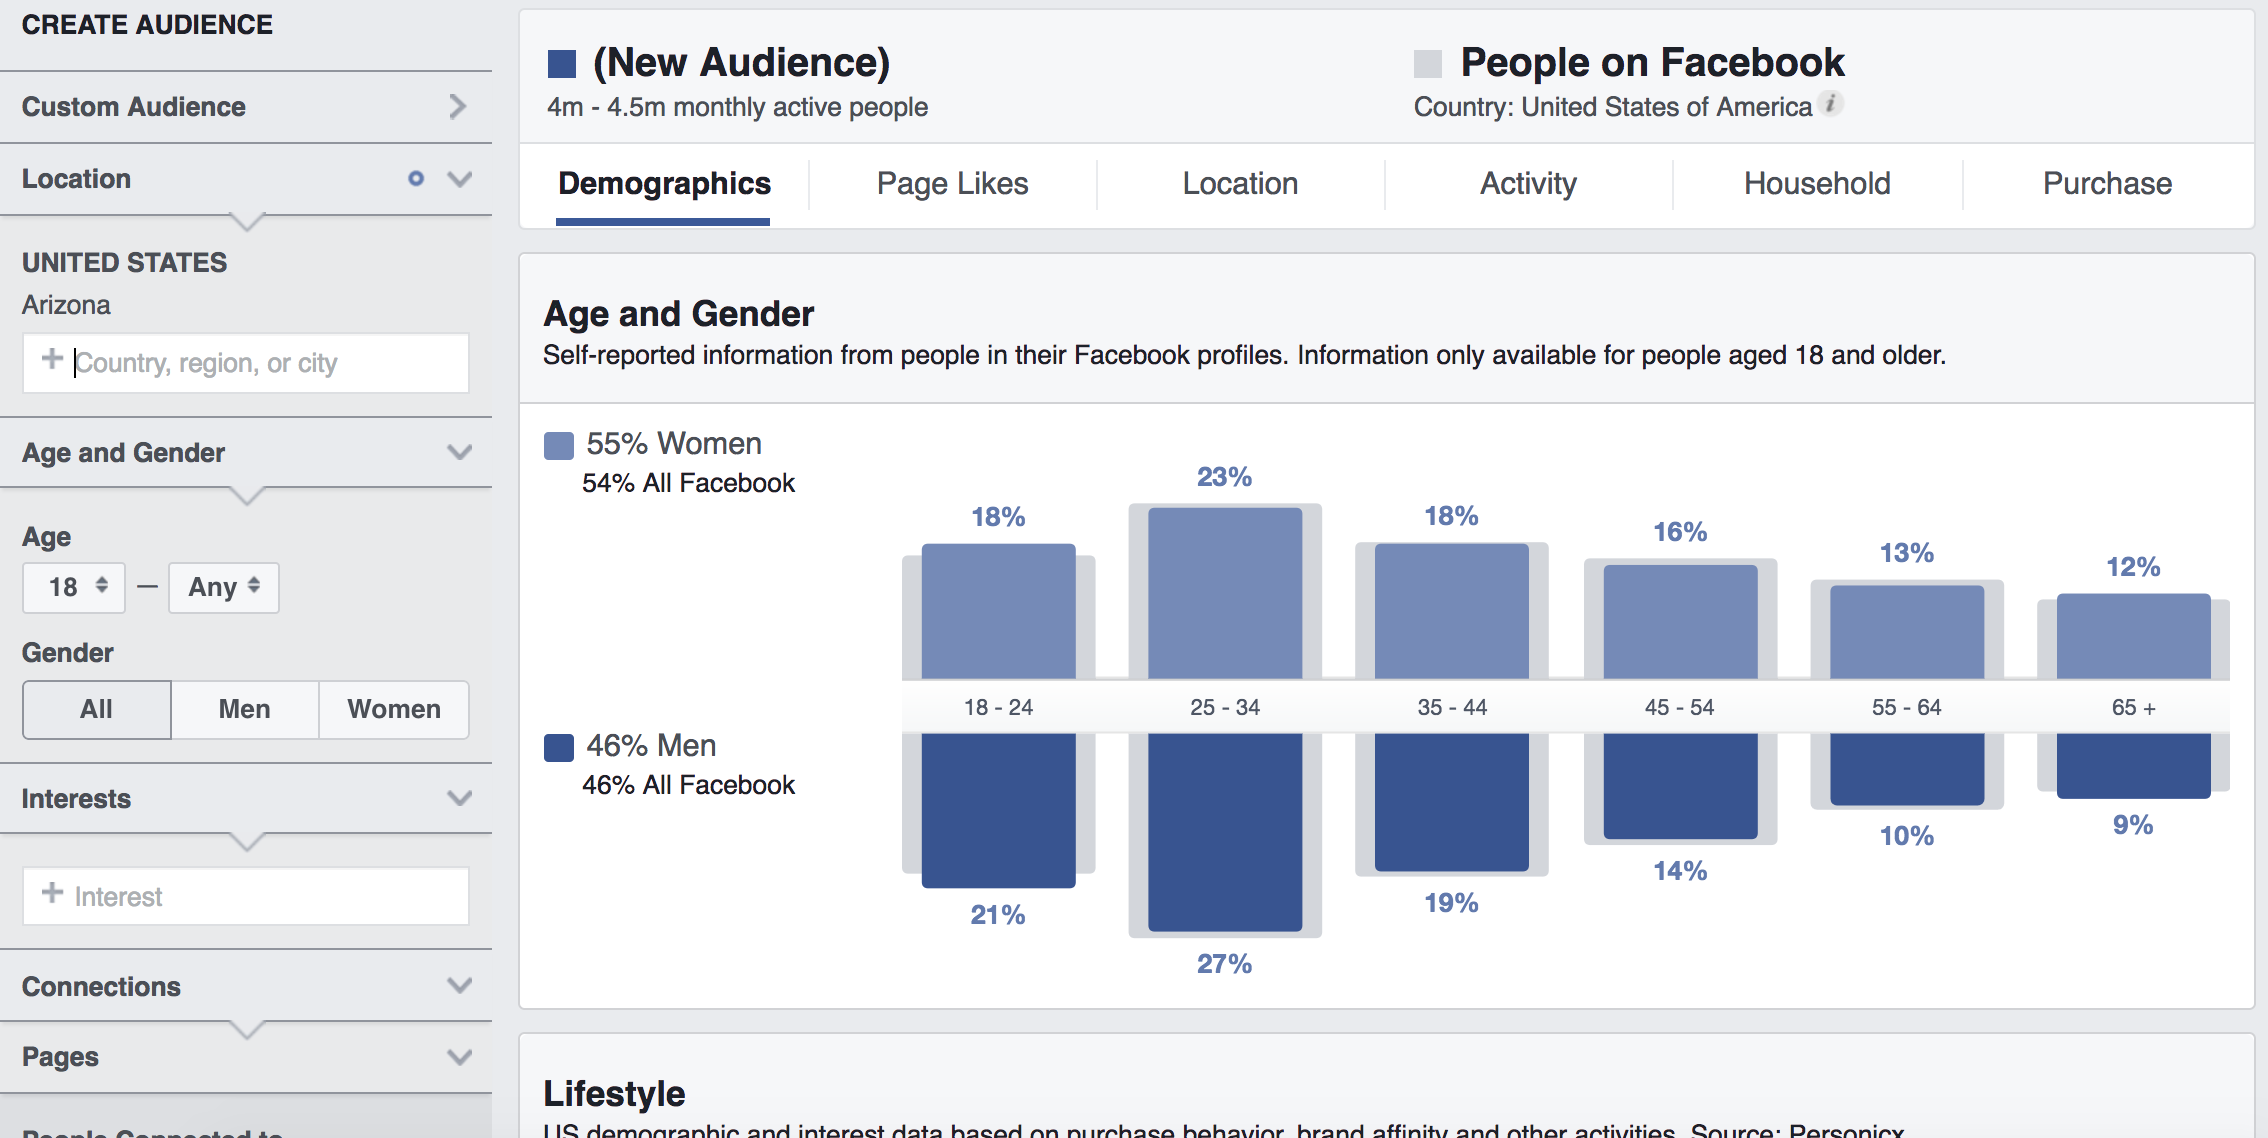
STEP 4: Now, narrow down your audience even further by selecting an age group, a gender or an interest from the options at left. Here, we’ve selected 18- to 30-year-olds with an interest in fitness and wellness; the Insights tool tells us that there are 600- to 700,000 Arizonans ages 18 to 30 who have indicated an interest in fitness.
STEP 5: Now that you’ve identified a “target” audience, explore it. Stay within the Demographics tab and scroll down to reveal information about the lifestyle, relationship status, job type, and education of your audience; think about what learnings you can take from this to apply to your overall marketing strategy. Then, go back to the top and click through the insights in the Household, Purchase, and Location tabs. Which of this data is helpful to you? Do you notice any major differences between “typical” Facebook users and your niche audience?
STEP 6: Finally, click on the Page Likes and Activity tabs. What other pages does this audience like? How can you replicate the success of those pages on your own? In the Activity tab, determine whether the audience you chose is more or less likely to engage on Facebook in the following ways. How can you turn these insights into action and audience growth? Our sample audience tends to comment, like, and click ads more often than typical Facebook users; this is a good opportunity for an Arizona fitness company!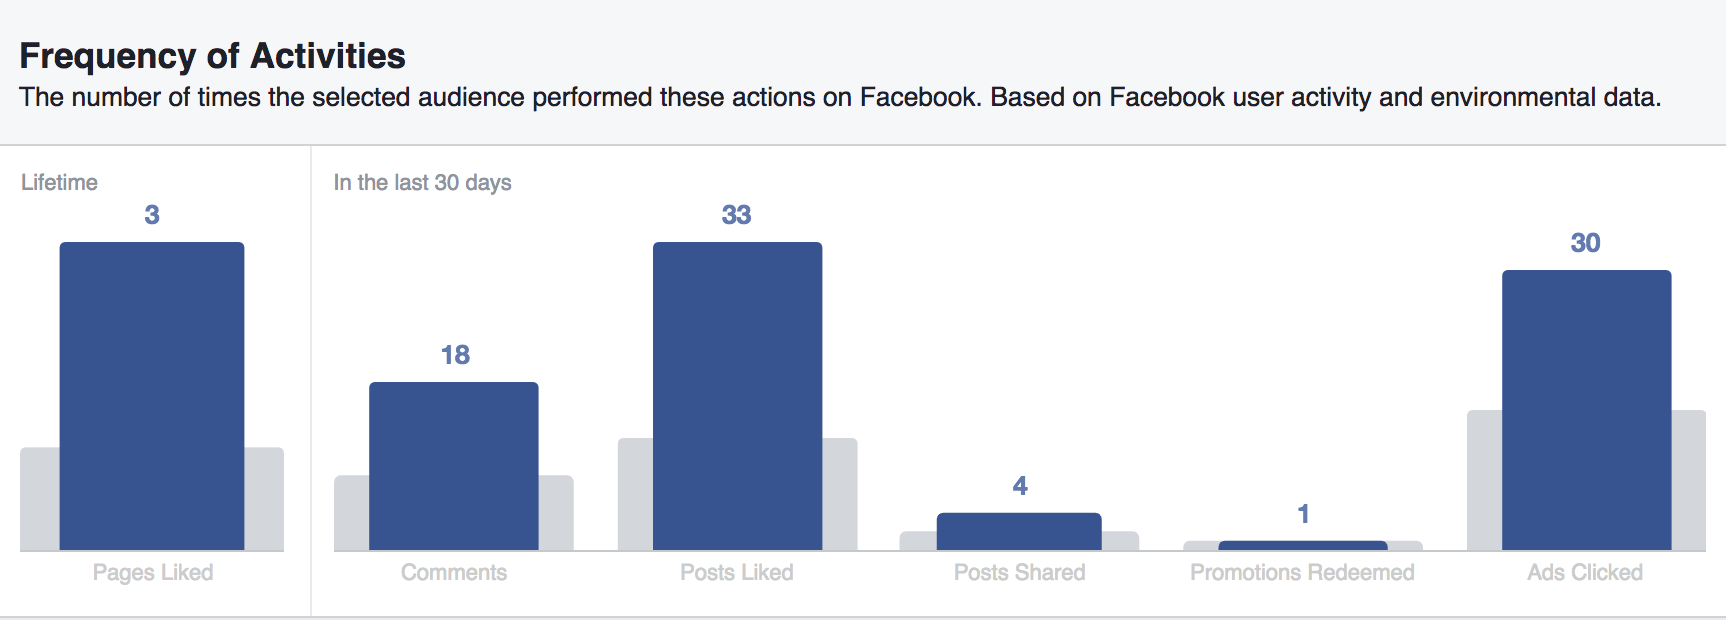
Most of the digital metrics available to analyze can be parsed into two buckets: reach metrics and engagement metrics. Generally, reach metrics explain how widely a piece of content (or a website, or an entire brand or message) was distributed and to whom, while engagement metrics explain how users interacted with that content once they saw it.
Social media metrics make for easy examples. To analyze the performance of a single tweet, we first have to understand its reach: How many times did Twitter serve it to users? How far did it “go”? That data, then, puts engagement metrics in context. What did users do with the tweet once it was shown to them? In twitter, and across most other social networks, the following core reach and engagement metrics are at the heart of social media analytics:
- Reach: Reach defines the number of accounts or users a piece of content was served to.
- Impressions: Impressions represent the number of times a social network has served a piece of content to its users. One person can see a single Instagram, say, four times; that’s four impressions, but a reach of only one.
- Engagements: Social media engagements are any action taken on a piece of social content. Likes, retweets, shares, comments, taps, video views, poll responses—all of these are engagements.
- Engagement rate: Divide the total number of engagements by the total number of impressions for an engagement rate, which describes how “engaging” a piece of content is. In other words, engagement rate describes how likely users are to interact with the given content.
Site and app data are quite different than social metrics, but they’re close cousins. Just as we can divide social content into “reach” and “engagement” boxes, we can do the same with site and app metrics—the numbers are different, but they still help us organize our thinking and analyses around to who is receiving our content and what they’re doing with it. To understand who our site content or app reaches, organizations examine metrics such as:
- Pageviews: A pageview is counted when a user visits a page. It’s that simple! Be careful, though: A pageview is not a user. One person or one user can view a page more than once, and visit several different pages.
- Unique pageviews: Technically, Unique Pageviews (or “uniques”) are the number of sessions during which a specified page was viewed at least once. Uniques are not synonymous with “people” or “users”; one person can view a page on a laptop and the same page the next day using a mobile device… that’s two unique pageviews, but only one user.
- Sessions: A session is a single visit to your site or app; it’s the group of interactions made by a single user within a given time frame. A single session can contain multiple pageviews, clicks, events, transactions, and more. Knowing how many sessions or visits our audience initiates is a critical piece of the puzzle:
- Video views: A video view is counted whenever a user clicks “play” on a digital video—or when a social network or video platform auto-plays a video.
- Geography: Are your users actually from the state, region, or country you hope to do business in? Geography reports help explain whether the people interacting with your content are in your target markets.
- Device: If you know what kind of device—desktop, mobile, or tablet—your audience uses to access you, you can better tailor your website’s design and content to their needs.
- Source: Knowing your audience’s acquisition source—or where your site or app traffic comes from—is as important as knowing who’s showing up. Users can access your site by typing the URL into a browser or clicking a bookmark, or they can find your site via a search engine, a tweet, a Facebook post, an ad, an email, or a link on another website. Source breakdowns tell organizations which of these avenues are driving users to particular pages, which helps organizations understand where to spend their marketing energy.
Understanding who is getting to our site or downloading our app with those reach-related metrics is a critical step in evaluating digital performance—not only do they provide interesting business insights alone, but they set the stage for many other metrics, including engagement metrics. We can’t begin to understand, for example, how many users abandoned an ugly web page until we first know how many people arrived there. Sessions, pageviews, and unique pageviews—as well as segments of those, such as mobile sessions, or pageviews acquired by search engines—are building blocks for engagement metrics that explain how users behave with digital properties once they get there. Engagement or behavior metrics include:
- Average time on page: Time on page metrics help marketers understand how long users spend on each piece of content. It’s often safe to assume that the more time users spend on a page, the more highly engaged they are with that page’s content; therefore, time on page (and, similarly, session time metrics) are good indicators of how engaging content actually is.
- Entrances: Entrances are the number of times users entered a site or app through a particular page; in other words, entrances represent the number of sessions for which the specified page was the first page in a session. It’s one thing for people to view a page at some point during the course of a session, but it’s quite another for a user to actually arrive at the site on a particular page. Entrances help organizations understand what products (or blog posts, or photos) attract users to the site or app in the first place.
- Exit rate: Close to (but not exactly) the opposite of entrances, exit rates tell the story of pages in terms of how often they exit. To calculate exit rate, analytics platforms divide the number of exits from a page by that page’s total pageviews. Essentially, exit rate is a measure of how likely users are to leave a site from the given page.
- Bounce rate: A bounce is a session that includes only a single page–sessions in which users reached a single page and clicked no further. The bounce rate, then, is the number of these single-page sessions divided by all sessions; the quotient is the percentage of sessions that only viewed a single page.
- Conversions: Think back to your digital marketing funnel. A conversion is the action users take that moves them from potential customer to actual customer. Sometimes the point of conversion is a completed sales transaction, but other times it’s an app download, a form submission, a series of steps taken—say, viewing four articles. Marketers can configure their analytics program to report on when and where most conversions take place.
- Completion: Just because a user arrives on a web page or plays a video does not mean they’ll consume every word or frame of content. Completion tells us how many users watched through to the very end of a video, or scrolled all the way down to the bottom of a page. When completions are divided by pageviews or video views, the metric becomes a “completion rate,” which suggests how likely the audience is to complete the content.
Alone, any of these metrics can reveal snippets of content performance: How many times that Instagram post was seen, how many users downloaded that app, how long they watched that video. But taken together, they tell the audience narrative. Individual metrics combine in the art and science of audience analytics to help organizations reach their goals efficiently—and identify who to reach next.
Exercise
TRY IT: TWITTER ANALYTICS
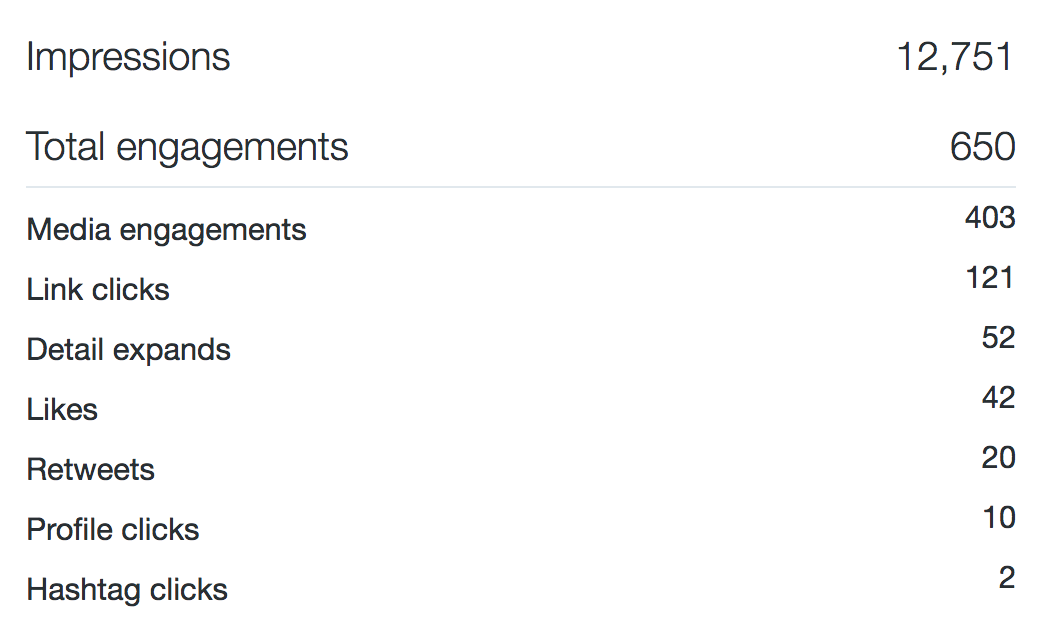
Below is a tweet from Cronkite News, the news department of Arizona PBS; it’s goal is to get users to click on the link and get to the full story. Use the tweet’s corresponding analytics to answer the following questions:
- How many impressions did this tweet earn?
- How many total engagements did this tweet earn?
- Calculate the engagement rate (remember: that’s total engagements divided by impressions).
- Is the engagement rate above or below the account average of 2%?
- Do the types of engagement this tweet received make this tweet a success? Why or why not?
- What would you change about this tweet to increase its impressions?
- What would you change about this tweet to increase the desired engagement types?

Exercise
TRY IT: STRATEGIZING WITH CONTENT & ENGAGEMENT
Imagine that you are the founder of MartianAde, a new lemonade company. It’s not your average lemonade: Your lemonade is made with lemons grown on Mars. You create a gorgeous 20-second video that highlights your out-of-this-world (literally!) lemons and the red earth they grow in; then, you create a second video showcasing the lemons’ space journey from Mars to your factory on Earth. You plan to share the videos in social media, as well as on your website above text that details your unique lemonade-making process.
Answer the following questions:
- Describe your target audience for the videos. What characteristics, interests, or behaviors do they share?
- How will you reach your target audience?
- How will you measure the videos’ success in social media?
- How will you measure the success of the videos on your website?
- What steps can you take to encourage people who watch the videos to actually buy the lemonade?
- What can you do to build loyalty with customers who have already purchased MartianAde at least once?
Exercise
TRY IT: PERSONAL SOCIAL MEDIA AUDIT
- What is your average number of posts per day?
- What is the post with the highest reach or impressions? Why?
- What is the post with the lowest reach or impressions? Why? How could you change the post to improve its reach/impressions?
- What is the post with the highest engagement rate? Why?
- What is the post with the lowest engagement rate? Why? How could you change the post to improve its engagement rate?
- What do the posts with the top 10 engagement rates have in common?
- What do the posts with the lowest reach/impressions have in common?
- Does there seem to be a pattern to the days on which your reach/impressions are higher than others? Discuss.
- How many page likes or followers does your account have?
- What are your account’s greatest strengths and weaknesses?
- What kind of content should you CREATE for this account?
- What kind of content should SHARE from this account? (As in, what content created by others does it make sense to curate/share with your audience?)
- What conversations should you join to grow and engage your audience?
- Going forward, what will you change about your posting habits to reach and engage more users with this account?
Resources
- NPR‘s Private Personal Finance Facebook Group[4]
- The Content Strategist, Contently[5]
- Whiteboard Friday, Moz[6]
Jessica Pucci is a professor of practice at the Cronkite School, specializing in data analytics and audience engagement. She leads social media and analytics for Cronkite News, the news division of Arizona PBS, and also teaches a course in analytics and engagement. Reach her on Twitter at @jessica_pucci.
Leave feedback on this chapter.
- Elizabeth Mays, "Marketing Your Venture to Audiences," Media Innovation and Entrepreneurship, https://press.rebus.community/media-innovation-and-entrepreneurship/chapter/marketing-your-venture-to-audiences/#aidafunnel. ↵
- Ricardo Bilton, “NPR Built a Private Personal Finance Facebook Group That Now Has More Than 10,000 Members,” NiemanLab, April 6, 2016, http://www.niemanlab.org/2016/04/npr-built-a-private-personal-finance-facebook-group-that-now-has-more-than-10000-members/. ↵
- TNT, “A Dramatic Surprise in a Quiet Square,” YouTube, https://www.youtube.com/watch?v=316AzLYfAzw. ↵
- Bilton, Ricardo. "NPR Built a Private Personal Finance Facebook Group That Now Has More Than 10,000 Members." Nieman Lab. April 6, 2016. Accessed July 14, 2017. http://www.niemanlab.org/2016/04/npr-built-a-private-personal-finance-facebook-group-that-now-has-more-than-10000-members/. ↵
- “The Content Strategist,” Contently, https://contently.com/strategist/. ↵
- “Whiteboard Friday,” Moz, https://moz.com/blog/category/whiteboard-friday. ↵
