4.6 The Measurement File’s Role in Colour Profiling
Alan Martin
It’s important to remember that the measurement file is not a profile! It provides the basic information about the colour behaviour of the device but needs some critical additional instructions and the processing of the colour management software in order to produce a colour profile that can be used for colour transformations. The measurement file is a snapshot in time of device behaviour and depends on the appropriate calibration of the device prior to the chart’s creation for its accuracy.
Content of the Measurement File

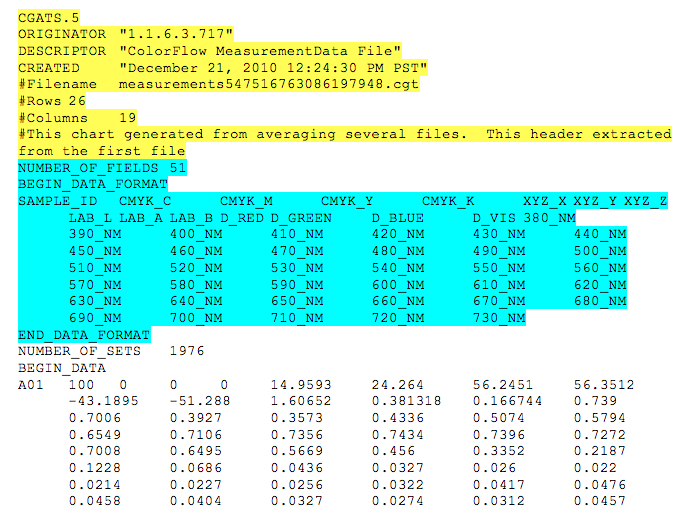
We can open the measurement file in a text editor and examine its structure to understand what information it contains (see Figure 4.8). The first section is header info and provides some basic information about the file. This is followed by a key to the colour data that follows. The actual colour information comprises a row and column ID to identify the specific colour patch and then the numerical data that goes with the patch.
The key information is contained in the second section where the data format is laid out. This indicates what colour spaces are captured in the data for each colour patch. The first four values are CMYK; the next three are XYZ (a device independent colour space like Lab); the next three are Lab; then RGB; and finally there is a wavelength measurement for each of the 10 nanometer slices of the visible spectrum (380-730 nanometers; violet to red).
The CMYK values for each patch are fixed in the software, coming from either the IT8 or ECI specification. These CMYK values have to remain constant because they are our point of reference for all devices. When we read the patch with the spectro, it uses the spectral information (each of the 10 nanometer slices) to calculate the XYZ and Lab values that describe the colour appearance of the colour swatch. By matching the measured Lab value to the predetermined CMYK value supplied in the original pdf, we have the raw material to build a translation table describing the device’s colour behaviour. Once we have this look up table (LUT), we can predict the Lab equivalent for any CMYK value produced on the device. Correspondingly, when we are given the Lab values from another device that we want to match, we can produce the appropriate CMYK values to provide that colour appearance.
Device Dependent Versus Device Independent Colour Spaces
We’ve defined CMYK, RGB, and Lab colour spaces, and we’ve seen how the first step in colour profiling is to measure output from a device to define a relationship between the CMYK device dependent and the Lab device independent numbers. Establishing this relationship between device dependent (RGB or CMYK) values and device independent (Lab) values is a fundamental component of the colour management process.
We call the CMYK and RGB colour spaces device dependent because the results we get from specific RGB or CMYK values depend entirely on the device producing them. When we tell a device to produce “50% cyan,” we are saying, “Give me half of as much cyan as you can produce.” Since the capacity and colour appearance of cyan from any two devices will not be the same, it should not be surprising that a specification of “half that much” will also produce colour events that do not match. Similarly, the RGB values on a monitor or projector simply specify some proportion of the full red, green, and blue signals that the device can produce. Since there is no common starting point between two monitors in terms of what a full red, green, or blue signal is, then providing the same RGB values to those two monitors will in no way provide an opportunity to generate the same colour appearance.
For RGB devices, RGB values simply identify the volume of signal for each channel. For printers, proofers, and presses the CMYK percentages dictate what proportion of pigments are deposited. The numbers associated with specific RGB and CMYK colours only have colour meaning when attached to a particular device. There is no inherent consistency between any two devices based on providing the same RGB or CMYK values.
So if the device dependent colour spaces don’t give us any consistency or control of colour between devices, where can we turn? Enter the device independent colour spaces of Lab and XYZ. We spoke of Lab earlier as the three-dimensional model colour science has produced to map the way we perceive colour. The Lab colour space is device independent because we do not depend on the values associated with the output of a specific device to enumerate the colour. Lab values are calculated from spectral readings in a controlled environment so that they define a consistent colour experience for any circumstance and from any device. Device independent colour is the Rosetta stone of colour management that allows us to translate from the unique dialect of colour behaviour on one device into a universal language and then back to the specific colour dialect of a different device and maintain the colour meaning.
The device independent colour spaces are known as profile connection spaces (PCS) since they provide this gateway service between the device dependent colour spaces of individual devices. Lab and XYZ are the two PCS allowed in the ICC specification that defines profile creation. From the examination of the measurement file, we can see how it provides the first step in establishing and tabulating a relationship between the device dependent values of a particular device’s output and the corresponding device independent values that characterize the actual colour appearance associated with the output.
We’ve talked about the measurement file as the gateway to our profile creation, so let’s see what steps remain to get us there.
