2.4 Research
Alex Hass
Step 2: Conduct Research
Gather and analyze information What else do you need to know? The information you collected in the first stage is just a starting point — now you need to do more research in order to fine-tune your goals and process. Check every assumption, ask more questions, and add detail.
Research practices may involve:
- Competitor analysis: analyzing the competition to see what they do and determine their strengths and weaknesses
- Ethnographic research: observing user behaviour and culture
- Site research: observing and understanding the strengths and weaknesses of a space to optimize the effectiveness of the design experience you will be creating; site research is necessary to any design project that is situated in a built environment
- Marketing research: analyzing behaviour in terms of consumer practices, including demographic profiling (grouping people based on variables such as age/income/ethnicity/location to create profiles generally describing their thinking/behaviour)
- User testing: measuring the ability of the product or service to satisfy users’ needs
- Co-creation: inviting end-users to brainstorm solutions with the design team before the concept phase of design begins
Incorporating Research into the Design Process
Research should be a part of all design process, but what kind of research is done, and who does it, will be determined by the scope and budget of the project. Some information may be publicly available, for example, through corporate publications or previously published marketing studies or market data, but a design company may need to partner with a research firm in order to do targeted in-depth research.
At the very least, design research should include:
- A literature review (gathering and reviewing all existing material that is relevant to your subject)
- Collected details (existing materials, corporate guidelines) of your client’s business and the services the client offers
- Information on the target audience (What do they want? need? expect?)
- Analysis of competitors (Who are they? how are they different? how are they the same? how do they advertise or make information available?)
- Estimates and technical advice from subcontractors (e.g., printers)
Some things to consider:
- Is a full design audit required? Much like a SWOT analysis, which assesses strengths, weaknesses, opportunities, and threats, a design audit applies the same stringent methodology to analyzing your competitors’ visual presence in the marketplace.
A graphic design audit is a fantastic and relatively easy way to get a clear picture of how your competitors are perceived, what key messages they are communicating and how you look when placed alongside them. It’s also a valuable exercise that informs you about the type of communication your customers are receiving on a regular basis from your key competitors. (Clare, 2006)
- What are the implications of the audience profile in relationship to the project goals?
- What is the most appropriate means to communicate with this audience (i.e., what media and marketing tools should you use)?
- How do the goals of this project fit into your client’s long-term goals?
- Is your client’s message what actually needs to be communicated in order to further the client’s business goals?
Research takes time and can cost money, but in the larger picture will save time and money by helping to focus the direction of the design process. It also helps you provide justification for your proposed communication solutions to your client. Remember that all research must be carefully documented and raw sources saved and made available for future reference.
Now that you have gathered all the information, it’s time to craft the design problem into a well-defined, succinct statement.
A Problem Well-stated is Half-solved
The writer Mark Levy, in his article A Problem Well-stated is Half-solved, developed six steps you can take to state a design problem so its solutions become clearer:
1. State the problem in a sentence. A single sentence forces you to extract the main problem from a potentially complex situation. An example of a problem statement: “We need to increase revenue by 25%.”
2. Make the problem statement into a question. Turning the problem statement into a question opens the mind to possibilities: “How do we increase revenue by 25%?”
3. Restate the question in five ways. If you spin the question from a variety of perspectives, you’ll construct new questions that may provide intriguing answers.
For instance, try asking: “How could we increase revenue by 25% in a month?” “How could we increase it by 25% in an hour?” “How could we increase it by 25% in a minute?” “What could we stop doing that might cause a 25% revenue increase?” “What ways can we use our existing customer base to affect the increase?”
4. Give yourself thinking quotas. An arbitrary production quota gives you a better shot at coming up with something usable, because it keeps you thinking longer and with greater concentration.
When I asked you to “Restate the question five ways,” that was an example of an arbitrary quota. There’s nothing magical about five restatements. In fact, five is low. Ten, or even a hundred, would be far better.
5. Knock your questions. Whatever questions you’ve asked, assume they’re wrong-headed, or that you haven’t taken them far enough.
You might ask, “Why do we need an 25% increase at all? Why not a 5% increase? A 500% increase? A 5,000% increase? What other things in the business might need to change that would be as important as revenue?”
6. Decide upon your new problem-solving question. Based on the thinking you’ve already done, this step may not even be necessary. Often, when you look at your situation from enough angles, solutions pop up without much more effort.
However, if you still need to pick a single question that summarizes your problem, and none seems perfect, force yourself to choose one that’s at least serviceable. Going forward is better than standing still.
Now you can start brainstorming.
Concept Mapping
A good way to begin the process of research and problem definition is to write down everything that you already know about your subject. This brainstorming can be done in a linear way by developing lists, or in a non-linear way, popular with designers, called concept mapping. Concept mapping is a non-linear approach that allows a designer to see what is known and what still needs to be researched. Concept mapping is also used to generate concepts and to create associations and themes.
W5 + 1
The first step is to take a sheet of paper and write a central title or topic in the centre. Then surround this central idea with information gathered by answering the following questions, based on the 5 Ws (who, what, where, why, and when), plus one more, how:
- What are you trying to communicate? (the problem)
- Why must communication occur? (what is its purpose?)
- Who is the target audience?
- Where will communication take place? (in what medium and location?)
- When will communication take place?
- How will you implement the concept?
- What if? (what would be ideal?)
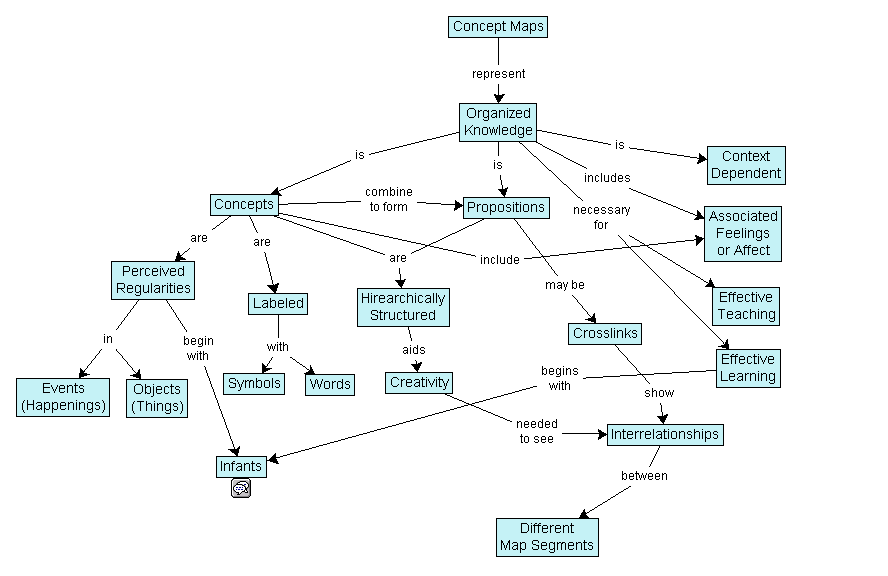
Once you’ve added all the information you have at hand, you will see any assumptions and gaps in that information, and you can begin specific directed research to create a larger, more objective picture.
Here is an example of a concept map (See Figure 2.2). To see a concept map that details the scope of visual communication, visit https://rossfitzy.files.wordpress.com/2012/05/final-visual-comm-map.jpg
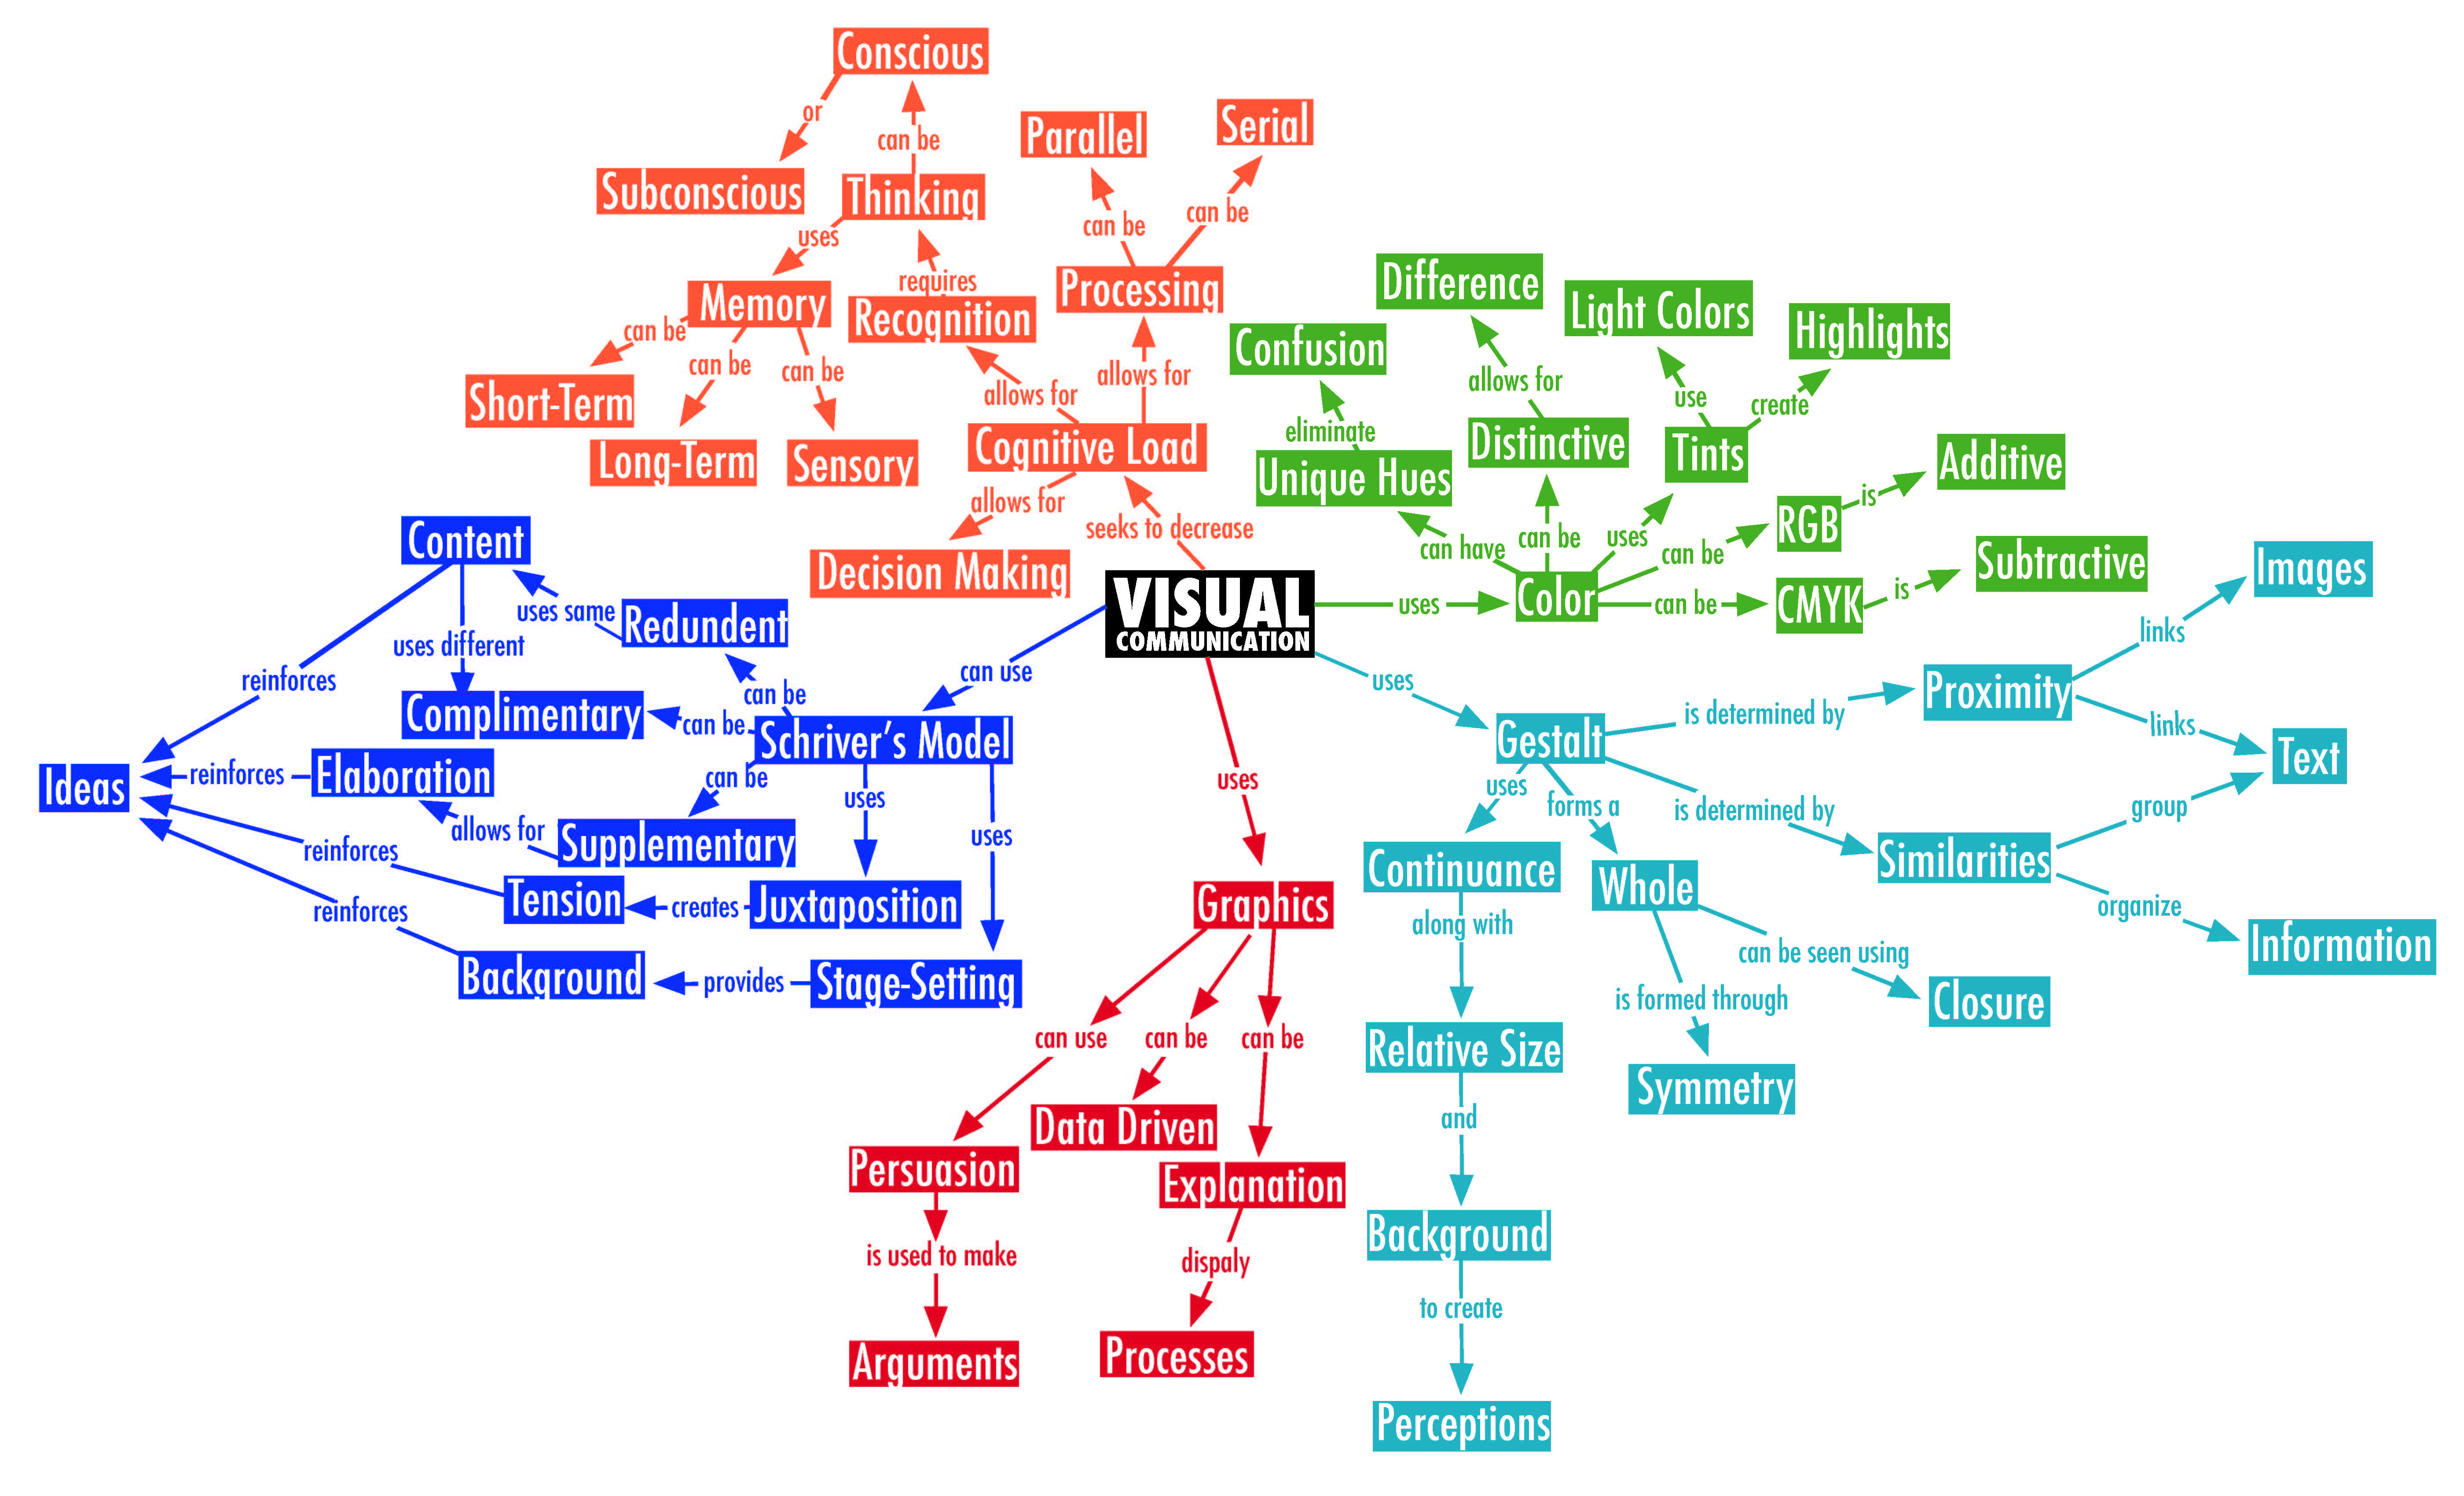
You can use the information in a concept map to generate other themes and concepts for your project. For example, in the concept map above, you could develop another theme by highlighting in yellow all information from the 1970s. This would reveal the parameters of design practice in the 70s and would additionally reveal what has been added and changed in design practice since.
Attributions
A Problem Well-stated is Half-solved by Mark Levy is used under a CC BY NC ND 3.0 license.
Figure 2.2
Concept map by Vicwood40 is used under a CC BY SA 3.0 license.