Aging and Frailty Lab Outline
Introduction
In Canada, it is projected that by the year 2030, 1 in 4 people will be over the age of 65 years (Statistics Canada, 2019). This will inevitably have an impact on the way that we care for the elderly and on health care spending. There are many physiological changes that occur with age, and these changes have a big impact on how and where we live our lives. To further understand the concept of aging, we must explore the ways in which the body changes with age. Furthermore, gaining an understanding of how to classify people according to their “degree of aging” could be helpful in a healthcare setting as it would help to prioritize those in need of medical care.
What is Frailty?
The term frailty is often used as a descriptor. In fact, it was recently used to describe the health of former Pope Emeritus Benedict XVI (France-Presse, 2020). But what does it mean to be frail? There is no internationally recognized definition of frailty. However, Clegg et al. (2013) provide a generally accepted definition for frailty as a condition where an individual is less able to tolerate a stressor event (e.g. a minor illness), increasing the likelihood of an even more negative outcome, such as a fall. For example, an individual who is considered frail may have deficiencies in vision, balance and strength, making them more likely to have a fall, and that fall may result in the permanent loss of functional abilities, thus leading to less independence.
What Causes Frailty?
Frailty is not the same as aging or disability; not all disabled people are frail, and not all frail are elderly. However, the prevalence of frailty does increase with age (Dent et al., 2016) due to the cumulative decline in multiple physiological systems (e.g. endocrine, immune, musculoskeletal) that occurs with normal aging that causes the individual to be less likely to tolerate a stressor event (Clegg et al., 2013). As we age, the rate of decline in these physiological systems differs among individuals due to both genetic and environmental factors. While there is a buffer of sorts that allows one to function normally as these systems decline (Chen et al., 2014) the buffer may be larger for some (i.e. the non-frail) and smaller for others (i.e. the frail).
The pathophysiology of physiological systems decline is a current field of research. For example, sarcopenia (accelerated loss of muscle mass and function) is caused by changes in muscle homeostasis. Net muscle mass is dependent on the rates of muscle formation and old muscle breakdown (hypertrophy), and the pathways and factors (e.g. hormones, nutrition, and activity) that control the formation/breakdown are still being researched (Cruz-Jentoft et al., 2019). A review of sarcopenia pathophysiology by Riuzzi et al. (2018) suggests multiple factors including decreased quality control of mitochondria, cell senescence, diet, and activity levels cause changes in the balance of reactive oxygen species, resulting in altered muscle stem cell properties that decrease their ability to regenerate muscle.
Let’s compare the situation of two hypothetical individuals with very different lifestyles and see how they respond to a stressor event. In this example, the stressor event is a minor infection that causes them to feel weaker than normal.
Individual 1 is not classified as frail – they normally exercise regularly, have a balanced diet, and have social supports to help them while they are sick (e.g. money to pay for someone to prepare their meals and take care of housework while they are in bed). Individual 1 can rest and recover back to their pre-infection health level.
Individual 2 is classified as frail – they have sarcopenia, low bone density, and live by themselves on a modest income. This individual needs to walk to the kitchen to prepare a meal, as they can not pay someone to come and help them. As they are walking, they feel extremely weak from the combined effects of the infection and sarcopenia, and are unable to support themselves, causing them to stumble and fall on their hip. Due to the low bone density, the hip breaks. This individual may go on to have a hip replacement, but they will not recover back to their pre-infection level of health, and have permanently lost some functional ability, which limits their independence. For individual 2, the deficits (sarcopenia, decreased bone density and lack of social supports) on their own were not enough to cause this very negative outcome (fall) due to the minor stressor event (infection). However, one can start to see how accumulating deficits will make an individual more vulnerable to a minor stressor event. This is what is meant by frailty.
How is Frailty Measured?
Clegg et al. (2013) identified 67 different ways of assigning frailty scores in the literature! So, which method should be used, and what is the test really telling us about aging? There are two general models for frailty. The first is the phenotype model developed by Fried et al. (2001), and the second is the cumulative deficit model developed by Mitnitski et al. (2001). In the phenotype model, five physical criteria - weight loss, exhaustion, weakness (grip strength), slowness (walking speed), and physical activity - were identified, where frailty is defined as the presence of 3 or more of these traits. However, this model does not consider cognitive impairment or psychosocial factors as part of the frailty phenotype. In the cumulative deficit model, a frailty index (FI) is calculated based on the accumulation of deficits. For example, if there are a total of 10 defined deficits, and a person has 5, they would have a FI of 0.5. This allows frailty to be better resolved, as it can exist along a continuum which allows medical interventions to be better tailored to the individual. Subsequent work on the cumulative deficit model by Jones et al. (2004) identified 92 deficits that could be counted based on a standardized comprehensive geriatric assessment (CGA), allowing the FI to be calculated based on a wide range of deficits that contribute to frailty, including physical (e.g. mobility and balance), cognitive, physiological and social factors. The downside to the cumulative deficit model is the time, money and training needed to assess all 92 potential deficits compared to the phenotype model.
Aging Research at McMaster
At McMaster University, the Canadian Longitudinal Study of Aging (CLSA) is a large, national, longitudinal study of more than 50,000 men and women who were between the ages of 45 and 85 when recruited. These participants are going to be monitored until 2033 or death. The goals of the CLSA are to identify characteristics that contribute to healthy aging. Data are collected through telephone and in-home interviews, as well as during visits to Data Collection Sites (DCS). Physical assessments are conducted to monitor characteristics such as mobility and mental acuity. We invite you to read the report on the McMaster Institute for Research on Aging (MIRA) for an overview of aging research conducted at McMaster!
These lab activities will provide you with an opportunity to experience some of the symptoms of frailty associated with aging, and introduce you to tests that allow us to assess both physical and cognitive frailty.
Lab Overview and Timeline
Note: You are working in PAIRS for this lab module.
| Time (min) | What will you be doing? | Total Time (min) |
|---|---|---|
| 0 - 15 | Overview of lab activities by the TA. Fill in pre-lab of lab notebook. |
15 |
| 15 - 85 | Lab Part 1: Physical Frailty Tests - Short Performance Physical Battery (SPPB) Lab Protocol 1A: Balance Test 1 Lab Protocol 1A: Balance Test 2 Lab Protocol 1A: Balance Test 3 Lab Protocol 1B: Gait Speed Test Lab Protocol 1C: Chair Stand Test |
70 |
| 85-115 | Lab Part 2: Cognitive Frailty Tests - Mini-Mental State Exam (MMSE) Lab Protocol 2 - Mini-Mental State Exam |
30 |
| 115-170 | Finish lab notebook and submit on Crowdmark. | 55 |
Lab Part 1: Physical Frailty Tests - Short Performance Physical Battery (SPPB)
Purpose
To simulate the physical symptoms of frailty associated with aging.
Summary of Activities
Each student will complete the Short Performance Physical Battery (SPPB) tests twice. The first time without the aging simulation equipment, and the second time while wearing this equipment.
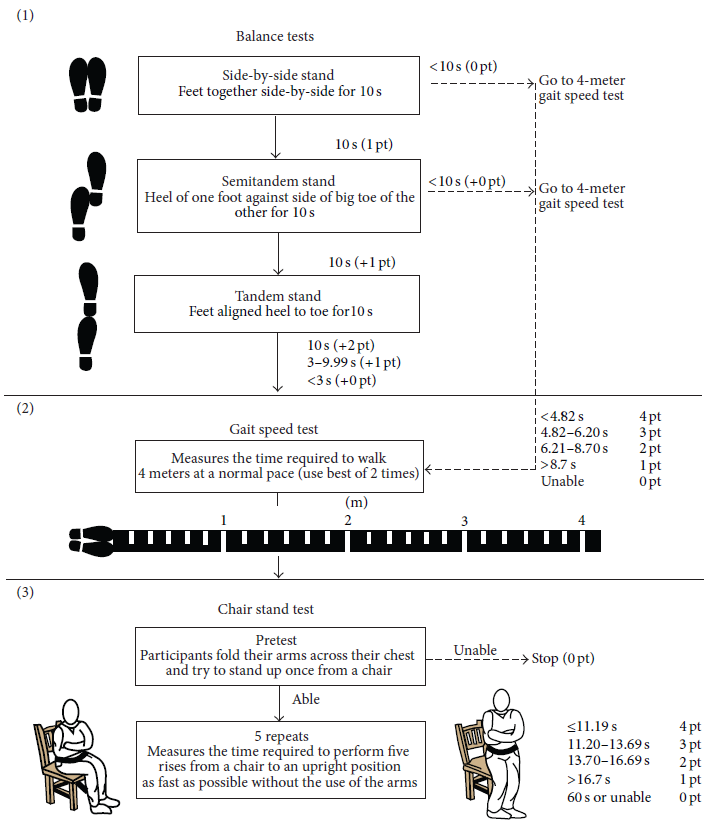
Figure 1 provides a pictographic summary of the SPPB. It consists of:
- Romberg balance tests
-
- side-by-side stand
- semi-tandem stand
- tandem stand
- Gait speed test (x 2 trials)
- Chair stand test
Points are awarded for each test based on successful completion and the time required to do so. Record the raw data (=times for completing tests) in table I, and record the points awarded for each test in table II. The points are awarded based upon the times. These tables can be downloaded to the lab computer and filled in and saved as your own unique copy. Copy the total score (/12) from table II into the class data set. Your TA will provide directions on how to add your pod's data into the class data set. You will then analyze the class data and submit as part of your lab notebook on Crowdmark. This is not a competition, but a chance to experience the physical symptoms of frailty!
Watch these videos demonstrating how the SPPB tests are completed and scored:
LSL Video Aging and Frailty - Aging Simulation Equipment
LSL Video Aging and Frailty - Short Performance Physical Battery (SPPB) Tests
Materials
- Aging simulation equipment for the SPPB. Each student will have:
- one pair of knee wraps (one size)
- two pairs of over shoes (small and large, use the size that fits)
- two back braces (small and large, use the size that fits)
- headphones and audio player (will play a ringing noise to simulate tinnitus)
- simulation goggles (opaque tape covers most of the lens to simulate glaucoma)
- simulation glasses (scratched lenses to simulate cataracts)
- Four meter path.
- This path will be indicated on the floor of the laboratory with tape
- Chair
- For chair stand test, make sure the chair is stable and not on wheels
- Stopwatch
- Use to record the time to compete the SPPB tests
- Excel tables to record data.
The aging simulation equipment used in the lab to simulate symptoms of frailty associated with aging are described in figures 2 - 4 below.
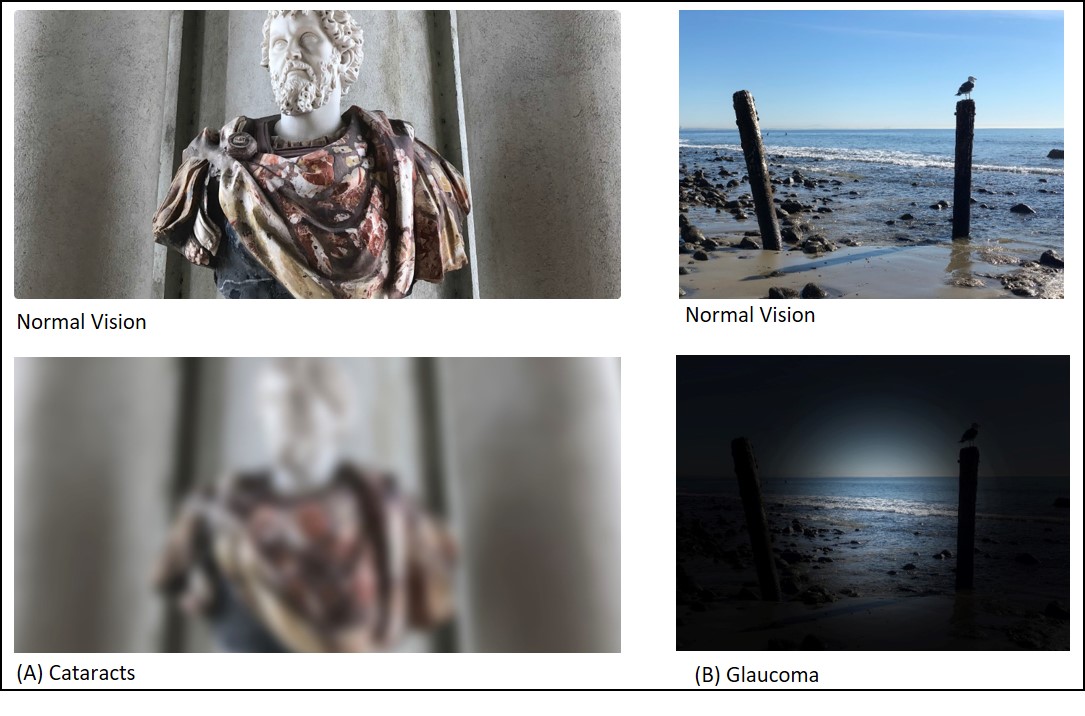
Figure 2: Aging simulation equipment used for the short performance physical battery tests. The knee and back braces restricted the normal range of motion one could perform and affected balance and gait speed. The overshoes had an uneven surface that came in contact with the floor and affected balance. The glasses used to simulate cataracts were made by scratching an old pair of glasses with sand paper. The goggles used to simulate glaucoma were made by applying opaque tape (e.g. electrical tape) to a pair of goggles to restrict the peripheral vision. You can wear either type of simulation glasses for the tests. Figure 3 demonstrates how the glasses/goggles affected vision. The headphones played tinnitus sounds. Click HERE to listen to tinnitus sounds from the British Tinnitus Association.
![]()
Figure 3: Aging simulation equipment used for the Mini Mental State Exam. The gloves affected dexterity, for example when trying to hold a pencil and draw. The cotton balls muffled hearing. The glasses simulated cataracts and the goggles simulated glaucoma (see description in figure 1 above)
Safety Reminders
You should always exercise caution and use common sense when working in any lab. In this module, these are a few of the activities where extra care is warranted:
- Look after each other! The simulations may be disorienting so make sure that someone is spotting you while walking and performing tests.
- When completing the chair stand test, use a chair with 4 legs, not a stool with wheels. A stool with wheels may slide out from under you.
- When wearing the headphones and playing the tinnitus recordings, start at the lowest volume and increase to a level that is comfortable (it can get very loud).
Pre-experiment activity:
Before you begin the SPPB tests, take a moment with your partner to draft a hypothesis and prediction for the outcomes (i.e. SPPB scores) of this series of tests. Be sure to include your research hypothesis and prediction statement as the answer to one of your pre-lab questions in your ELN.
Hazy on what a research hypothesis is? Don't remember how a prediction is different from a hypothesis? We've provided a refresher in the box below:
Formulating a Hypothesis
This information is also reviewed in LIFESCI 2A03: Research Methods in Life Sciences. If you've taken it before, feel free to review your notes there too.
Formulating a Hypothesis
- The formulation and testing of hypotheses is the basis of any scientific or rational inquiry. A hypothesis (H) can be defined as a testable explanation to a research question or problem. It also provides grounds to formulate specific predictions (P) about the result after manipulating variable(s) used to test the hypothesis.
- Predictions are the predicted outcome of the experiments you plan to do, while the hypothesis is the underlying mechanism you are testing
- In addition to your Life Sci 2A03 notes, here is another resource that provides some really good examples of a hypothesis vs. prediction
- A hypothesis and a related prediction are usually stated as follows:
- If (H) … , then (P)….
- Sometimes you may see it as: if (H)..., and (Method)...,then (P)
- Null hypothesis (H0 = statistical term):
- Usually a statement of "no effect" or "no difference”
- A hypothesis that there is no (significant) difference between two sets of results
- Alternative hypothesis (Ha):
- Hypothesis that is contrary to the null hypothesis
- It is often (but not always!) the research hypothesis
Example: I am interested in studying whether caffeine enhances academic performance.
If caffeine enhances academic performance, then drinking coffee will significantly increase the grades of students in a class.
Yellow: Hypothesis
Cyan: Prediction
Experiment: Divide a class into two groups. One group drinks only coffee, and the other group drinks only decaffeinated coffee. Compare their final class grades.
We will refer to this example hypothesis/prediction statement later when discussing experimental design in a later module.
Lab Protocol 1: Short Performance Physical Battery
lab protocol 1A: Romberg Balance Tests (figure 1 - panel 1)
Balance Test 1: Side-by-Side Stand
- The subject stands with their feet side-by-side and tries to maintain balance.
- The evaluator can initially provide support (e.g. an arm to lean on) to the subject if needed.
- Once the subject is in place, the evaluator lets go and starts the timer.
- Record how long the subject maintains their balance. Stop the test after 10 seconds.
- Record this time in table I and the corresponding score in table II.
- If the subject cannot complete this test (i.e. loses balance before 10 seconds), record a score of zero for the remaining balance tests (semi-tandem and tandem stand) and move to the gait speed test.
Balance Test 2: Semi-Tandem Stand
- The subject stands with their feet in a semi-tandem position – the side of the heel from one foot touches the big toe of the other foot.
- Repeat steps 2-5 from the side-by-side stand test.
- If the subject cannot complete this test (i.e. loses balance before 10 seconds), record a score of zero for the remaining balance test (tandem stand)
and move to the gait speed test.
Balance Test 3: Tandem Stand

- The subject stands with their feet in a tandem position – the heel from one foot is in front of and touching the toes of the other foot.
- Repeat steps 2-5 from the side-by-side stand test.
- Continue to the gait speed test.
lab protocol 1B: Gait Speed Test (figure 1 - panel 2)

- A 4 m path along the floor has been marked with tape for this activity. Ensure that there are no obstacles in your way!
- The subject stands with both feet touching the starting line, and will walk at their normal pace to just past the end of the 4 m path.
- Tell the subject to start walking, and start your timer.
- Stop the timer once the subject walks past the end of the course.
- Record this time in table I.
- Repeat steps 1-4 for the second trial.
- Use the best time from the two trials for determining the corresponding score and record this in table II.
lab protocol 1C: Chair Stand Test (figure 1 - panel 3)

- Pre-test - try standing from a chair (NOT on wheels) with your arms folded across your chest. If you are unable to complete this pre-test, do not complete the full chair stand test.
- If the test is incomplete, record a score of 0 points in table II.
- If you are able to complete the pre-test, record the time it takes to perform 5 chair stands repeatedly with arms folded in front of your body.
- If you unfold your arms from your chest or use your arms to assist with the chair stand, stop the test. In this situation, you would be given a score of 0 when grading the chair stand component of the test.
- Record the time to complete the chair stand test in table I and the corresponding score in table II.
Lab Part 2: Cognitive Frailty Tests - Mini-Mental State Exam (MMSE)
Purpose
To simulate the neurological/cognitive symptoms of frailty associated with aging.
Summary of Activities
The Mini Mental State Examination (MMSE) is a tool that can be used to assess mental status (Folstein et al., 1975). It is a survey that tests five areas of cognitive function:
- Orientation
- Registration
- Attention and Calculation
- Recall
- Language
The maximum score is 30. A score of 23 or lower would indicate some level of cognitive impairment. The MMSE takes only 5 to 10 minutes to administer and is therefore practical to use repeatedly and routinely. A similar test was developed by researchers at McMaster to assess cognitive function with respect to the ability to drive. Click to read more about this test if you are interested.
Pair up with someone from your lab section. You will take turns being the interviewer (i.e. 'clinician') and interviewee (i.e. 'patient'). There are two versions of the MMSE available, so make sure you are taking the test with a version you haven't seen.
Copy the scores (raw data) from this test into table III.
Materials
- Aging simulation equipment for the MMSE:
- earplugs (=cotton balls)
- oversized gloves (one size, red side of glove is the palm of hand)
- goggles (opaque tape covers most of the lens to simulate glaucoma)
- glasses (scratched lenses to simulate cataracts)
- You will wear this equipment only while completing the test as the interviewee ('patient')
- MMSE Test
- There are two versions. When it is your turn to be interviewed, make sure you are answering questions from the version you have not seen. Printed and laminated copies of the two versions of the test will be provided by the TA.
- Box with various objects (objects will need to be identified as part of MMSE - obtain these from TA)
- Scrap paper (2 pieces) and pencil/pen (you will need to write on the paper during the MMSE)
Lab Protocol 2: Mini-Mental State Exam (MMSE)
- Pair up with another person in your pod.
- Within your pair, one person will act as the ‘interviewer’, and the other person will be the ‘patient’. Only the patient needs to wears the aging simulation equipment. You will then switch roles.
- INTERVIEWER ('Clinician') ONLY: Ask the TA for an MMSE test and two objects. Don't let the patient see the test questions or objects before it is administered to them. Read through the test on your own first so you understand how to administer it and record the scores in table III.
- Have a pencil or pen and a few pieces of scrap paper on hand for when they are needed during the test.
- Complete the MMSE interview. Provide the results of the test to the 'patient'.
- Switch roles and repeat steps 3 – 6. Make sure the new interviewer uses a different test version and new objects.
Lab Exit Checklist
- Download the tables for recording your data from lab parts 1 and 2.
- Draft an "if/then" hypothesis and prediction statement for the SPPB experiments.
- Complete the short performance physical battery tests WITHOUT the aging simulation equipment and record the times/scores in tables I and II.
- Complete the short performance physical battery tests WITH the aging simulation equipment and record the times/scores in tables I and II.
- Input your pod's data (including the total score) from table II to the class dataset. The TA will provide you with directions for sharing the data.
- Complete the MMSE with the aging simulation equipment as the interviewee (e.g. patient)
- Complete the MMSE as the interviewer (e.g. clinician)
- Interviewer: Provide the MMSE results to the patient
- Interviewee: Record your scores from the MMSE in table III
- Fill out and submit your lab notebook on Crowdmark
References
Chen, X., Mao, G., & Leng, S. X. (2014). Frailty syndrome: An overview. Clinical Interventions in Aging, 9, 433–441. https://doi.org/10.2147/CIA.S45300
Clegg, A., Young, J., Iliffe, S., Rikkert, M. O., & Rockwood, K. (2013). Frailty in elderly people. The Lancet, 381(9868), 752–762. https://doi.org/10.1016/S0140-6736(12)62167-9
Cruz-Jentoft, A. J., & Sayer, A. A. (2019). Sarcopenia. The Lancet, 393(10191), 2636–2646. https://doi.org/10.1016/S0140-6736(19)31138-9
Dent, E., Kowal, P., & Hoogendijk, E. O. (2016). Frailty measurement in research and clinical practice: A review. European Journal of Internal Medicine, 31, 3–10. https://doi.org/10.1016/j.ejim.2016.03.007
France-Presse, A. (2020, August 3). Emeritus Pope Benedict, 93, “extremely frail” after visiting dying brother. The Telegraph. https://www.telegraph.co.uk/news/2020/08/03/emeritus-pope-benedict-93-extremely-frail-visiting-dying-brother/
Fried, L. P., Tangen, C. M., Walston, J., Newman, A. B., Hirsch, C., Gottdiener, J., Seeman, T., Tracy, R., Kop, W. J., Burke, G., & McBurnie, M. A. (2001). Frailty in Older Adults: Evidence for a Phenotype. The Journals of Gerontology: Series A, 56(3), M146–M157. https://doi.org/10.1093/gerona/56.3.M146
Jack Guralnik. (n.d.). Short Physical Performance Battery (SPPB). National Institute on Aging. Retrieved January 7, 2021, from http://www.nia.nih.gov/research/labs/leps/short-physical-performance-battery-sppb
Jones, D. M., Song, X., & Rockwood, K. (2004). Operationalizing a Frailty Index from a Standardized Comprehensive Geriatric Assessment. Journal of the American Geriatrics Society, 52(11), 1929–1933. https://doi.org/10.1111/j.1532-5415.2004.52521.x
Marshal F. Folstein, Susan E. Folstein, & Paul R. McHugh. (1975). “Mini-mental state”: A practical method for grading the cognitive state of patients for the clinician. Journal of Psychiatric Research, 12(3), 189–198. https://doi.org/10.1016/0022-3956(75)90026-6
Mitnitski, A. B., Mogilner, A. J., & Rockwood, K. (2001). Accumulation of Deficits as a Proxy Measure of Aging. The Scientific World JOURNAL, 1, 323–336. https://doi.org/10.1100/tsw.2001.58
Riuzzi, F., Sorci, G., Arcuri, C., Giambanco, I., Bellezza, I., Minelli, A., & Donato, R. (2018). Cellular and molecular mechanisms of sarcopenia: The S100B perspective. Journal of Cachexia, Sarcopenia and Muscle, 9(7), 1255–1268. https://doi.org/10.1002/jcsm.12363
Rodríguez-Mañas, L., Bayer, A. J., Kelly, M., Zeyfang, A., Izquierdo, M., Laosa, O., Hardman, T. C., & Sinclair, A. J. (2014). An evaluation of the effectiveness of a multi-modal intervention in frail and pre-frail older people with type 2 diabetes - the MID-Frail study: Study protocol for a randomised controlled trial. Trials, 15(1), 34. https://doi.org/10.1186/1745-6215-15-34
Statistics Canada. (2019, September 17). Table 17-10-0057-01 Projected population, by projection scenario, age and sex, as of July 1 (x 1,000). https://doi.org/10.25318/1710005701-eng
