Lab Report Writing Guide
This document was updated and revised by Mr. Ryan Belowitz and Dr. Ana Tomljenovic-Berube from a list of tips compiled by Dr. Rosa da Silva, Dave Nykamp and others (1996-Present).
Overview
Important Note:
Colours are used to indicate the various regions of the parts of a lab report in this lab report writing guide. These colours are for instructional purposes only. Unless you are explicitly asked to highlight text, you should never be highlighting your introduction, discussion, figure captions, etc. when submitting work for assessment in this course.
The purpose of writing lab reports at the undergraduate level is to teach you how to prepare a scientific research article (manuscript). You should review these directions before, during, and after you have finished writing your lab report to make sure that all the points have been addressed. We will use the AIMRAD format: Abstract, Introduction, Materials and Methods, Results, and Discussion. The end of the report will also have a section listing your references, as well as any appendices specified in the specific assignment instructions. In addition to this guide, we have provided you with a chapter from Writing In the Biological Sciences (Hofmann, 2019). This resource contains many useful examples.
The writing style for lab reports is likely different from other writing styles you have encountered. One of the best ways to learn how to write good laboratory reports is by reading primary research articles from peer-reviewed scientific journals. By reading original articles you will learn the general style of writing lab reports. Additional details for each assignment, including word limits, will be specified in the specific assignment instructions.
Every research journal will have its own specific guidelines for manuscript preparation (this is an example from the Journal of Experimental Biology). Likewise, this guide specifies the format that will be used in this course. Make sure you follow the directions in this document and the assignment instructions.
Hoffman, A.H., Writing in the biological sciences. (2019). New York, NY: Oxford University Press. pp. 111-139.
General Formatting Information
Margins:
- 1 inch (2.54 cm) all around
Font size:
- 12 pt
Font type:
- Any common sans-serif font, at your discretion (e.g. Arial, Calibri etc.).
Spacing:
- 1.5
Word Limits:
- Refer to the specific assignment instructions for each assignment.
- If you can cover all the required information in fewer words, then do so. Any penalties for exceeding the maximum word limits are specified in the specific assignment instructions.
Formatting Captions
Figures:
- Use numerical digits (e.g. 1, 2), bold figure number and title (e.g. Figure 1: Title…)
- Caption below figure (graph/image/diagram)
Tables:
- Use roman numerals (e.g. I, II, III), bold table number and title (e.g. Table I: Title…)
- Caption above table
Referencing
- APA. Use the most recent version.
- Refer to reference section of this guide
Citation Management Software
- We suggest using a citation management software supported by McMaster University Libraries
- Citation Management Software (such as Zotero, Mendeley or EndNote Basic) can assist you in organizing your references
- If you use any citation management software to generate your references, it is still your responsibility to ensure the citation is correct, including the format. If the citation information has been entered incorrectly by the authors, the software will not generate the citation correctly.

Cover Page
Complete the cover page using the template provided:
Cover page for individual work
If you are submitting a full lab report, include a descriptive title that tells the reader what the paper is about.
The DOs and DON’Ts list below refers to tips when deciding on the title of a lab report.
DO:
- Make it succinct, clear and complete
- Use a title that includes the organism and tissue being worked on
DON’T:
- Use “Lab Report #1” as the title
- Use the title in the lab manual
- Use non-standard abbreviations
Abstract
DO:
Abstracts are necessary for quick scanning of scientific literature when researching a topic.
An abstract should summarize the experiment and contain:
- Question/purpose/motivation/problem statement
-
- Why do we care about the problem?
- What mechanisms or biological phenomenon is/are being examined?
- Experimental/study approach, methods/procedure
-
- What was the experimental procedure to get your results?
- Main results of the experiment
-
- What did you find?
- Conclusion (answer)/implication
-
- What did you demonstrate and why is it important?
Assume that the reader has not read the rest of your paper and just wants to understand the main points. Write the abstract after you have finished writing the rest of the paper.
Keep in mind the structure we suggest you follow is not a universal rule for every research journal, but it is a good starting point when you are learning to write in science. As you gain additional writing experience and/or write for specific disciplines, you will likely encounter different conventions or exceptions to this structure that are accepted or preferred. As you can see in the examples provided below, not every abstract flows exactly from 1 > 2 > 3 > 4.
DO:
- Report values, including statistical values where applicable
- Draw conclusions (supported by your data), this can include observed trends
- Write the abstract last
- Use the correct tense – its a bit tricky in an abstract.
- Refer to this infographic or this article
DON’T:
- Use references in the abstract
- Refer to figures or tables
- Describe excessively detailed materials and methods
- Use non-standard abbreviations
- Give explanations for data
Abstract Examples
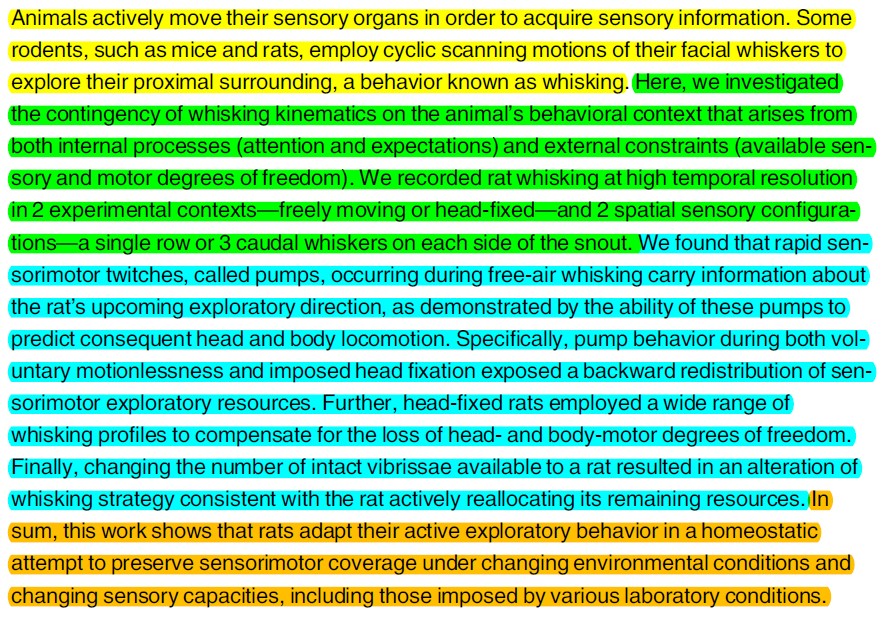
Example Abstract 1
Wallach, A., Deutsch, D., Oram, T. B., & Ahissar, E. (2020). Predictive whisker kinematics reveal context-dependent sensorimotor strategies. PLOS Biology, 18(5), e3000571. https://doi.org/10.1371/journal.pbio.3000571
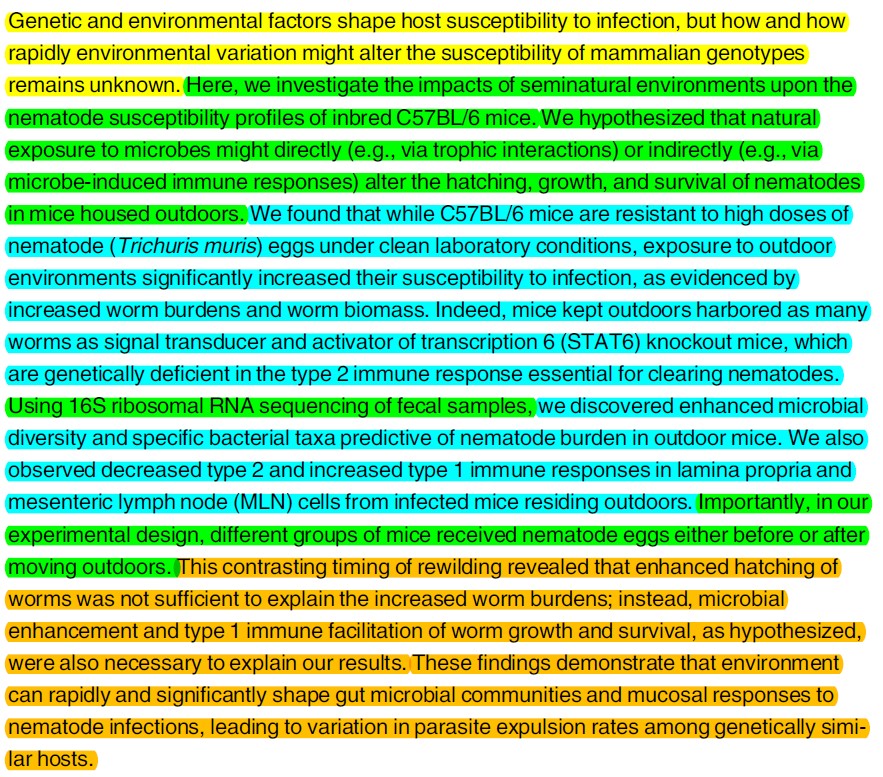
Example Abstract 2
Leung, J. M., Budischak, S. A., The, H. C., Hansen, C., Bowcutt, R., Neill, R., Shellman, M., Loke, P., & Graham, A. L. (2018). Rapid environmental effects on gut nematode susceptibility in rewilded mice. PLOS Biology, 16(3), e2004108. https://doi.org/10.1371/journal.pbio.2004108
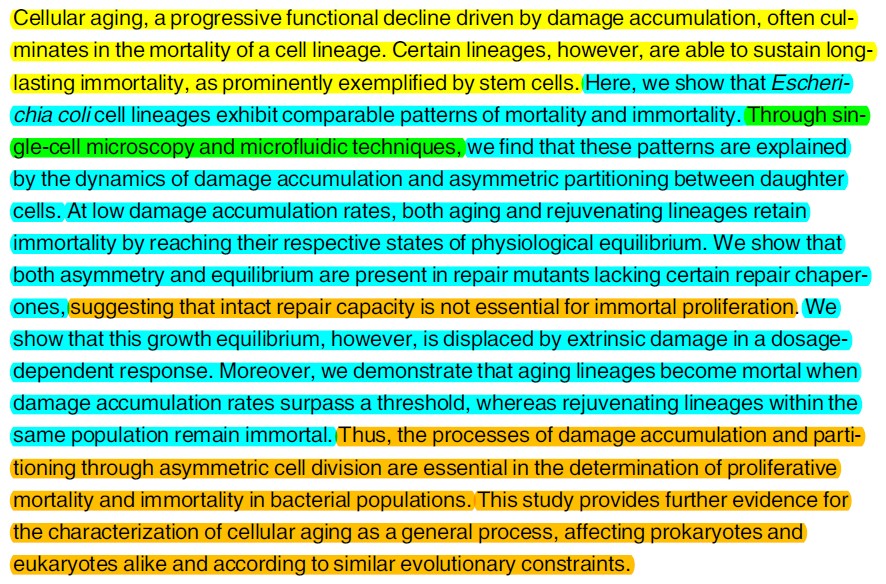
Example Abstract 3
Proenca, A. M., Rang, C. U., Qiu, A., Shi, C., & Chao, L. (2019). Cell aging preserves cellular immortality in the presence of lethal levels of damage. PLOS Biology, 17(5), e3000266. https://doi.org/10.1371/journal.pbio.3000266
Introduction
An introduction should let the reader know what you are doing in the experiment and why you are doing it (i.e. identifying the ‘gap’ in knowledge). You will need to review what is known about the subject area and how your experiment will contribute to what is known. Structure your introduction so it funnels the information from:
- Broad background about the topic
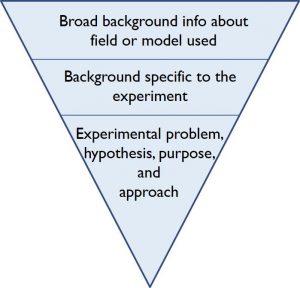
-
- Introducing terms and concepts
- Background more specific to the experiment
-
- What is the current knowledge based on research by others? Summarize the relevant findings.
- What did they observe and how does it relate to your study? This gives context to the experiments you are completing.
- Unknown problem of interest
-
- Based on the current knowledge in the area, what is still unknown that you are addressing in the study?
- Question/hypothesis
-
- Of your study/experiment
- Experimental/study approach
-
- Of your study/experiment
While we describe the introduction in terms of the 5 parts above, each part does not necessarily have an equal amount of text (weight) in the introduction. For example, while the background may be 2-3 paragraphs, the hypothesis and study approach may be just 1-3 sentences total.
Also keep in mind the structure we ask you follow is not a universal rule for every research journal, but it is a good starting point when you are learning to write in science. You may find that the introductions you read do not always flow exactly from 1 > 2 > 3 > 4 >5, but as a general rule, most follow this structure.
DO:
- Use references (see “Reference Section” below)
- Clearly state the objectives or purpose of your experiment(s)
- Include a hypothesis
- Use the correct tense. Refer to this infographic.
DON’T:
- Introduce unrelated (irrelevant) topics
- Explain materials and methods in excessive detail
- State any results or conclusions of your current study
- Use the lab manual as a reference
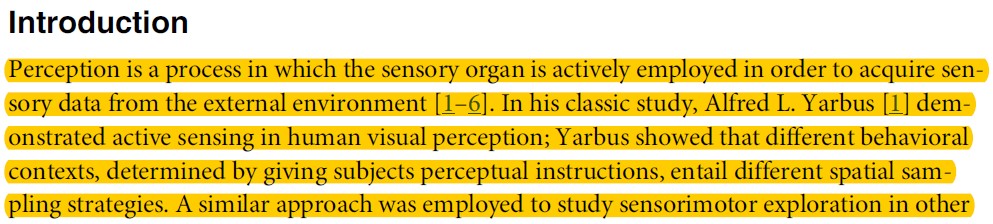
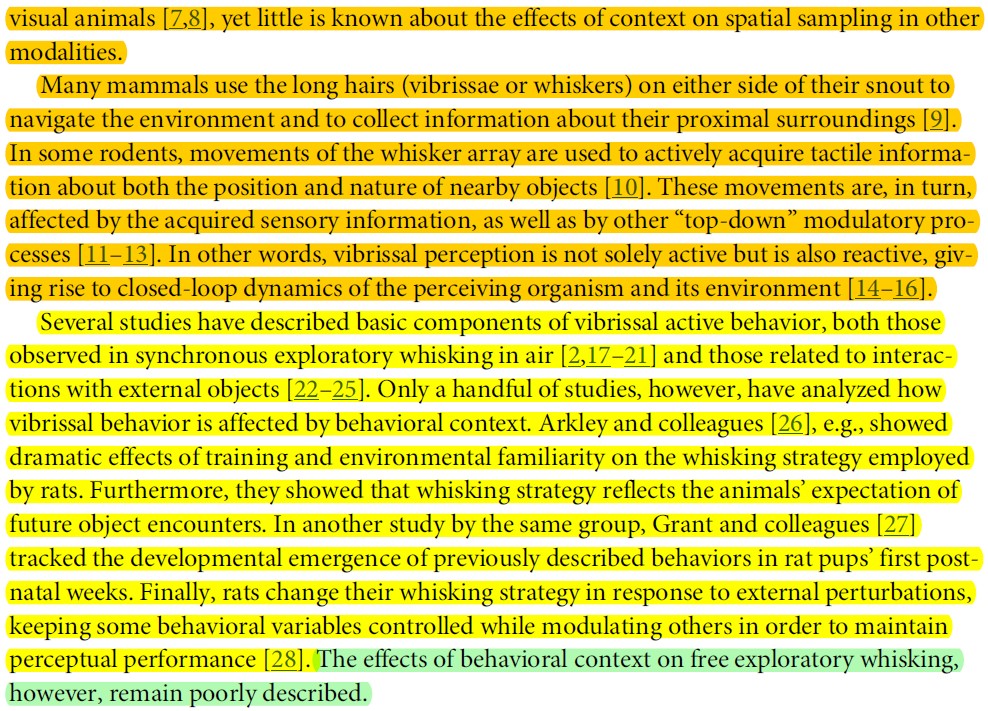
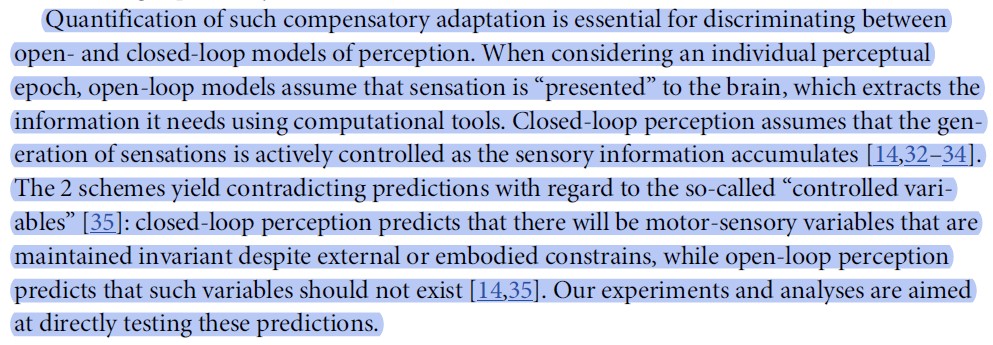
Example Introduction 1
Wallach, A., Deutsch, D., Oram, T. B., & Ahissar, E. (2020). Predictive whisker kinematics reveal context-dependent sensorimotor strategies. PLOS Biology, 18(5), e3000571. https://doi.org/10.1371/journal.pbio.3000571
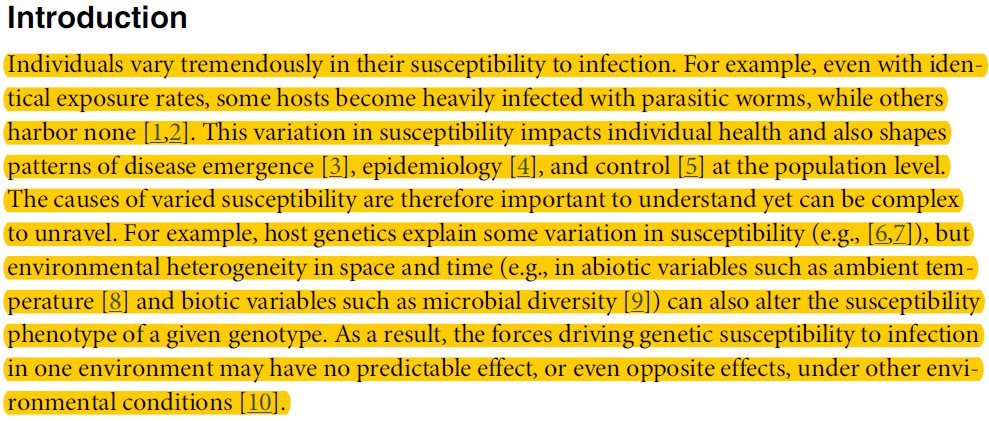
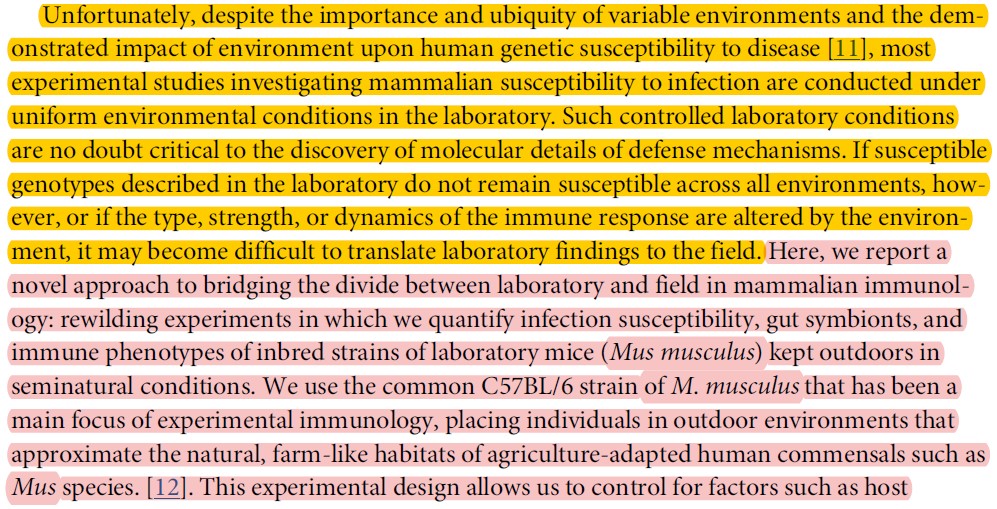
Example Introduction 2
Leung, J. M., Budischak, S. A., The, H. C., Hansen, C., Bowcutt, R., Neill, R., Shellman, M., Loke, P., & Graham, A. L. (2018). Rapid environmental effects on gut nematode susceptibility in rewilded mice. PLOS Biology, 16(3), e2004108. https://doi.org/10.1371/journal.pbio.2004108
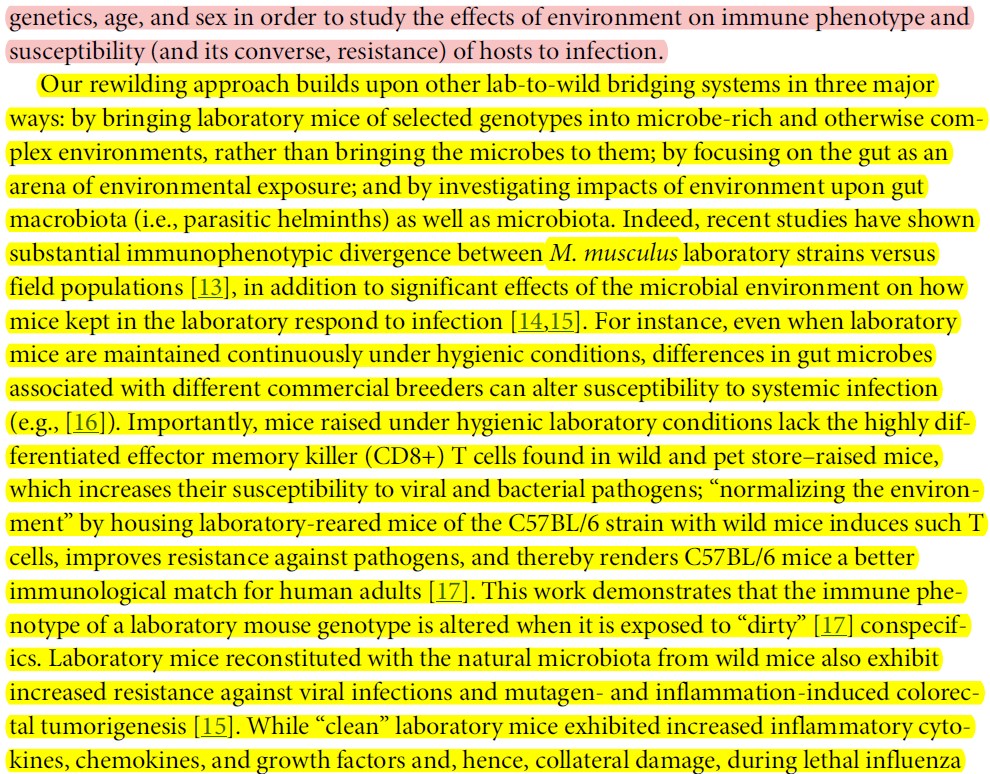
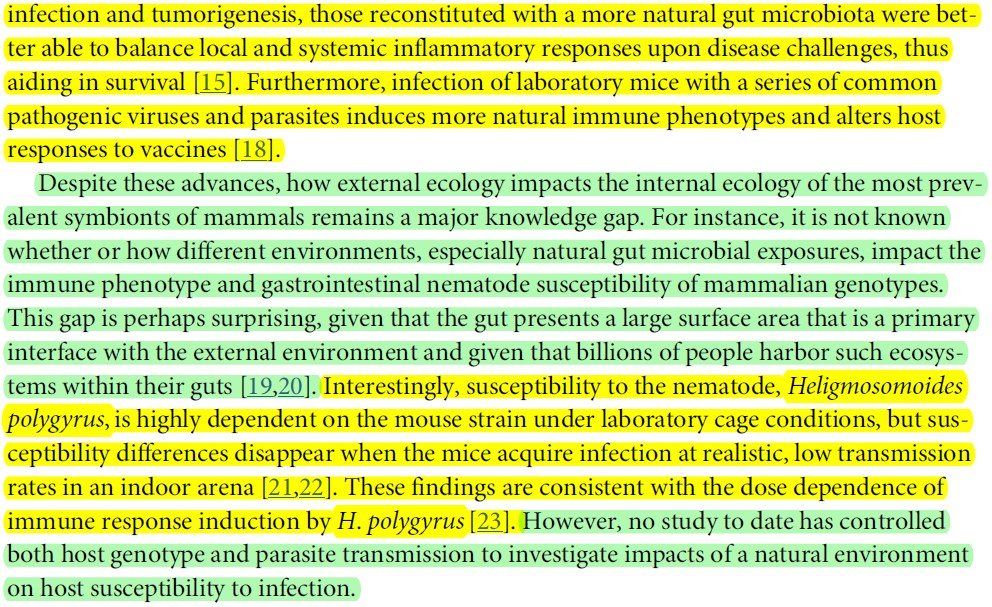
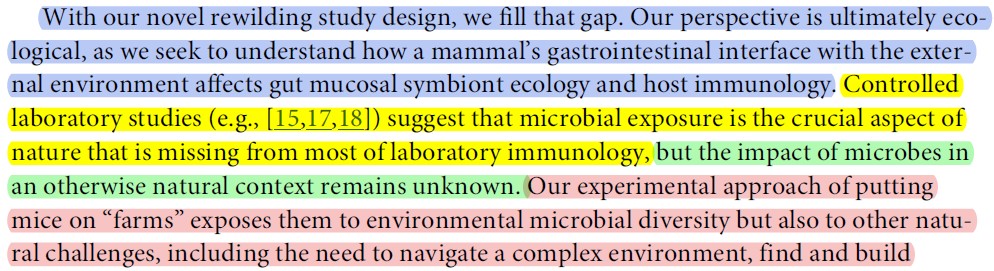
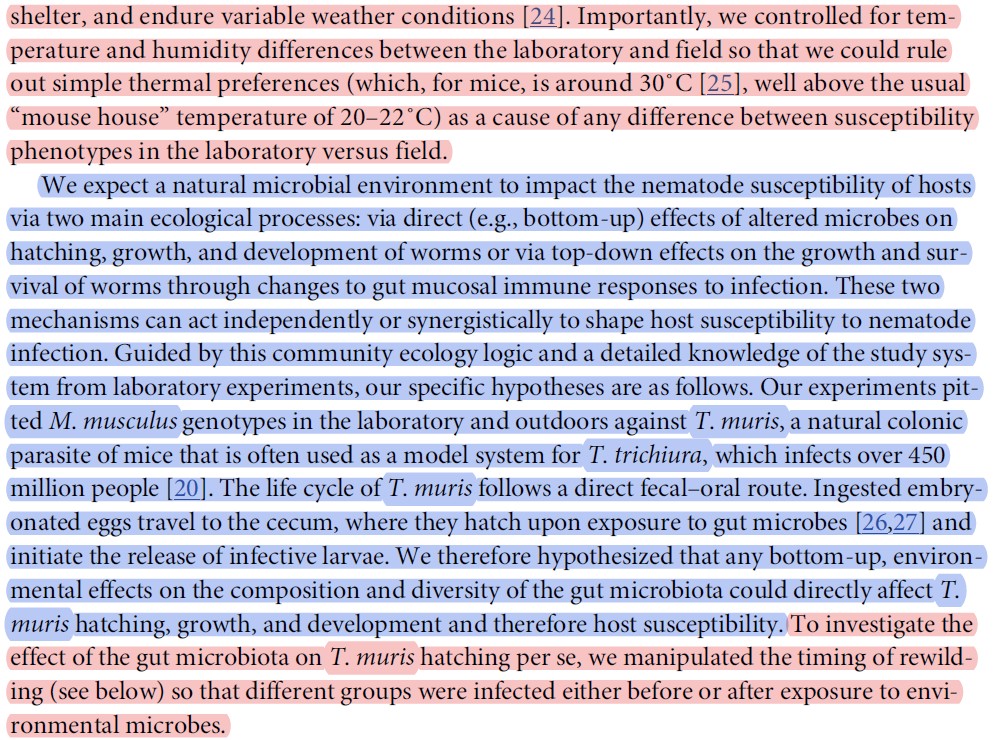
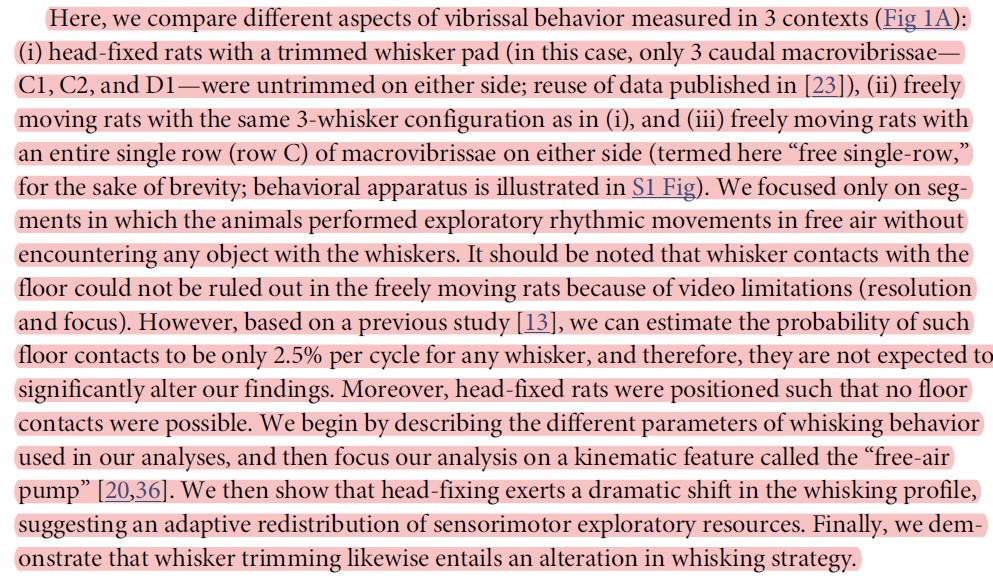
Methods and Materials
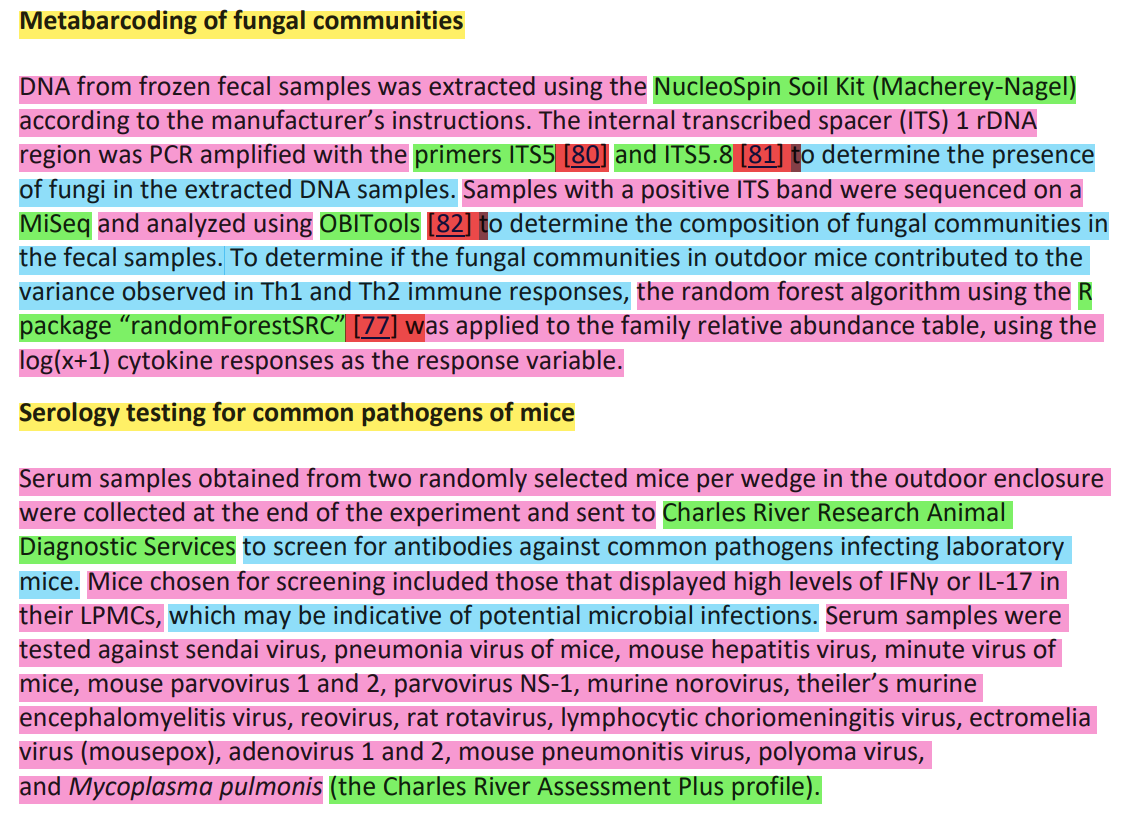
A well written methods and materials includes enough detail and information that your experiment is reproducible. It is written as a narrative in paragraph form (i.e. not a step-by-step protocol) and describes the experimental study/approach. It is usually sectioned with subheadings based on the actions or types of experiments (e.g. animal care, tissue preparation etc.). You want to be sure to clearly define your methodology, including technical specifications (this can include scientific names of animal models, brand names of kits used to perform assays, temperature or pH of a particular reaction, etc.), what types of control and experimental treatment groups were used, and just enough of the steps performed to ensure a reader will be able to try this method themselves without having to contact the author of the report! In some cases, a method may have been adapted from another primary research paper, and you may observe references to other sources in a published materials and methods section. It is also important to ensure that the PURPOSE of each procedure is clear to the reader, so it is understood why a certain method was performed.
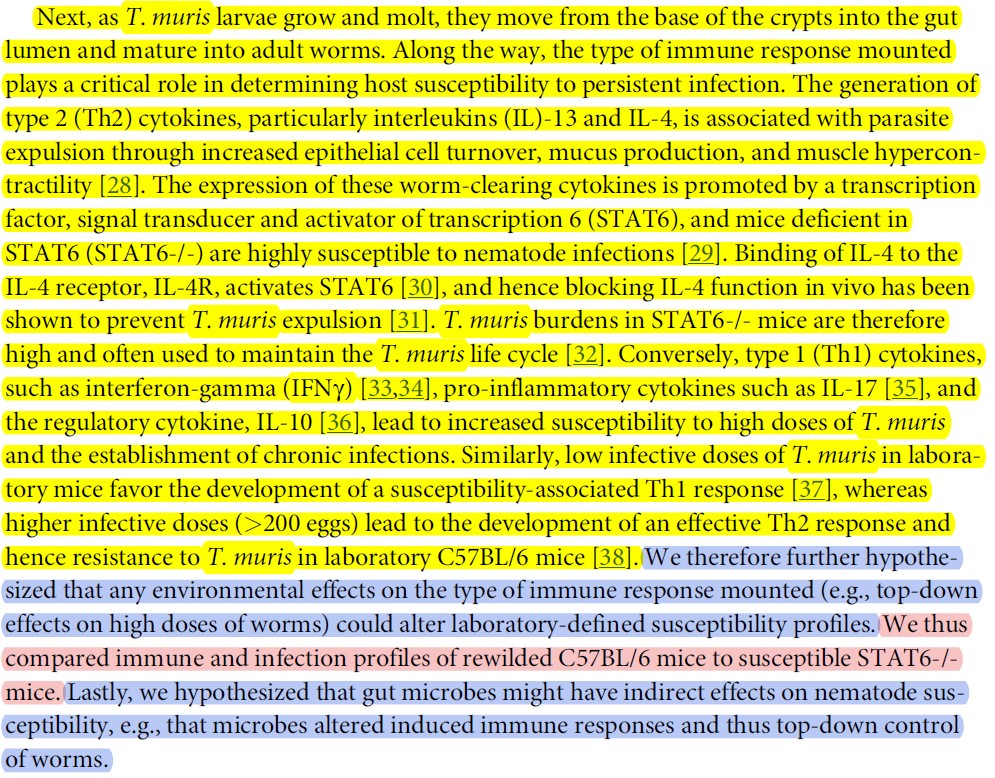
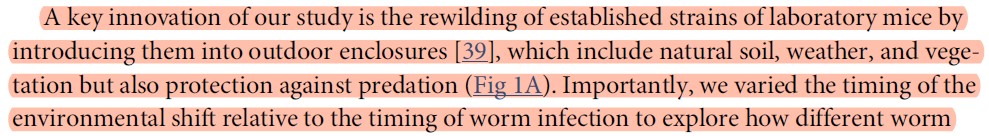
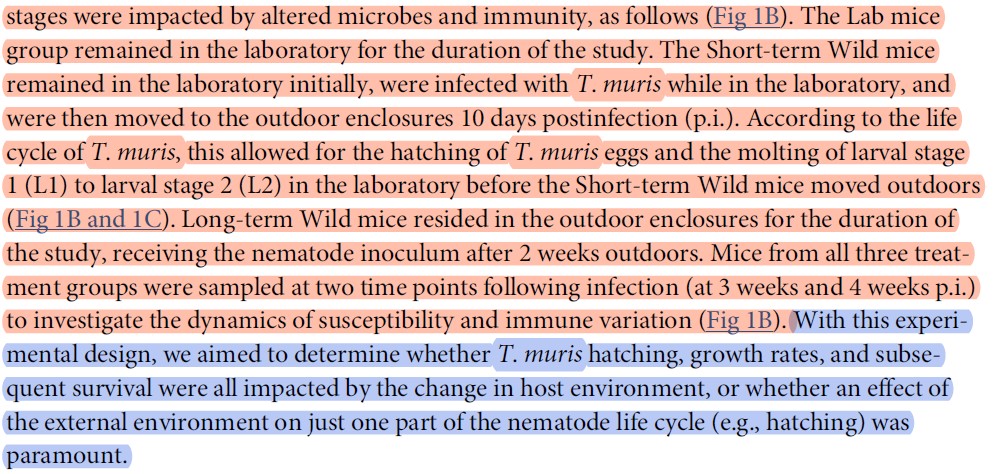
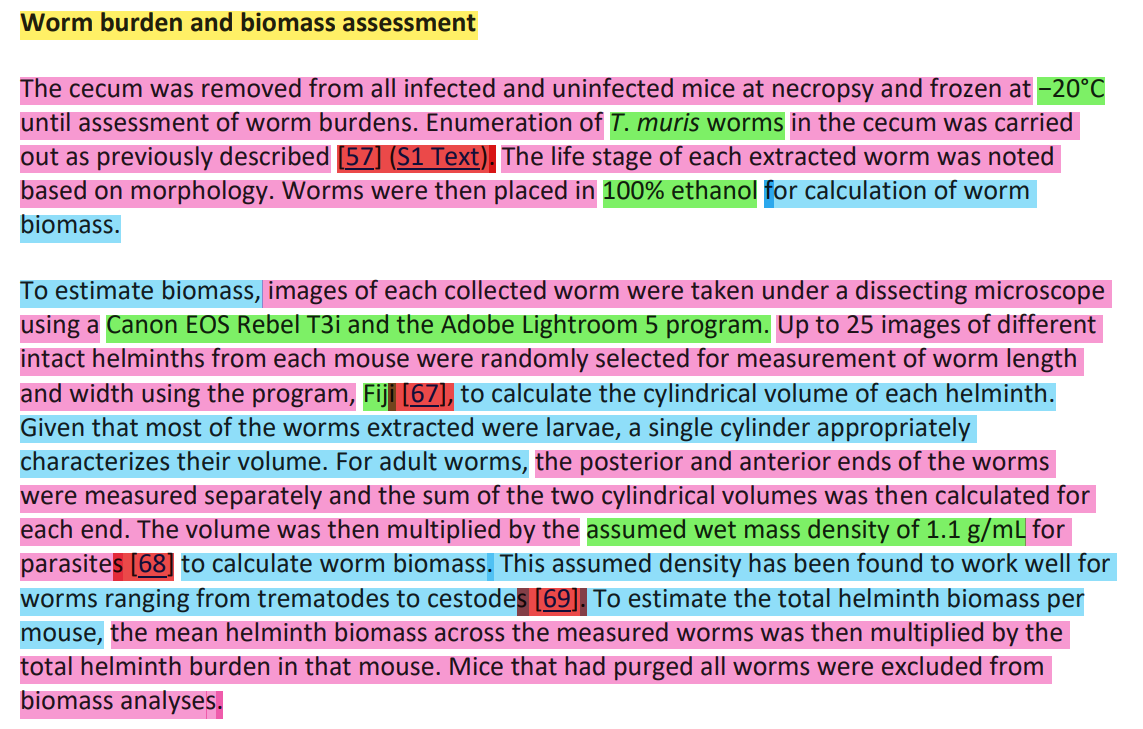
Click to read the full materials and methods section from a research article by Leung at al., (2018). The full reference is provided below. Take note of how these authors broke the methods and materials into subsections (e.g. describing the animal model and care, the types of experiments, how measurements were performed, and the statistical analysis that was used). We show three of the subsections of this materials and methods section below, highlighted to identify the different regions of the paragraphs.
EXAMPLE Materials and Methods Subsections (select paragraphs from paper)
Leung, J. M., Budischak, S. A., The, H. C., Hansen, C., Bowcutt, R., Neill, R., Shellman, M., Loke, P., & Graham, A. L. (2018). Rapid environmental effects on gut nematode susceptibility in rewilded mice. PLOS Biology, 16(3), e2004108. https://doi.org/10.1371/journal.pbio.2004108
DO:
- State any deviations from experiments described in the lab manual
- Describe the research protocol for experiments you completed that are not described in the lab manual
- Use the correct tense. Refer to this infographic.
- Include enough detail and information that your experiment is reproducible
- Explain which materials were used and how they were prepared (e.g. animal species, name and concentration of drugs used etc.)
- Describe what measurements were taken and how
- Explain how data analysis (e.g. statistical tests) was performed, if it was performed
DON’T:
- Give detailed descriptions of experimental design and procedures used if they are listed in the manual (you are permitted to reference the lab manual here)
- Use the same style and format in the lab guide provided to you. It is written in a step-by-step manner, which is useful for explaining detailed protocols in an undergraduate lab, but this format is not typically used when preparing a methods and materials section for a research article
- Just provide a list of the materials used
Results: Text
A written description explaining the results of the study, directly pointing the reader to the data by referring to the figures and tables (e.g. Figure 1 shows…). It can be divided into sections based on types of experiments or findings.
Each section of the results follows this structure:
- Purpose or background of experiment
- 1/2 to 1 sentence
- Experimental approach
- 1/2 to 1 sentence
- Results
- 1 to multiple sentences
- points to data (figure, table)
- states trend/patterns of data
- provides a brief interpretation of the data
What does ‘interpret’ mean in the context of the results?
- In the results, you will interpret the data by describing trends and patterns. You do not interpret what the data means outside of the experiment.
- In the discussion, you will interpret the meaning of the data in the context of the bigger picture
DO:
- Refer to every figure (and table, if applicable) in the results text
- Include units whenever you state a value
- Use quantitative rather than qualitative descriptions wherever possible
- Interpret the data by describing trends and patterns
- Use the correct tense. Refer to this infographic.
DON’T:
- Interpret the meaning of the data in the context of the bigger picture (e.g. by speculating or making conclusions)
- Describe results from another source
- You typically don’t reference to the work of others, but this depends on context
- Include excessive details on the purpose/background/experimental approach. Consider it a reminder; the reader can go back to the relevant section if more detail is needed.
- Include sample calculations. Refer to the assignment directions to see if and where these should be included.
- Describe what you think the results should have been
- Use the term “significant” in describing your data unless a statistical test was performed.
Results: Text Example
The example below is a sample of the results: text from Savory et al. (2011). Additional details regarding the highlighting are provided below the example.
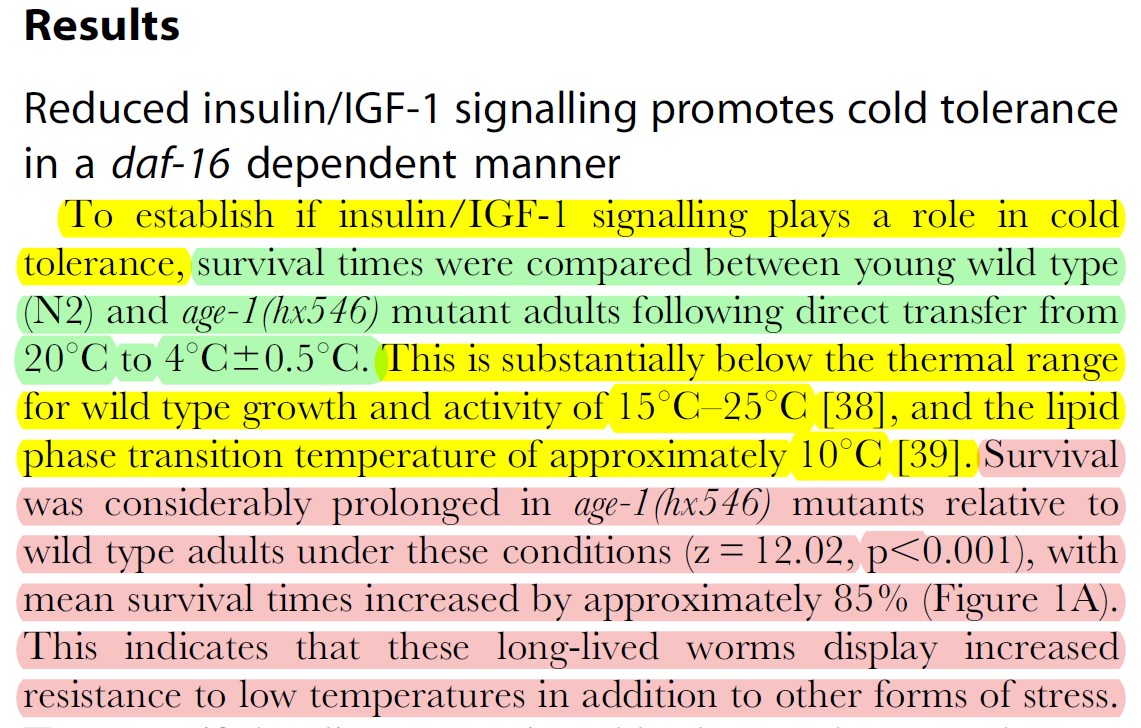
Purpose or background of experiment
- Determine if the insulin/IFF-1 signaling pathway is involved in cold tolerance
- Context provided on the temperatures that were used
Experimental approach
- measure survival time after transferring the animal model (nematodes) into cold
Results
- Points to data: figure 1A
- States trend/finding: survival time increased in age-1(hx546) strain compared to wildtype nematodes
- Provides a brief interpretation of the data: long lived worms have more resistance to low temps.
- Notice the authors aren’t explaining why the age-1(hx546) strain has more resistance to cold, or what is providing the resistance. That type of interpretation will be saved for the discussion.
Results: Figures and Tables
Figures and tables should summarize the important data. A reader should be able to look at your figure/table, read the figure caption, and be able to explain what the figure/table is showing and the trends without needing additional information. Figures can be diagrams, graphs or images.
Figure/Table Captions
Figures and Table captions should include a bold figure/table number (e.g., Figure 1 or Table I), a bold title, and enough of a description to understand what the figure/table is showing. A sentence or two on how the data was obtained will go a long way in the reader’s comprehension of the figure/table. Sometimes, especially for figures, trends and comparisons are described in the caption (this depends on the data presented). All of this (including the title) should be included in one concise paragraph. Captions go above tables and below figures. See the example figures below for more help.
What is the best way to communicate my results?
Before you begin preparing graphs and tables from your data, think about what you want to communicate and the best way for it to be communicated.
If you need help on deciding which type of graph is most appropriate for reporting your data, open this paper by Angra and Gardner (2016) and refer to figure 2: Summary of common graphs, their usage, advantages, and disadvantages.
Angra, A., & Gardner, S. M. (2016). Development of a framework for graph choice and construction. Advances in Physiology Education, 40(1), 123–128. https://doi.org/10.1152/advan.00152.2015
DO:
- Number and title every table and figure.
- Use separate numbering for tables (Roman numerals: I, II etc.) and figures (numerical digits: 1, 2, 3 etc.)
- Label axes and include units
- Avoid using colour in graphs unless absolutely necessary for clarity, this makes the graph more accessible to those who are colour blind. Instead of different colours, to differentiate different sets of data within a graph, use:
- different shades of the same colour
- symbols
- patterns
- Explain what the different shades/symbols/patterns represent. This can be explained in the caption or on the graph itself with a figure legend.
- If working with summary statistics (e.g. means), indicate the standard deviations (SD) or standard error of the mean (SEM) or 95% confidence intervals (C.I.) within the figure as error bars, and within the caption state the sample size(s) (e.g. N=3) and which type of error bars were used.
- If applicable, provide sufficient information regarding the statistical analysis for each figure within the caption (e.g. state the p- value that was used to determine significant differences between groups). Within the graph, indicate if there is a significant difference between group(s) using a symbol. If you are making multiple comparisons, you may use other symbols/methods for showing your comparisons (see graph example B and its caption)
- Images and diagrams can be in colour if needed (e.g. to ensure clarity)
DON’T:
- Put a title within a graph
- Use a title such as “blood glucose level vs. time”
- Write the coordinates of a point or the standard deviation on the plot beside the point on a figure
- Omit data that does not fit your expected result
- Use gridlines
- Put your caption in a text box – the red box in the examples below is for instructional purposes only.
Figure Examples
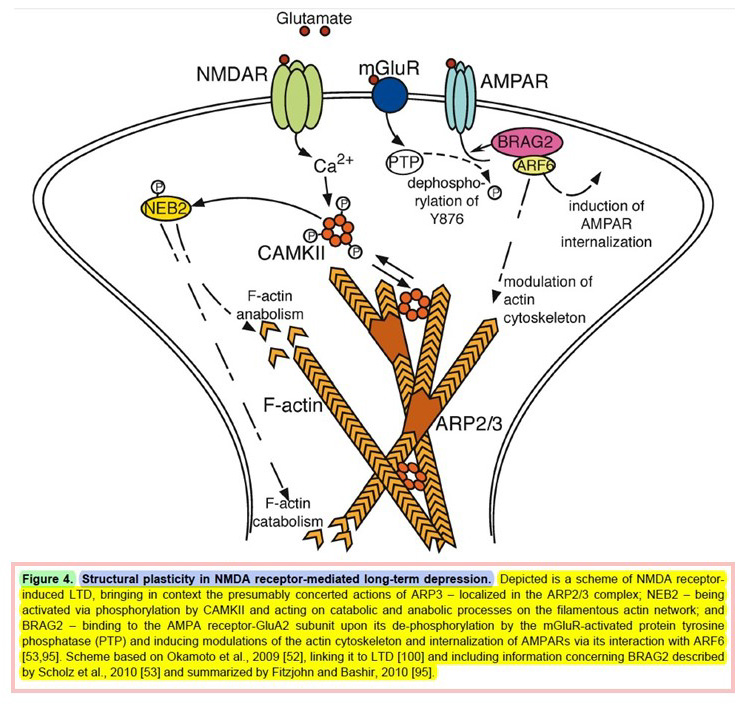
Example 1: Diagram
What is the figure….
Caption: everything within the red box
Number: green highlight
Title: blue highlight
Description: yellow highlight
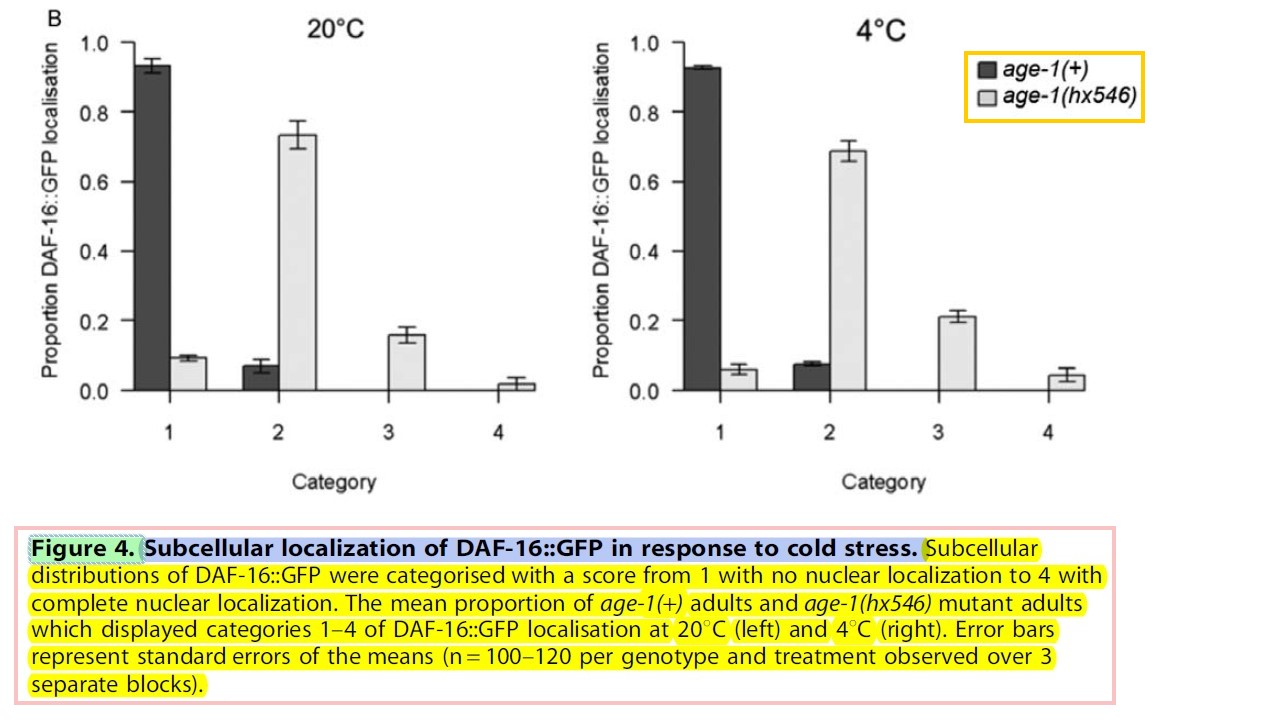
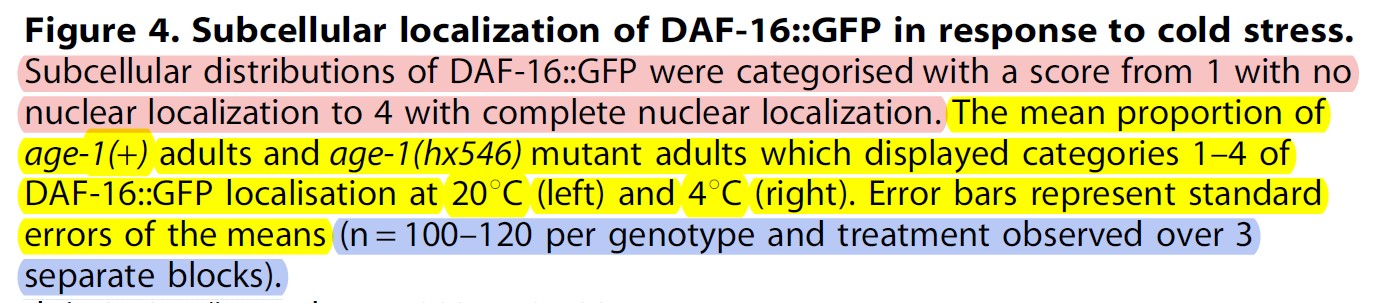
Example 2: Graphs
What is the figure….
Caption: everything within the red box
Number: green highlight
Title: blue highlight
Description: yellow highlight
Legend: orange box
- The part of the figure where you define any symbols or other visual markers (e.g. patterns) that appear. Legends are placed within the graph and must be legible and clear
- This legend is not always needed, it will depend on the figure and the author’s preference.
- For example, in graph example A, different shades are used to distinguish which bars belong to the two nematode strains used in the study [age-1(+) and age-1(hx546)]. These shades are defined in a legend. Sometimes this information is described with words in the caption instead. Ultimately, you want to pick the method that communicates information clearly and concisely.
Graph Example A
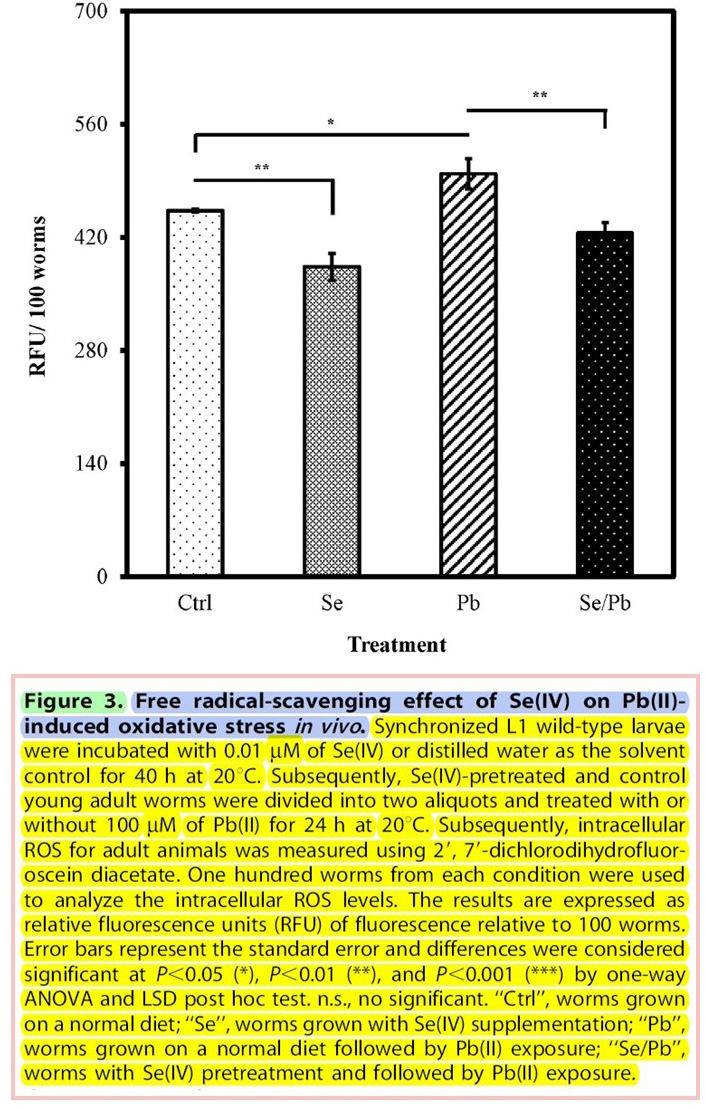
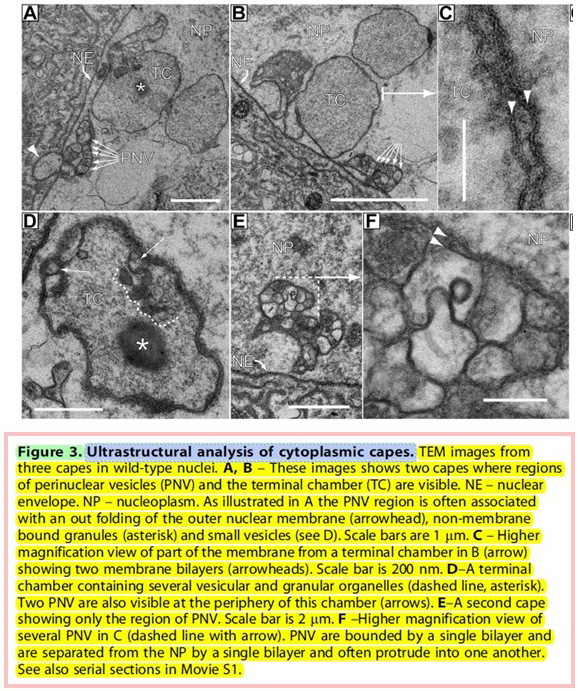
Example 3: What goes in the description of a figure caption?
Red: Description of how data was obtained
Yellow: How data is being presented in graph and what the error bars represent
Blue: Sample size indicated
Orange: How statistical analysis was performed/is indicated in graph (if applicable)
Caption Example A
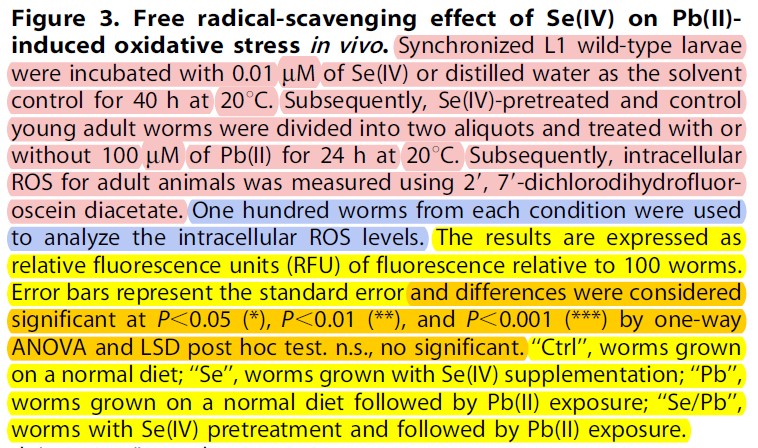
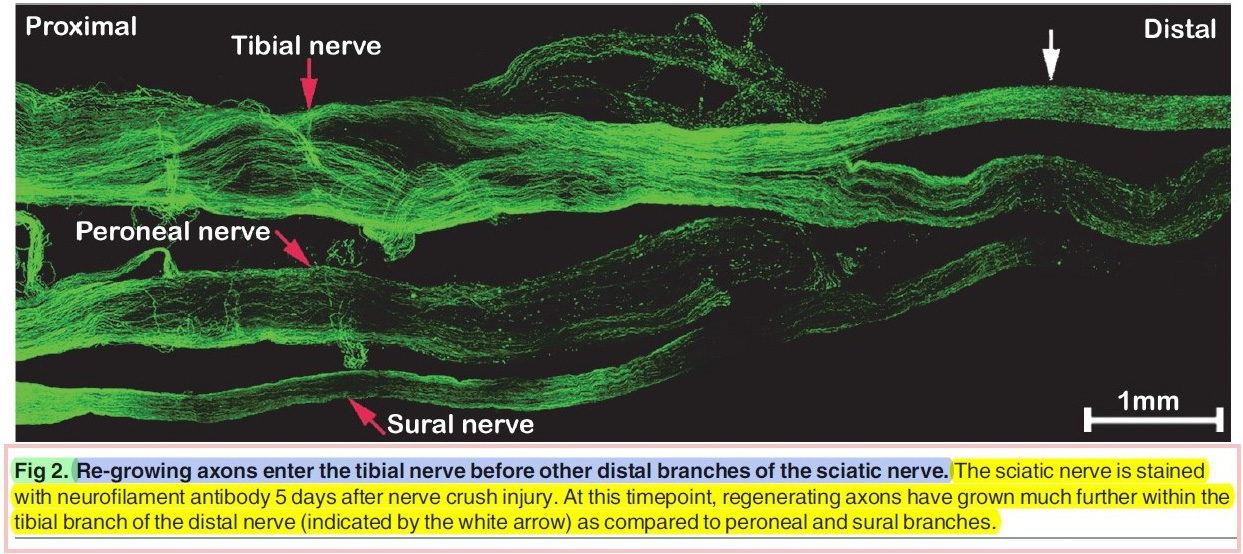
Example 4: Image
What is the figure….
Caption: everything within the red box
Number: green highlight
Title: blue highlight
Description: yellow highlight
Panel: Each image within the figure may be referred to as a panel. In example A, there are 6 panels. In example B, there is 1 panel.
Panel:
- Each image within the figure may be referred to as a panel.
- In image example A, there are 6 panels.
- In image example B, there is 1 panel.
Annotations:
- Scale bar (indicate size directly over the bar, or within caption)
- provide both the objective magnification used to capture the image (either within the image or the caption) and a scale bar.
- Each panel has different types of annotations to identify key features: arrowheads, arrows, dashed lines, text, or the full name of the structure. All of these are acceptable ways to annotate. Additional details about these annotations can be further described in the figure caption if appropriate.
Discussion
The discussion is the portion of the paper where the data is analyzed for scientific meaning and the significance, if any, to the body of knowledge in the area of study. You should be able to relate everything in your discussion (e.g., terms, concepts, previously published results) to your own results.
Clearly and directly state what you think the data shows and explain why. To do this you will have to refer to the scientific literature on the topic.
Whenever you explain a concept you should refer to a piece of data from your experiments to illustrate the point. If you can’t, you probably should not be discussing this concept.
Note: Do not use your entire discussion to explain the limitations of the experiment or to explain why your data may be wrong because of experimental error. Only discuss experimental issues if it is relevant to the findings. Spending too much time on this sort of discussion indicates to the reader (i.e. the person marking your report) that you did not understand the purpose of the lab and did not read or understand the appropriate background literature.
In general, the format should be as follows:
- 1st paragraph:
- State key findings and what they mean with respect to your original question
- Middle paragraph(s):
- Explain how findings fit into what is known in the field, and describe any limitations to the study or unexpected findings
- Final paragraph:
- Summarize and indicate overall significance of the findings (i.e. state a conclusion)
As you will see in the example below, and in many other pieces of literature you’ll read, this paragraph structure is not always fixed – it is simply a starting place for you in your writing. The stating of key findings and how they fit in to the field may blur across paragraphs in published literature, and there may be many more paragraphs in a publication that introduces a lot of new findings. In your discussions from lab activities in this course, you won’t have so many paragraphs, because your experiments all fit into a 3-hour lab period – most published research is the culmination of hundreds (perhaps even thousands) of research hours, and tends to result in a larger number of things to discuss than a single 3-hour lab period will. The trend that does stay the same throughout almost all primary research is the final summary paragraph that notes significance (and frequently, future directions).
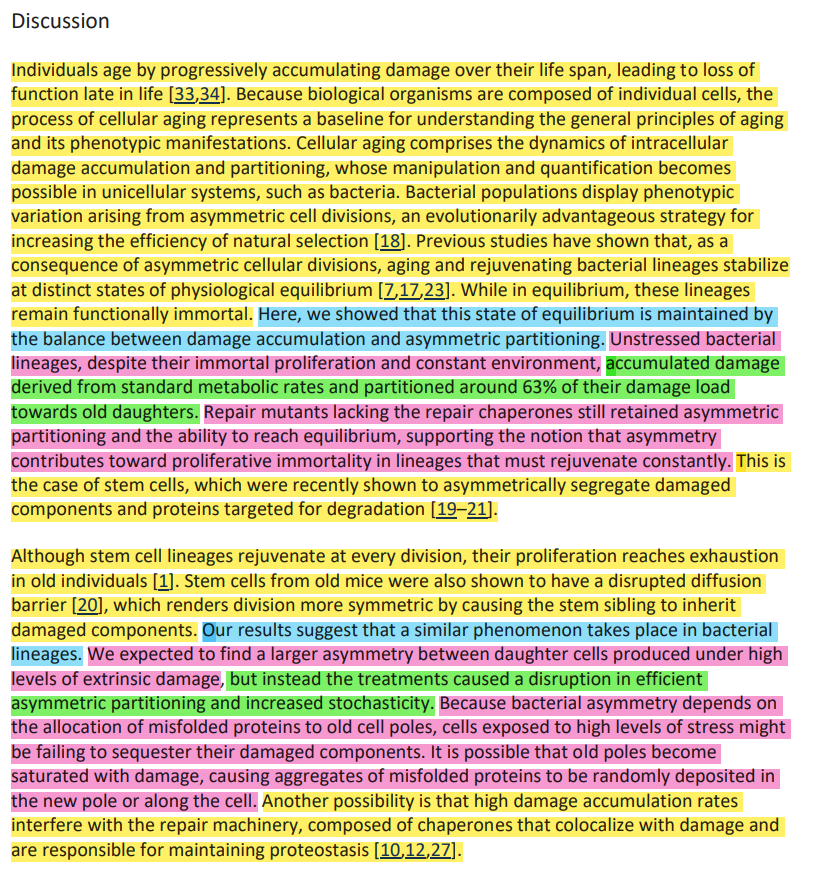
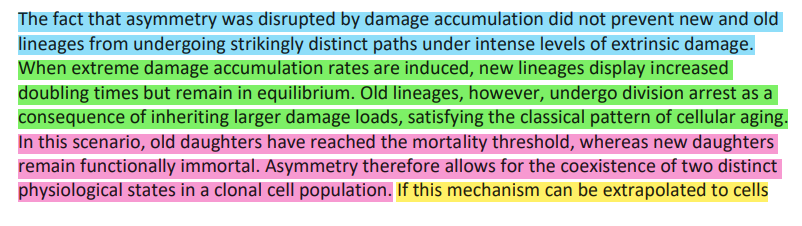
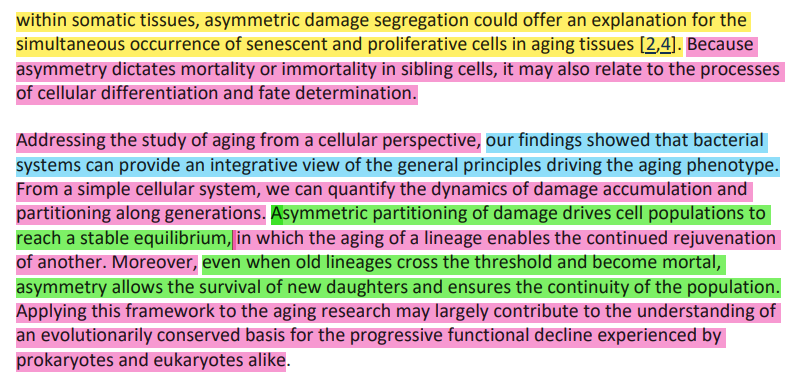
Example Discussion 1
Proenca, A. M., Rang, C. U., Qiu, A., Shi, C., & Chao, L. (2019). Cell aging preserves cellular immortality in the presence of lethal levels of damage. PLOS Biology, 17(5), e3000266. https://doi.org/10.1371/journal.pbio.3000266
MORE EXAMPLES
Refer to the discussion examples provided in Writing In the Biological Sciences (Hofmann, 2019)
Hoffman, A.H., Writing in the biological sciences. (2019). New York, NY: Oxford University Press. pp. 111-139.
DO:
- Cite external references
- Briefly summarize your results
- Compare your values to those found in the literature
- Explain why your values may be different from your hypothesis or those previously published
- If you are explaining differences in terms of limitations of the experiment, refer to specific data and briefly suggest how improvements may be made
- Try to think of physiologically relevant explanations for your data (using references)
- Expand on topics covered in the introduction and relate them directly to your own results with references to support any conclusions/statements
- Use the correct tense. Refer to this infographic.
DON’T:
- Simply repeat concepts explained in the introduction. You may expand on some concepts and relate them to your own results.
- Draw conclusions not directly supported by your data
- Explain the materials and methods in great detail
- Explain data simply by stating “experimental error”, this implies a lack of thought on your part
References
Use the most recent version of the American Psychological Association (APA) style when preparing your references.
You will need to provide both in-text citations in the text of your lab report, (e.g. introduction, discussion), and the full reference at the end of the report in the ‘references’ section.
In general, you should try to cite peer reviewed literature and not lecture notes for assignments and academic work at a University. Since scholarly work (e.g. primary research articles and review articles) are typically written by experts in the field and have been peer reviewed by other experts, the source of information has greater authority and accuracy. This increases the strength of your writing. In addition, it provides you opportunities to practice using databases to find scholarly sources. Refer to the CRAAP criteria to help you assess your sources of information.
If you are providing introductory background information on a subject, review articles are a good choice. If you can’t find a relevant scholarly source, it is permissible to use a textbook. There are some good (and free) open source texts available. However, remember that it is better to cite a scholarly article (review article or primary research article) when one is available and to minimize citing textbooks. To find scholarly articles, try searching using the databases that are available to you as a McMaster student, such as PubMed, Web of Science or Google Scholar.
You may use as many references as you like, but they must be relevant. There is not a minimum number required. For an undergraduate lab report, 2-3 references for the introduction and an additional 2-3 references for the discussion would likely be appropriate. Provide references in the other sections of your lab report if appropriate (refer to the information under those sections in this guide for details). Regardless, you must always cite any information or ideas that are not your own, otherwise you are plagiarizing the work of others which is a type of academic dishonesty. We cover plagiarism and academic dishonesty under the Academic Integrity section of this ebook.
If you are using citation management software (e.g. Zotero) to track and generate your citations, it is still your responsibility to ensure the citation is correct, including the format. If the citation information has been entered incorrectly by the authors, the software will not generate the citation correctly. You can also refer back to the citation management software section of this ebook.
How To Cite and format In-Text References Using APA Style:
Refer to the links below from the OWL Purdue guide for full details on formatting in-text citations:
DO:
- Reference every statement in a paragraph if necessary
- Reference any information or ideas that are not your own
- Paraphrase correctly. It is still plagiarism if you copy word for word from a source, or just change a few words around, even if you include a reference.
- Use these resources to help you with paraphrasing:
DON’T:
- Use quotes. In general, direct quotes are rarely used in scientific writing. Instead of using direct quotes, you need to paraphrase the work/ideas of others.
How to Format your Cited References in the Reference Section:
Refer to the links below from the OWL Purdue guide for full details on formatting the reference list at the end of the report:
Basic Rules
Articles in Periodicals (e.g. review articles, primary research articles)
DO:
- Follow the directions from OWL Purdue using the links provided above
- Include the digital object identifier (DOI) in the reference if available. Otherwise, include the URL.
DON’T:
- Reference the lab manual, unless you are explicitly told to do so in this guide or the assignment instructions.
- Reference lecture notes (these are not published).
- Use footnotes or endnotes
Appendices
If needed, the appendix or appendices are included in the lab report after the Reference section.
This section would be similar to ‘supplementary information’ that authors sometimes include when publishing research articles (e.g. raw data, additional images, protocols etc.)
You will be instructed on what to include in the appendix (if anything) in the instructions for the specific assignment.
Other things you should know
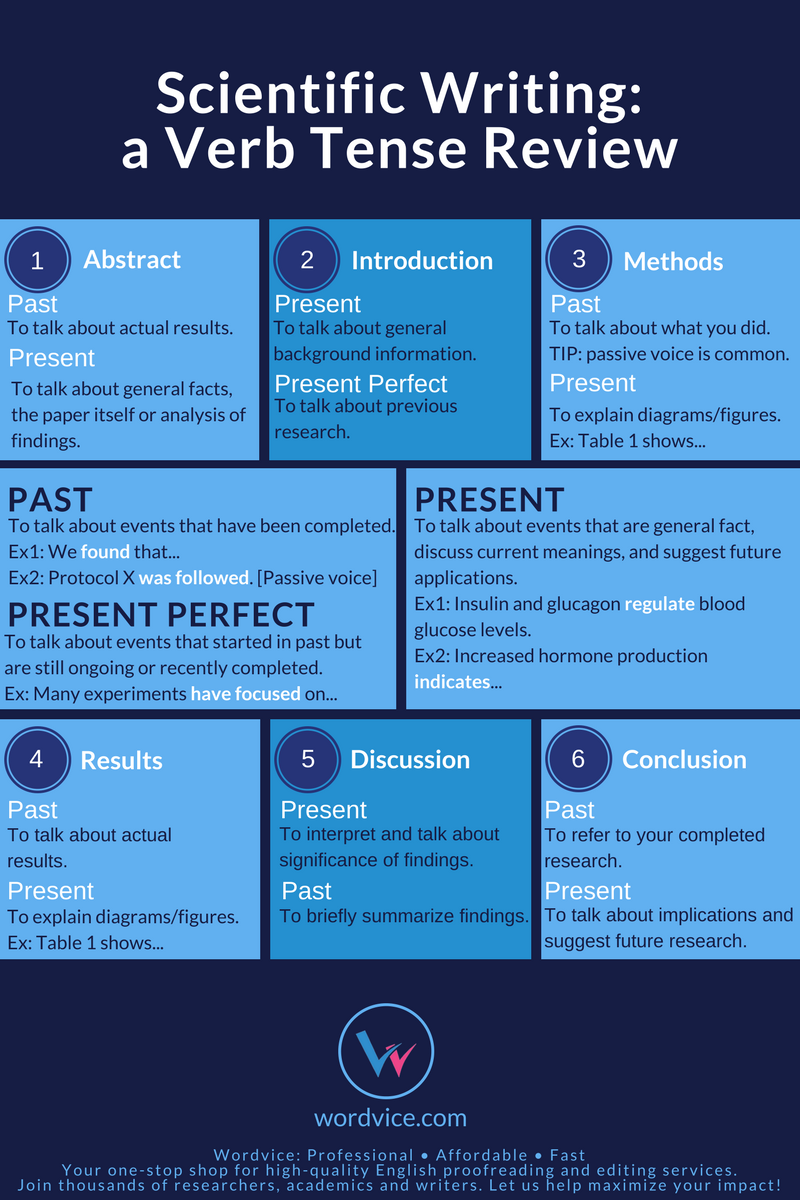
- Refer to the infographic from Wordvice for help selecting the correct tense for each section of the report.
- Some very good advice on effective writing in science from Nature Education is discussed in detail in this article
- The article describes the use of past, present and future tense, and provides more context on the use of active vs. passive voice, and how this can provide more clarity when writing
- Do not put quotes around, bold, or underline a word or phrase to emphasize it
- Do not use the term “significant” in describing your data unless a statistical test was performed
- Use only very common abbreviations (DNA is ok, TRI for triglycerides is not) and the first time you use an abbreviation, include a full description in brackets beside it. e.g…….triglycerides (TRI)…..
To Make Your Paper Really Professional (and impress your T.A.)
- Make sure your text is logical and well thought out and flows from one paragraph to the next
- Be scientifically rigorous in your arguments
- Use statistical tests on your data to determine their significance
- Draw deeper comparisons of the data than was asked for and give a thorough comparison to the literature.
CRAAP Criteria
Currency
- When was it written and last revised?
- Does it matter how old the content is?
Relevancy
- Does it relate to my topic?
- Who is the intended audience?
- Have you looked at a variety of sources before deciding which to use?
Authority
- Who wrote this? What are their credentials?
- Is the author qualified to write on this topic?
Accuracy
- Is the information supported by evidence?
- Can the information be verified?
- Has the information been reviewed or refereed?
Purpose
- Is the information meant to teach, entertain, persuade, or sell an idea?
- Does the information acknowledge other perspectives?
Summary of Verb Tense in Scientific Writing
Wordvice. (n.d.). Scientific Writing: A Verb Tense Review. https://wordvice.com/which-verb-tense-to-use-in-a-research-paper/