Chapter 25 ~ Urban Ecology
Key Concepts
After completing this chapter, you will be able to:
- Explain the factors that allow cities to exist and support their human population.
- Describe recent trends of rapid urbanization.
- Describe the structural and functional characteristics of the urban ecosystem.
- Define the concept of an ecological footprint.
- Explain the essential elements of urban planning and how it has affected land-use in Canadian cities.
- List the major kinds of urban pollution and describe their causes and recent trends in Canadian cities.
- Describe the methods of waste management.
- Compare the management of solid waste and sewage among Canadian cities.
- Explain the major elements of urban biodiversity and how it can be better managed through the naturalization of habitats.
Introduction
The Development of Urban Areas
Urban areas are cities, towns, and other places where people live in a compact population. Most urban people are engaged in economic activities that function efficiently in dense populations, such as commerce, education, manufacturing, and services. In contrast, resource-based economic activities, such as cultivating food and harvesting minerals, fossil fuels, timber, or wildlife, occur primarily in rural areas.
Urban areas import energy, food, and materials from the local countryside, as well as from more distant regions of their country, in addition to other nations around the world in an increasingly global commerce. The resource-related connections between cities and rural areas exist at all spatial scales (local, regional, and global) and are an integral but often insufficiently appreciated aspect of urban ecology.
The development of dense habitations (initially small villages) during human cultural evolution began about 10-thousand years ago, when early agricultural practices allowed the production of local surpluses of food (harvests that exceeded the subsistence needs of the farmers themselves). The excess food encouraged the development of specialized occupations that were most efficiently performed in a central place such as a village or town. New societal activities included organized religion and political systems, artisanal manufacturing, and the means of administering these over wide areas through hierarchical economic, political, religious, and military structures.
The first villages were probably supported by both settled agriculture and local hunting-and-gathering activities. By about 9,000 years ago, small farming villages were relatively widespread in some regions, particularly in the Fertile Crescent of the Middle East (see Chapter 24). By 8,500 years ago, that region boasted sizeable walled towns. Similar developments also occurred in China and probably elsewhere in southern Asia.
From these humble beginnings, urbanization of the human population has proceeded apace, and especially rapidly during the past century. Only about 2.5% of the human population lived in towns and cities in 1800, and 5-10% in 1900. Today, about half of the human population lives in urban places, and this is predicted to rise to two-thirds by 2025 (or about 5 billion people). About 90% of this increase in urban populations will occur in less-developed countries (see Chapter 10). Globally, the urban population is now growing about four times as quickly as that of rural areas, largely because of the migration of huge numbers of people from the countryside to built-up areas.
In Canada, about 20% of the population lived in towns and cities in 1871, increasing to 38% in 1900, 63% in 1950, and 81% in 2011 (of which 45% live in cities larger than 750-thousand people; Chapter 11).
In 1750, few cities supported more than 50-thousand people – London was the only one in England, and there were none in North America. In 1830, New York and Philadelphia were the only American cities with a population greater than 100-thousand. By 1910, however, 52 cities in North America supported more than 100-thousand people (New York was the largest, with more than 1 million). In 1950, New York and Tokyo were the only two megacities in the world (that is, having a population greater than 10 million). In 2014, there were 537 cities supporting more than 1 million people, including 35 megacities, of which 29 were in the developing world (Brinkhoff, 2015). The largest megacities are listed in Table 10.5.
No effective discussion of urban population policies has occurred in any country. Consequently, no population policies exist for urban areas in Canada or elsewhere. The key issues are how large should cities be in order to provide people with safe and clean places to live, while also supplying the goods and services that urban areas can deliver most effectively? If the largest cities are considered overpopulated, how can continued population growth be discouraged? Can people be encouraged to move to smaller centres? These and other questions related to urban population policies are extremely controversial, but all will have to be addressed.
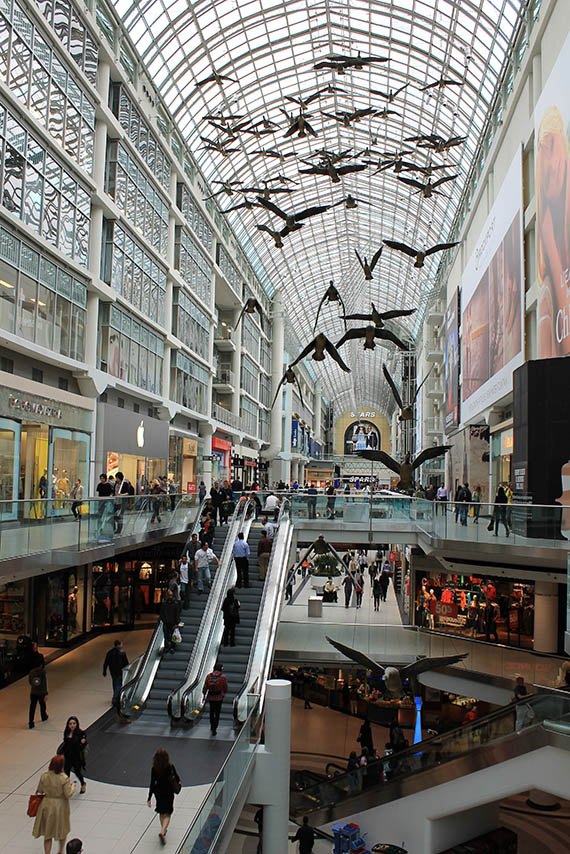
Image 25.1. Urban environments are highly artificial. This shopping atrium in Toronto has semi-natural light, an atmosphere that is temperature-controlled for comfort, some potted plants (all tropical species), a flock of fibreglass Canada geese, and an overall ambience that is contrived to stimulate consumerism. Source: B. Freedman.
Urban Ecosystems
Any urbanized area can be viewed as being an ecosystem, because it has the following ecological attributes:
- a need for enormous inputs of energy and materials to sustain its human population and its diverse economic activities, and to maintain its structure and grow
- a complex metabolism, including well-developed webs of transfer, processing, and storage of materials, energy, and information among interacting organisms and economic sectors
- and immense outputs of heat and other waste materials, which are disposed of in surrounding ecosystems, causing pollution and other environmental problems
Of course, the habitats of cities and towns are very strongly influenced by human activities. Collectively they comprise an urban–industrial techno-ecosystem (Chapter 8). The structure of this anthropogenic ecosystem is dominated by the businesses, dwellings, factories, roads, and other infrastructure of the human economy, while also supporting manicured green space as well as remnants of natural habitats in parks and other less-developed spaces. Although humans are the dominant species in the urban ecosystem, many other species are also supported, most of which are not native to the region. Important ecological functions also occur within the urban ecosystem, such as biological productivity and water and nutrient cycling, but these processes are greatly influenced by humans.
All urban areas are intrinsically dependent on surrounding ecosystems to provide them with necessary resources and to assimilate wastes that are generated. The ecological footprint (or eco-footprint) of an urban population is the area of ecoscape (landscape and seascape) that is needed to supply the necessary food, energy, materials, waste disposal, and other crucial goods and services. As a global average, the average human has an eco-footprint of about 2.7 hectares, but there are only 1.8 ha of bio-productive land and water on Earth (Ewing et al., 2010). This means that the human enterprise has already overshot global bio-capacity by 30%, and is now operating on an unsustainable basis by depleting the remaining stocks of “natural capital”. Note that, in the context of ecological footprints, these data are measures in “global hectares” (gha), which represent the average productivity of all bio-productive habitats on Earth or in a country, including agricultural land, forests, and fishing grounds, but not including desert, glaciers, or the open ocean.
An average Canadian has an ecological footprint of about 7.3 global hectares (2007 data; Ewing et al., 2010). This is the seventh-most intensive national per-capita footprint in the world, after the United Arab Emirates (10.7 gha), Qatar (10.5 gha), Denmark (8.3 gha), Belgium (8.0 gha), the United States (8.0 gha), and Estonia (7.9 gha).
Here are some additional comparisons among wealthier countries: Australia (6.8 gha), Kuwait (6.3 gha), Ireland (6.3 gha), Norway (5.6 gha), France (5.0 gha), Germany (5.0 gha), United Kingdom (4.9 gha), and Japan(4.7 gha). The rapidly-growing economies include Russia (4.4 gha), Brazil (2.2 gha), China (2.2 gha), and India (0.9 gha).
Of course, people living in poorer countries have much smaller ecological footprints: Afghanistan (0.6 gha), Bangladesh (0.6 gha), Haiti (0.7 gha), Burundi (0.9 gha), Ethiopia (1.1 gha), Vietnam (1.4 gha), and Peru, (1.5 gha).
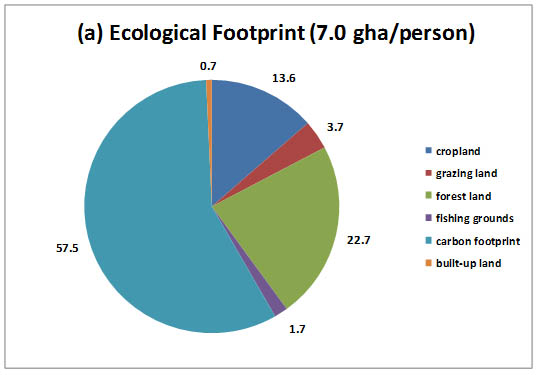
The major influences on the differences in these ecological footprints are related to the intensity of energy and material use and waste production within the national economies. The per-capita ecological footprint of Canada is about 7.0 global hectares per person, while the bio-capacity is 14.9 gha (Figure 25.1). The major elements of the footprint are related to emissions of carbon dioxide (a greenhouse gas; this is known as the “carbon footprint”) and activities associated with harvesting or otherwise damaging forests and engaging in agricultural and fishing activities. The major contributions to bio-capacity are ecosystem services related to Canada’s extensive areas of forest, agricultural land, and fishing grounds. Overall, the bio-capacity of Canada is about double the ecological footprint.
Figure 25.1. The Ecological Footprint of an Average Canadian. The data are in percentages, based on the relative contribution of each category to the (a) per-capita ecological footprint or (b) the bio-capacity of Canada. The data are related to the area of bio-productive habitat that is needed to provide resources and to assimilate waste products. Note that the data for the carbon footprint are the hectares needed to provide fossil-fuel CO2 offsets, such as the area of forest whose productivity compensates for the energy content of an amount of fossil fuel used, or that fixes atmospheric CO2at a comparable rate. Source: Data from Ewing et al. (2010).
Based on the Canadian national footprint of 7.0 gha, the ecological footprints of Canada’s five largest cities (population data from Table 11.4) are the following (data are in millions of hectares):
-
- Toronto 39.1
- Montreal 26.8
- Vancouver 16.2
- Ottawa-Hull 8.7
- Calgary 8.5
These footprints are about 71 times larger than the actual areas of these cities. Without such enormous regions to draw upon for resources, these and all other urban areas would be unable to survive.
The Organization of Cities
Urban Planning
Urban ecosystems have extremely complex structures and functions (although not more so than natural ecosystems). To some degree, their development has occurred in an orderly fashion, with certain areas being designated for particular kinds of structures and activities. Urban planning is the active process of designing and organizing the structure and function of cities. As such, urban planning contributes to the information needed by legislators and other decision makers as they develop sensible and efficient siting of the following:
- buildings, including homes, commercial properties, institutions (such as hospitals and schools), and industrial facilities
- infrastructure for transportation, utilities, and waste management, such as roads, railways, public-transit routes, electrical transmission and pipeline corridors, sewers and sewage-treatment facilities, and solid-waste disposal areas
- greenspaces, including playing fields and horticultural and natural-area parks
Well-planned urban areas have relatively pleasant neighbourhoods where people live and work. In contrast, poorly planned cities are chaotic, dirty, and unpleasant. In general, urban planning is most effective in wealthy developed countries such as Canada, but much less so in poorer developing countries where the population is growing and urbanization is proceeding most rapidly.
The dominant planning paradigm of the past 60 years has involved the segregation of major land-uses and economic activities into different areas. This kind of strategy has greatly influenced the design of modern cities, including all those in Canada. It has resulted in many urban people living in discrete inner-city neighbourhoods or more distant suburbs, while shopping in large malls, working in factory or office complexes and industrial parks, and commuting long distances among these land-use types. However, this type of planning has contributed to some important urban problems, including the following:
- the rapid growth of huge, multi-city, urbanized regions (sometimes known as conurbations)
- the inefficient segregation of residences from places of work and commerce
- long commuting times for workers
- congested transportation systems
- a decay of neighbourhood life
- environmental problems such as air and water pollution, wasteful use of energy and materials, paving of valuable farmland (many urban areas are located on excellent agricultural land), and losses of natural habitat
Some of these issues are examined in more detail later in this chapter.
The paradigm of widely segregated land-use is now being challenged by the concept of a more integrated “neighbourhood” design. This involves the development of relatively compact, self-sufficient communities that contain a mixture of residential and commercial land-uses. In some respects, this harkens back to more traditional elements of community design, in which housing, employment, local commerce, small-scale manufacturing, and recreation were all within easy walking distance. The re-emergence of this concept in urban planning has been substantially influenced by the ideas of Jane Jacobs, a geographer who taught at the University of Toronto.
Urban Land-Use
Urbanized areas cover about 20 000 km2 of Canada, only 0.2% of the total land. Canada is, nevertheless, a highly urbanized country because 81% of its population (about 22 million people) lives in cities and towns.
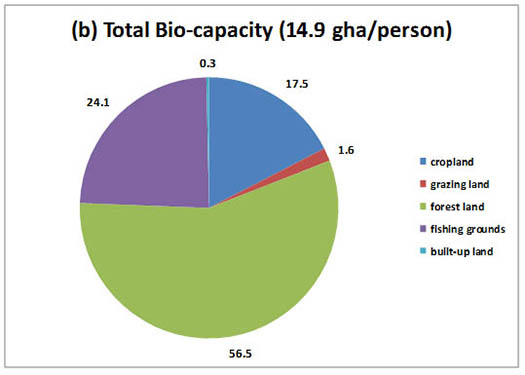
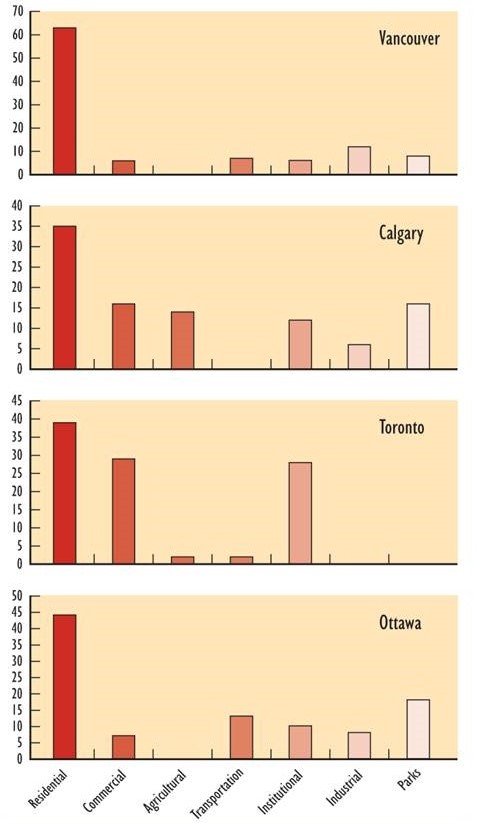
Although patterns of land-use vary among cities in Canada, the dominant uses are for residential, commercial, industrial, and transportation purposes (Figure 25.2). As such, urban areas are mostly occupied by: single-family homes, duplexes, and apartment buildings; commercial, industrial, and institutional buildings; parking lots and paved roads; and other built structures. Non-paved areas are mostly grassy lawns. All of these urban “habitats” are highly anthropogenic in character – they are, after all, places where large numbers of people live, work, and play. Some urban greenspaces also contain habitat for elements of native biodiversity, as we examine later.
Figure 25.2. Land-Use in Some Canadian Cities. The data show the percentage distribution of land-use in 1995. Note that the cities do not all report comparable units: Vancouver and Ottawa do not report agricultural land, and Toronto includes parks in institutional use. Source: Data from National Round Table on the Environment and Economy (1998).
Environmental Issues 25.1. Urban Sprawl Canadian cities are growing rapidly for two reasons: (1) most immigrants prefer to live in urban areas, and (2) there is immigration from rural districts. Both of these groups are seeking economic opportunities, as well as the cultural and lifestyle benefits of living in large centres. In any event, because of the rapid population growth, urbanized areas are spreading into adjacent rural habitats, a phenomenon known as “urban sprawl”.
All cities and towns in Canada are located on land that was formerly occupied by natural ecosystems. However, much of the sprawl that is occurring today involves the conversion of agroecosystems into urbanized areas. When the agricultural land is lost, there is a depletion of the ability of the landscape to provide food. This is an important problem in parts of southern Canada, where much of the highest-capability land in the country is being converted into residential and commercial uses of cities.
Urban sprawl is also a threat to natural habitats, particularly in areas that sustain rare ecosystems. For example, the area around Victoria is the only place in Canada where dry forest dominated by Garry oak (Quercus garryana) occurs. This is habitat to many rare species and is one of our most endangered natural ecosystems. The expansion of residential areas is the greatest risk to this coastal oak forest. Conservation agencies in government and the private sector, including the Nature Conservancy of Canada, are trying to protect the surviving patches of this rare forest.
Urban sprawl can also be a threat to the ability of landscapes to provide key environmental “services,” such as clean water. One such case involves an area known as the Oak Ridges Moraine, which has become a rallying point for habitat protection against further urbanization in the Greater Toronto Area. The moraine is a 160-km-long, 1950-km2 ridge located north of the city, and it is composed of hilly terrain underlain by glacial sand and gravel. Because of its rough topography and poor fertility, much of its area has remained forested or is used for pasture or other low-intensity agricultural purposes. Groundwater originating in the moraine is a source of well-water recharge for about 250-thousand people and is a source of 65 rivers and streams and many wetlands. However, with the rapid growth of the greater Toronto region, the moraine has been subjected to increasing pressure from residential and commercial development. Extensive clearing of its forested and pasture areas would degrade the ability of the moraine to provide clean groundwater for use by people and to support streams and wetlands. Loss of the remaining forest would also destroy habitat for native species that are rare in the region.
In response to intense lobbying from groups seeking to limit new developments on the moraine, the Government of Ontario formed an advisory panel to provide advice about the regulation of land-use. The panel provided many recommendations, including the need to protect 92% of the moraine from intensive development, and these were key in the preparation of The Oak Ridges Moraine Conservation Act, 2001. The Act was used to prepare a land-use plan, including provisions for core natural areas and linkages among them, comprising about 62% of the moraine. In 2002, the premier of Ontario announced the formation of a non-profit Oak Ridges Moraine Foundation and provided it with $15 million to fund public education, monitor the moraine, develop trails, and secure natural habitats. The federal government also announced that land it owns on the moraine, about 30 km2, would be kept as greenspace. In addition, the Nature Conservancy of Canada has been acquiring properties of high conservation value and is setting them aside as protected areas.
These are positive actions, although there is still pressure from some landowners to allow more residential and commercial development in the area. Fortunately, however, these pressures have mostly been resisted and there is continuing progress in the conservation of greenspace in the Oak Ridges Moraine.
Urban Transportation
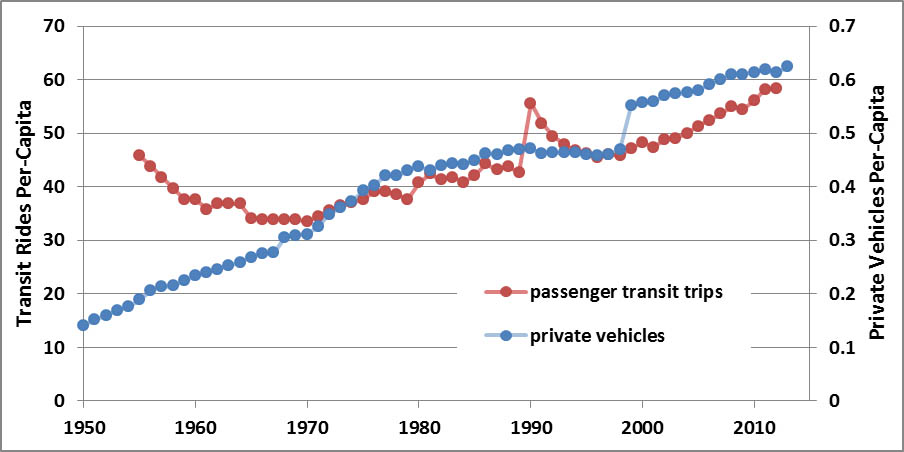
All urban areas have complex systems for moving people and goods. The physical infrastructure for transportation includes roads, parking lots, railroads, subways, airports, and water routes, plus the many kinds of vehicles that operate on these corridors. From the turn of the twentieth century to the 1950s, public transit systems were the most commonly used means of longer-distance personal transportation in Canadian cities. Public transit is still an important means of transportation in cities, although its growth is moderate and not nearly as impressive as that of automobile use (Figure 25.3).
Figure 25.3. Changes in Urban Transportation in Canada. The data show the trends in the use of urban transit systems and in automobile ownership. The jumps in the data series in certain years reflect changes in the ways that the data were reported. Source: Data are from Statistics Canada (2006, 2014) and APTA (2014).
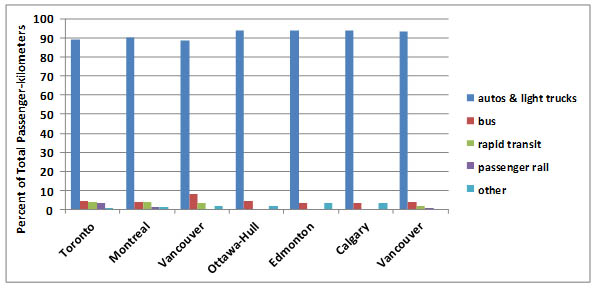
Most urban transportation involves the use of motorized vehicles (Figure 25.4). On average, about 93% of passenger-kilometres are travelled by private vehicle (car or light truck), and only 4%, by bus; 3%, by rapid transit and rail; and less than 1% by other means (such as bicycles). About 75% of trips are made by car or truck; 14%, by public transit; 10%, by walking; and 1%, by bicycle. In general, larger cities have a better developed infrastructure for public transit. For example, in Metropolitan Toronto, 65% of total trips are by automobile or small truck, 30%, by public transit, 4%, on foot, and 1%, by bicycle (NRTEE, 1998).
Figure 25.4. Means of Transportation in Some Canadian Cities. Data are for 1995 and are the percentages of the total passenger-kilometres travelled within the various cities. Source: Data from National Round Table on the Environment and Economy (1998).
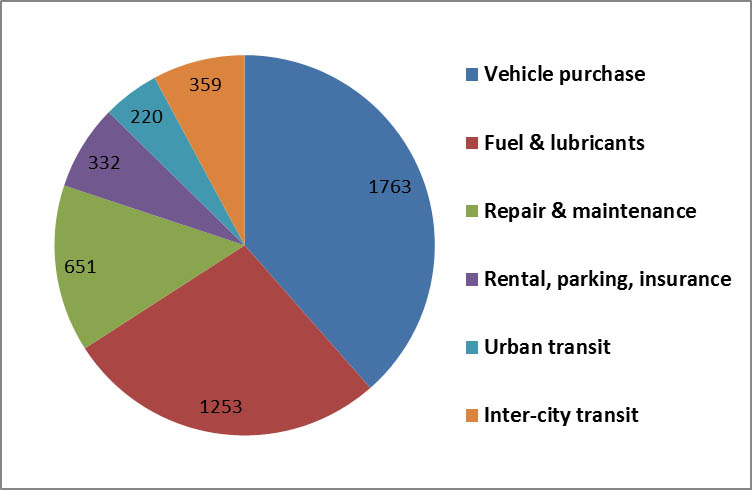
These general patterns are also shown by the costs of transportation (Figure 25.5). Average household expenditures on transportation were about $9,208 in 2004, or 17% of total spending. About 83% of transportation spending was associated with owning and operating cars or light trucks. Only 0.6% was spent on bicycles, even though these are the most energy-efficient means of transportation in urban areas (see In Detail 25.1).
Figure 25.5. Costs of Transportation in Canada. Data are for 2013 and are the average annual per-capita expenditures on transportation. The value in the pie wedges indicates the annual expenditure in current dollars, and the area represents the percentage of the total. Sourcs: Data from Transport Canada (2014).
Although owning a car or truck is widely viewed as a desirable aspect of our lifestyle, the reliance on personal motor vehicles seriously affects environmental quality in cities and towns. Compared with other means of urban transportation, personal motor vehicles emit more air pollution, require more physical infrastructure (such as roads and parking space), use more material and energy resources, and are more costly to own and operate. Significant safety hazards are also associated with the use of personal motor vehicles – 2,077 Canadians died in transport accidents in 2012, equivalent to 0.9% of all deaths (Transport Canada, 2012). There were also 165-thousand injuries serious enough to require medical attention.
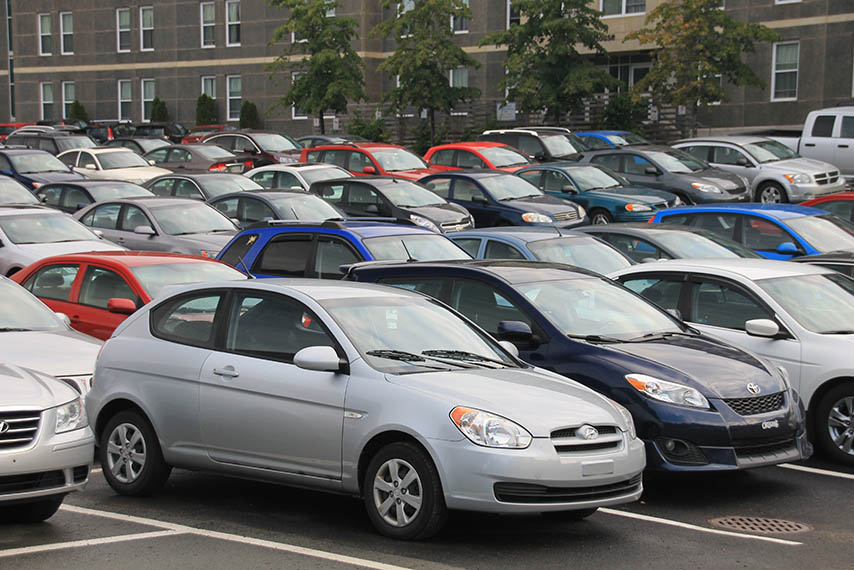
Image 25.2. A large amount of space is allocated to cars and other vehicles in cities, particularly roads and parking areas. If intelligent life forms on a voyage of discovery were to hover in their spacecraft over a Canadian city, they might initially conclude that the dominant form of life is the automobile. Source: B. Freedman.
In Detail 25.1. The Bicycle: A Green Machine Invented in the late nineteenth century, the bicycle rapidly became recognized as an efficient, safe, and fun way to get around. Even today, with all of the advances in technologies for powered transportation, the bicycle is still the most efficient means of transporting people on land. This fact is illustrated by comparing the energy typically used to transport a passenger using various technologies (Holcomb, 1987):
- Automobile (1 occupant) 1163 cal/km
- Automobile (2 occupants) 581
- Transit bus 575
- Transit rail 553
- Walking 63
- Bicycling 22
Unlike motorized transportation, riding a bicycle does not emit air pollutants such as NOx, SO2, hydrocarbons, or particulates. Moreover, bicycle manufacturing requires far less material and energy resources, and less infrastructure is needed to support these vehicles in terms of space for roads and parking. Therefore, bicycles represent an environmentally soft (or “green”) alternative to motorized vehicles for personal transportation. There are more than 1-billion million bicycles in the world, about half of them in China. Canadians own about 13 million bicycles, or 0.42 per person. In spite of this number, only 1% of all trips are made using a bicycle, which suggests that many bicycles are not well used. Great environmental benefits would result if more Canadians used bicycles instead of motor vehicles as a means of personal transportation. These benefits include less air pollution, smaller costs of transportation infrastructure, and less use of energy and material resources. Personal benefits include the convenience of bicycle travel and improved health from frequent exercise.
However, bicycle riding can be dangerous, mostly because of the risk of collisions with motor vehicles. About 2% of vehicle-related deaths in North America involve bicyclists (motor-vehicle accidents are the other 98%, but the per-trip and per-kilometre risk of death associated with bicycle use is more than twice as great; Insurance Institute for Highway Safety, 2014). In the United States in 2012, there were 772 bicycle-related fatalities, and Canadian data are about 10% of that. However, bicycle fatalities have decreased by 24% since 1975 because most cyclists now wear a helmet (98% of fatalities involve people without a helmet). Safer bicycle use requires separate lanes along busy roadways, improved awareness by automobile and truck drivers of the need to share the road with bicycle riders (and vice versa), and increased use of safety equipment by bicyclists, especially helmets and lights and reflective devices at night. The use of bicycles in cities can be encouraged in the following ways:
- by developing a network of cycleways (separate paths for bicycles), bike lanes, and paved shoulders on major roads
- by providing secure parking facilities at workplaces and public-transit stations (the latter is known as “bike and ride”)
- by having a fleet of bicycles for free use or inexpensive rental from a network of pick-up centres (this system, first used in several European cities, is being tried on a smaller scale in North America, including Montreal)
- by educating people about the advantages of bicycle transport and safety issues.
Other ways to increase bicycle use would be much more difficult to implement. For example, urban-planning options could encourage people to live closer to their workplaces, giving them shorter commutes. In addition, legislation could ensure that people using motorized transport pay the full costs of their choice of transportation by withdrawing subsidies for the construction of roads, bridges, parking lots, and other infrastructure and by applying realistic taxes (such as user fees) to offset the costs of associated air pollution and resource depletion.
Urban Pollution
Urban pollution includes elevated concentrations of chemicals and particulates, increased noise and heat, and impaired aesthetics. We briefly examine each of these topics in the following sections.
Chemical Pollution
Urban environments commonly have higher concentrations of various chemicals than typically occur in rural places. As well, a wider range of chemicals is present, including many synthetic ones. Often, chemical pollution of the urban environment is intense enough to damage the health of people, animals, and vegetation.
Soil in urban areas may become polluted by a wide range of substances, including petroleum products, halogenated hydrocarbons (such as PCBs), and metals. This is illustrated by the following examples.
- Hydrocarbon spills: Liquid hydrocarbons, such as gasoline, fuel oil, paints, and solvents (such as those used in dry-cleaning) are stored in many places. This includes underground tanks at gasoline stations and fuel-oil tanks in homes and at commercial, industrial, and institutional buildings. Smaller amounts of fuels are contained in all cars, trucks, and other vehicles. Spills of some kinds of liquid fuels, such as gasoline, can be extremely hazardous because of the risk of fire or explosion. In addition, if liquid hydrocarbons are spilled onto soil, they quickly penetrate and cause local pollution of the groundwater, which may then spread widely as a plume of tainted water. This can ruin the usefulness of an aquifer as drinking water: as little as 1 ppm of hydrocarbons can result in discernible tainting and even smaller concentrations of some chemicals are considered a health risk. It is difficult or impossible to contain a hydrocarbon spill once it reaches groundwater or to fully rehabilitate a polluted aquifer. It is much easier to avoid hydrocarbon spills than to deal with the environmental damage they cause.
- Metals: Urban soil can become polluted by metals in many ways. For example, people who live near metal-recycling factories may be exposed to pollution through dustfall from the atmosphere. In one case, severe pollution was found in a downtown Toronto residential neighbourhood near a car-battery recycling factory. Lead in surface soil near the factory exceeded several thousand ppm (one sample had >5% lead), and some residents had elevated lead in their blood and hair. This astonishing land-use conflict occurred because of earlier, inappropriate land-use zoning, when less attention was placed on environmental concerns. However, the battery-recycling factory still remains in the residential neighbourhood, although it operates much more cleanly than in the past. Lead pollution of urban soil has also been caused by residues of old paint, which often had very high concentrations of lead-containing pigments (commonly reaching 38% in the dried residue), especially in white and red colours. (Lead is now mostly replaced in household paints by titanium and other less-toxic metals). Soil close to busy highways is also affected by leaded gasoline (this problem has dissipated since the 1990 ban on leaded gasoline; see Figure 25.6 and Chapter 18).
Eutrophication is another kind of urban pollution. Lakes and rivers in urban areas often have an enriched nutrient supply, which results in increased productivity and eutrophication. The nutrient inputs originate from fertilizer use in horticulture, leaching from septic fields, and sometimes the dumping of sewage. Urban waterbodies are also commonly polluted with coliform bacteria and other intestinal pathogens and parasites that originate with sewage and surface runoff contaminated by pet and bird feces. Lakes and rivers may also be affected by spilled fuel, metals, garbage dumping, and sedimentation by soil eroded during construction activities. Any of these influences on urban lakes may render them less suitable or even unfit as a source of drinking water or for recreational purposes. Eutrophication and sedimentation also cause significant ecological damage in many urban waterbodies.
Urban air pollution can also be severe, causing life-threatening health problems for many people, particularly the old or very young and those with respiratory diseases. Severe pollution by sulphur dioxide and particulates was once common in North American and European cities, when coal was burned as an industrial and residential fuel. This problem has, however, been greatly alleviated since the early 1960s because of clean-air regulations (Chapter 16). However, this kind of reducing smog is still severe and even worsening in many rapidly developing countries, where a lower priority is given to enforcing clean-air laws.
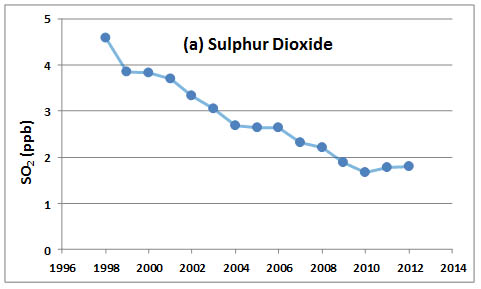
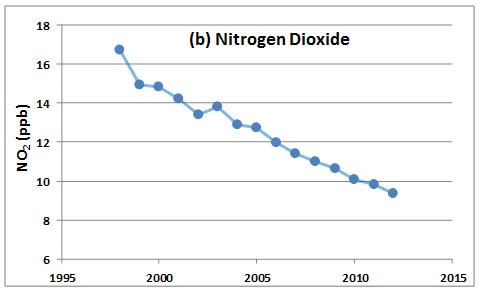
In spite of great improvements since the 1960s, cities in Canada and other developed countries continue to be affected by significant levels of air pollution (Chapter 16; Figure 25.6). The following are particularly important.
- SO2 and NOx gases: Although so-called reducing smog is much less of a problem than before, urban atmospheres still have higher concentrations of SO2 and NOx than rural areas. The dry deposition of these gases damages marble, limestone, sandstone, and other acid-sensitive building materials and statues, and it contributes to the acidification of aquatic habitats (Chapter 19). In addition, these gases may be directly toxic to sensitive urban plants and lichens.
- Suspended particulates: Largely originating from emissions from vehicles, furnaces, and other combustion sources, suspended particulates are mostly fine aerosols of ammonium sulphate, ammonium nitrate, and sooty organics. At high concentrations they form a haze that interferes with visibility and is a hazard to people with respiratory problems. In general, air pollution by particulates has decreased markedly during the past several decades, mainly because of better emission controls on power plants, other industrial sources, and vehicles, and because of widespread switching to natural gas as a fuel.
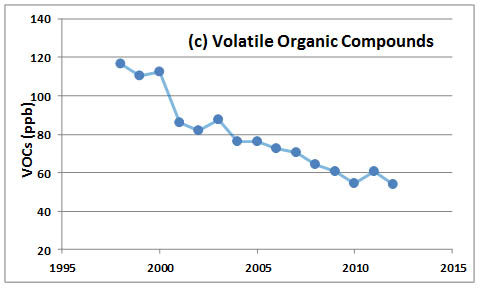
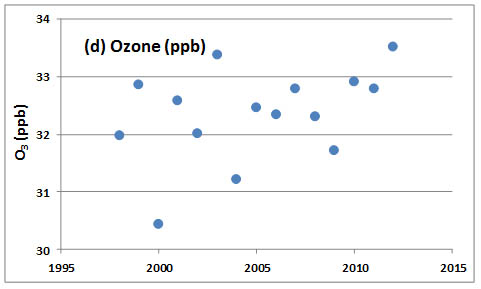
- Oxidants: Cities with a sunny climate and a large number of motor vehicles often develop a photochemical smog during the day, characterized by high concentrations of ozone, peroxy acetyl nitrate (PAN), NOx, and volatile organic compounds (Chapter 16). The ozone component is responsible for most of the oxidant damage because it is toxic to many plants, irritates people’s eyes and respiratory tracts, and degrades many materials and pigments. The worst photochemical smog occurs in southern Ontario and Quebec, extending from Windsor to Quebec City, and to a lesser degree in the greater Vancouver area and around Saint John. The air-quality objective for ozone (63 ppb) is exceeded on many summer days in the Quebec-Windsor corridor, where maximum hourly concentrations can exceed 160 ppb. Niagara Falls, Sarnia, Windsor, and Guelph are among the smoggiest cities in Canada, exceeding ozone guidelines for more than 50 days per year. The photochemical smog in this region occurs because of local emissions of NOx and volatile organics (these are precursors in the photochemical production of ozone; see Chapter 16), as well as those blowing in from urban areas in the nearby United States. In contrast, local emissions are the major cause of ozone smog in the Vancouver area.
Figure 25.6. Air Quality Trends in Canada. These data are from sampling stations located throughout Canada, but mostly in urban areas. Source: Data from Environment Canada (2014).
Urban Climate
The climate of urban regions is different from that of nearby rural areas. Compared with rural areas, cities typically exhibit the following characteristics:
- they are warmer by 3-6°C
- have 5-10% more cloud cover
- receive about 20% less solar radiation
- have 20-30% lower wind speeds (although wind-tunnelling may increase windspeeds near large buildings)
- have 5-15% lower relative humidity
- receive 5-15% more precipitation The best known of the climatic differences, called the “heat-island” effect, refers to the warmer temperature of cities, which occurs because of the following influences on the urban energy budget:
- an emission of large amounts of heat (thermal energy) from buildings and machines (including motor vehicles)
- interference by buildings with the dispersal of warmed air by wind
- the absorption of solar radiation by dark surfaces (especially asphaltic roads and parking lots ), followed by the re-radiation of long-wave infrared
- a relative lack of plant foliage in urban areas (the atmosphere is cooled by the evaporation of water from foliage, also known as transpiration)
Thermal Pollution
Thermal pollution occurs when an increase in environmental temperature is sufficient to result in ecological damage. This may be due to the direct discharge of heat into the environment, often from a point source into an aquatic ecosystem. As the water becomes warmer, the respiration of poikilothermic (cold-blooded) organisms increases, about doubling in rate for every 10°C increase in temperature. At the same time, the amount of dissolved oxygen in the water decreases (because the solubility of gases is less in warm water). The increased metabolism and decreased oxygen cause physiological stress to aquatic organisms. Associated ecological problems include changes in the communities of fish, invertebrates, aquatic plants, and algae. Extreme thermal pollution can result in anoxic water, accelerated eutrophication, and fish kills. Thermal pollution can reduce the potential for recreational, industrial, and drinking-water uses of a waterbody.
Thermal pollution is associated with discharges of warmed water from fossil-fuelled or nuclear-power plants or other large industrial facilities. These places often use a local waterbody as a source of cooling water. The warmed water is then returned to the environment to dissipate its increased heat content. Because power plants are typically 30-40% efficient in converting the energy content of their fuel into electricity, the other 60-70% of that energy must be dissipated. A power plant employs heat exchangers to warm the cooling water, which is then released into the environment.
However, some receiving waterbodies may be too small to absorb all of the heat received without becoming excessively warmed (for example, by more than about 5°C) and suffering ecological damage. In such cases, some of the heat may be dissipated into the atmosphere using special facilities, such as a constructed, shallow cooling pond, in which surface evaporation cools the water before its release into the natural environment. Alternatives include a “wet” cooling tower, in which the water is cooled by spraying it into the air, or a “dry” cooling tower, which uses a system of heat exchangers to transfer heat to the atmosphere (these options are uncommon because of their high costs of construction and operation). Better yet, some of the “waste” heat may be used to warm nearby buildings, or in commercial greenhouses to grow vegetable crops in winter (as occurs near the Bruce Nuclear Generating Station in Ontario), or in an aquaculture facility to grow fish (this is more commonly done in Europe).
Noise Pollution
Urban areas are typically much noisier than rural ones. Most of the noise comes from the operation of various kinds of machines that are abundant in urban places, such as air conditioners, lawnmowers, automobiles, heavy trucks, and air compressors. Loud music may also be important. Noise pollution begins when the level of ambient sound becomes distracting to the normal activities of people, for example, by making it difficult to understand a conversation or to have a restful sleep.
Noise intensity (also called sound pressure or loudness) is measured in units of decibels (dB). An increase of 10 dB is approximately equivalent to a doubling of the loudness. When the distance from a point source is doubled, the noise level decreases by about 6 dB. However, when the distance from a linear source of noise (such as a busy highway) is doubled, the sound level decreases by only about 3 dB.
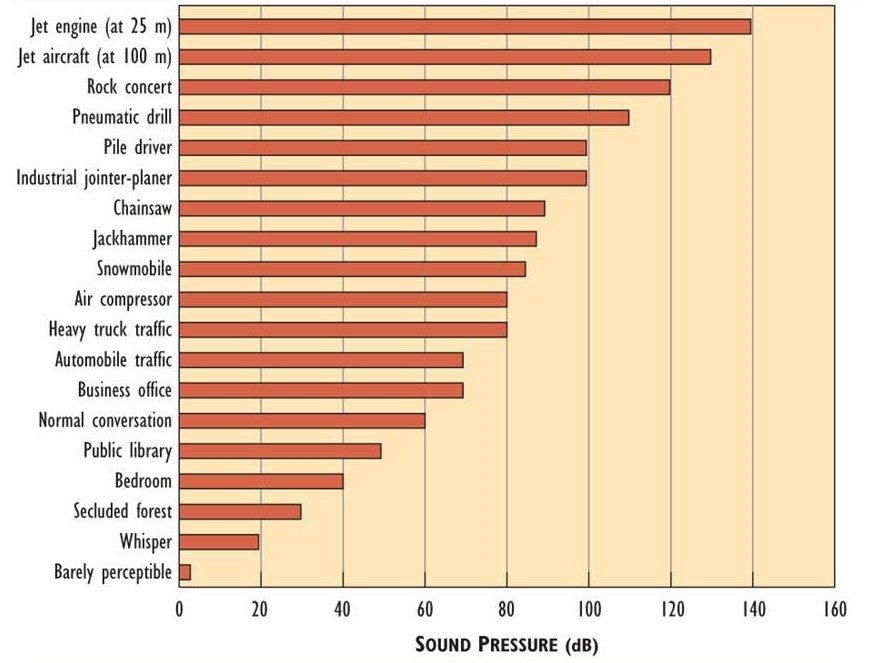
At a high intensity, noise pollution can cause a progressive and enduring hearing impairment, which begins with a decreased ability to perceive higher-pitched sound. Under prolonged exposure, the hearing loss may progress through much of the auditory range. Hearing loss is caused by both the duration and intensity of exposure. For example, an occupational exposure to 115 dB may be permitted for no longer than 15 minutes, while exposure to 100 dB may be allowed for two hours and 90 dB for up to eight hours. Noise becomes painful at about 140 dB, although prolonged exposure to levels above 80-90 dB can result in long-term hearing loss. The noise levels typically associated with various sources are shown in Figure 25.7.
People may be exposed to excessive noise in various ways. Non-voluntary exposures occur in the ambient environment, such as near a road with heavy traffic. Occupational exposures occur in noisy factories or in hangars where jet engines are serviced. Voluntary exposures to excessive noise are also common, such as when people attend thunderous rock concerts or use headphones to listen to loud music. It is well known that permanent hearing loss is common among rock musicians as well as people who regularly listen to loud music at concerts, clubs, or using headphones. Frequent target-shooting with firearms can also result in long-term hearing loss unless effective ear protection is used.
Various levels of government in Canada have set criteria for permissible exposures to noise. For example, Health Canada sets standards and guidelines for occupational exposures, while provincial and municipal governments deal with particular sources (such as the amount of noise a vehicle can make) as well as noise levels in the ambient environment. Various actions can reduce the noise intensity in occupational and urban environments. Vehicles and other machines are required to have noise-absorbing devices (mufflers) that must perform according to regulated standards. Machines in the work environment may also be muffled, and workers may be advised or required to wear hearing protection.
Figure 25.7. Sound Pressure Levels Associated with Various Sources of Noise. Source: Data from Timerson (1999).
Aesthetic Pollution
Aesthetic pollution is substantially a matter of cultural values. It commonly involves visual images that are displeasing to many (but not necessarily all) people. As such, the criteria for aesthetic pollution cannot be precisely defined. For example, many people might find the following to be objectionable:
- a neighbourhood of dirty run-down buildings
- an area cluttered with garbage
- a street with a viewscape blocked with gaudy billboards, neon advertising, and other promotions
- overhead utility wires
- spaghetti-like networks of roads, overpasses, and underpasses crowded with grid-locked vehicles
- paved open spaces without trees, shrubs, or flowers.
However, there is, however, no broad consensus about what constitutes aesthetic pollution – some people might find that these scenes have aesthetic merit and may even seek them out. Aesthetic pollution is not generally considered to be as important a problem as chemical, noise, or thermal pollution. Nevertheless, urban planners, neighbourhood activists, and other concerned people do try to reduce the aesthetic pollution of cities and towns. For example, many urban areas have bylaws that require property owners to keep their property clean and in good repair. Some places require that utility cables be buried, or they ban certain kinds of advertising. (For example, in order to conserve pastoral viewscapes, unrestricted highway billboards are not allowed on Prince Edward Island.) Reducing aesthetic pollution in urban areas makes them nicer places in which to live and work.
Waste Management
Any discarded materials can be viewed as waste, but there are a number of categoris:
- Solid wastes are extremely variable in composition and include discarded food, leaves and lawn clippings, newspapers and other papers, glass and plastic bottles, cans, disposable diapers, construction debris, industrial chemicals, old cars, and disused furniture
- Liquid wastes include sewage and discarded industrial and household fluids
- Gaseous wastes include products of combustion or industrial reactions
- Hazardous wastes are flammable, corrosive, explosive, toxic (also called toxic waste), or otherwise dangerous, and they should either be treated before disposal or discarded into a specially designed, secure landfill to environmental damage
People have always produced wastes of many kinds. However, the amount and complexity of discarded materials have increased enormously as a result of industrial and technological development, coupled with the growth of population and consumerism. Activities in urban areas produce huge amounts of waste. Waste management is the handling of discarded materials, using various methods:
- Dumping is the long-term disposal of disused material. The disposal of solid wastes by dumping usually occurs into a sanitary landfill (see below). Liquid wastes are most commonly discarded into a nearby lake or river, with or without treatment to reduce the amounts of organic matter, toxins such as metals and hydrocarbons, and pathogens. Gaseous wastes are usually dumped into the atmosphere, although the amounts of damaging gases (such as SO2) and particulates may be reduced by pollution-control technologies.
- Incineration is the combustion of solid wastes to reduce the amount of organic material. Small-scale incineration may involve open burning. However, incineration in urban areas and industrial plants is conducted in specially engineered facilities designed to burn efficiently, while controlling the emissions of pollutants to the atmosphere. The residual material, consisting of ash, metals, glass, and other non-combustibles, is usually disposed of in a secure landfill. Overall, incinerators reduce the volume of waste by 70-90%, depending on the initial organic content. If the heat produced is used to generate electricity or industrial steam, the incinerator is known as a waste-to-energy facility.
- Recycling involves the processing of discarded materials into useful products. For example, aluminum pop cans can be collected and re-manufactured into new containers or other products. Recycling is an extremely attractive waste-management option for three major reasons: (1) it reduces the total amount of waste, (2) it recovers valuable commodities from discarded materials, and (3) it helps to conserve non-renewable resources (such as metals and fossil fuels) and some renewable ones (such as trees used to manufacture paper). Easily recyclable materials include glass, all metals, most plastics, and almost all kinds of paper. In fact, these discarded materials should be regarded as “resources” rather than “wastes.”
- Composting is a type of recycling in which discarded organic materials are allowed to partially decay under warm, moist, oxygen-rich conditions. Backyard composting is done in simple bins or piles. To enhance the availability of oxygen, advanced commercial systems turn the material occasionally or force air through matter contained in a vessel. All food wastes, lawn clippings, leaves, paper, sawdust, sewage sludge, and other organic discards can be composted. The material produced, known as compost, is rich in humified organic matter and is extremely useful in enhancing the tilth and fertility of garden and agricultural soil (see Chapters 14 and 24).
- Re-use involves finding another use for discarded materials, usually with relatively little modification. Re-use is an attractive waste-management option for the same reasons noted for recycling, but it is even more effective at conserving resources because little effort is put into re-manufacturing (other than repairs, if necessary). Re-use is a common practice with discarded furniture, appliances, books, tools, clothes, and other consumer products. Increasingly, institutions and industries are finding ways to re-use paper, cardboard boxes, other containers, wooden pallets, and other disused materials. Often, re-using networks are organized among industries, universities, hospitals, and other institutions, because “waste” materials produced by one partner may be a “resource” for another.
- Waste reduction and prevention are not, strictly speaking, waste-management methods. Rather, they are intended to reduce the amounts of waste that must be handled by the above methods. Waste reduction and prevention include choices by consumers to buy products that are not excessively packaged or that are sold in reusable, returnable containers. People can also choose to buy less –to have fewer shoes and items of clothing, to own fewer (or no) automobiles, and to adopt other elements of a less consumerist lifestyle. Industries also have many options to reduce or prevent their production of wastes. For example, wood-processing industries once routinely incinerated or land-filled waste tree bark and sawdust, but today they routinely use them to manufacture pulp or as a source of energy. In fact, some pulp mills now satisfy most of their needs for raw fibre by using sawdust and trimmings from nearby sawmills.
The various ways of managing waste materials differ greatly in their environmental impacts. In general, environmental problems associated with the generation and disposal of wastes are lessened by adopting any of the following “R’s” into our individual and corporate lifestyles: refuse (waste prevention), reduce, reuse, and recycle.
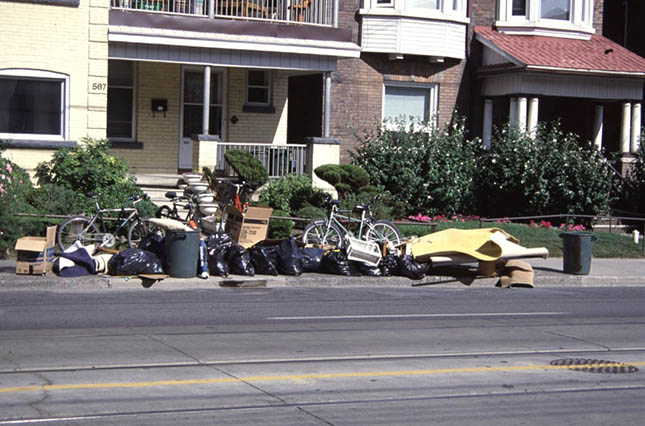
Image 25.3. Solid-waste management is an important function carried out by municipal governments. This image shows a pile of discarded material placed at the curbside for collection. Much of this material could have been recycled, but instead it will be land-filled. Source: B. Freedman.
Municipal Solid Waste
Municipal solid waste (MSW) is generated by households, businesses, and institutions such as schools and hospitals. The components of MSW are extremely diverse, but they do not include sewage sludge (discussed in the following section) or waste generated by heavy industry. Until fairly recently, all MSW was disposed in “open dumps,” a practice that may still occur in smaller communities in Canada and in poorer parts of the world. Usually, an open dump is located in a relatively out-of-the-way natural basin, such as a lake, wetland, or other low area, which is gradually in-filled with waste. Many environmental damages are associated with open dumps, including the pollution of groundwater and surface water by toxic leachate, foul smells, smoke from open burns used to decrease the volume of garbage, populations of pest animals, and terrible aesthetics.
In the 1920s, engineers began to design sanitary landfills, where MSW is dumped, compacted by heavy machines (such as bulldozers), and covered with about 10 cm of clean dirt at the end of each day. This reduces odours and populations of rodents, gulls, insects, and other pests. Sanitary landfills became common in developed countries during the 1940s, and advanced variations are now used by Canadian municipalities (although not by all smaller towns and villages). Modern sanitary landfills include the following elements in their construction:
- one or several impervious linings of clay, plastic, or concrete that prevent the downward leaching of water with high concentrations of ammonium, metals, and other toxic chemicals
- a cutoff wall of concrete or another impervious material around the edge of the landfill to prevent the sideways migration of polluted water
- a system of pipes and gravel drains to collect leachate for treatment before the water is released into the environment
- a system of piping to collect methane, a greenhouse gas produced by anaerobic decomposition of organic matter in the landfill, which can be burned to produce electricity or heat In spite of these advanced design elements, residual problems of groundwater and surface water contamination and methane emissions to the atmosphere may still occur.
Another way of disposing of MSW is to incinerate it. During the nineteenth century, some cities burned much of their organic garbage using crude facilities known as cremators or cone-shaped teepee-burners. However, these caused intense local pollution and were replaced by the land-filling of MSW. Beginning in the 1930s, some cities built more-efficient burning facilities called incinerators, but these were also dirty and most were shut down by the late 1960s. However, beginning in the 1970s, much cleaner incinerators were built, known as waste-to-energy or resource recovery facilities. These incinerators burn organic MSW efficiently and have technology installed to reduce the emissions of particulates and other air pollutants. However, the ash produced is a toxic waste that must be disposed of in a secure landfill.
All municipalities need facilities for handling their solid wastes. However, public attitudes play a crucial role in any waste-management decisions. Any new proposal to develop a sanitary landfill, incinerator, recycling plant, or other MSW-related facility is sure to be opposed by people living near the proposed site. This phenomenon is referred to as NIMBY, an acronym for not in my backyard. If local opposition becomes highly vocal and widespread, municipal bureaucrats and politicians often will not approve a proposal, which creates an important problem for those who are attempting to deal with waste-management issues. It also strongly motivates engineers to design landfills and incinerators to operate as cleanly as possible, while increasing the pressure for society to act to reduce and recycle discarded materials more efficiently than in the past.
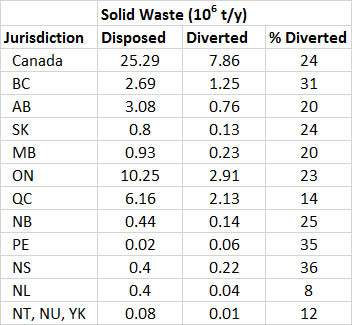
In 2006, Canadians produced over 35-million tonnes of MSW, or 1.04 t/person, of which 76% was dumped and the other 24% diverted by recycling and composting (FCM, 2009; Statistics Canada, 2012). Of the total, 22-million tonnes came from non-residential sources and 13 million tonnes came from residential ones. Supported by provincial legislation that establishes targets, the highest diversion rates occur in Nova Scotia (41%) and Prince Edward Island (38%), followed by New Brunswick (36%), British Columbia (32%) and Québec (27%). The lowest diversion rates are in Newfoundland & Labrador (7 %) and Saskatchewan (11%).
Still, much of the dumped MSW could yet be diverted: 45% of it consists of recyclables (metals, glass, plastics) and 28% is organic waste. Note, however, that these figures vary widely across Canada, depending on the size and density of the urban population (diversion programs are more economic in larger centres) and on the priority placed by municipal and provincial/territorial governments on advanced (but expensive) options for the management of solid wastes. Increasingly, governments are requiring or encouraging options that decrease the amount of solid waste that must be handled by land-filling or incineration.
Table 25.1. Municipal Waste Management in Canada. Data are for 2006. Disposed includes land-filled plus incinerated waste. Diverted includes recycled and reused waste. Source: Data from Statistics Canada (2007).
Almost all Canadian municipalities are taking steps to reduce the amount of discarded material that must be land-filled or incinerated. The typical content of residential waste in Canada is:
- 40% organics, such as compostable food wastes
- 40% recyclable materials, such as metal and plastic containers
- 10% bulky goods, such as disused furniture, which can often be re-used or re-purposed
- 10% other goods, much of which is also potentially recyclable or otherwise diverted from the disposal stream
Most towns and cities are developing systems to divert material away from the waste stream and they are achieving increasing success in doing that. For example, the following cities have achieved significant diversions of residential MSW from landfills, mostly by instituting various kinds of recycling programs (FCM, 2009; plus direct reports from municipal governments):
- Vancouver, BC, 58%
- Nanaimo, BC, 64%
- Edmonton, AB, 60%
- Saskatoon, SK, 40%
- Hamilton, ON, 44%
- Owen Sound, ON, 51%
- Toronto, ON, 53%
- Victoriaville, QC, 64%
- Sherbrooke, QC, 54%
- Halifax, NS, 59%
- Charlottetown, PE, 60%
Toronto diversion rate of 53% factors in by both single-family homes and multi-unit residential buildings (>9 units). In 2013, residents of single-family homes had a diversion rate of 68%, but those in multi-unit buildings only 26%. Clearly, in this and all cases of MSW diversion in Canada, there is a lot that can yet be accomplished.
Municipal Wastewater Treatment
Issues associated with municipal wastewater include its amount and composition, ways of treating the material, and ecological effects of its disposal. First, we should distinguish among major kinds of wastewater.
- Sewage is wastewater that contains the fecal matter of humans and other animals, plus food waste from kitchens and commercial food processing. In urban areas, sewage is collected using a complex system of underground pipes called sanitary sewers, and transported to a central place for treatment and/or disposal.
- Industrial wastewater may contain many kinds of liquids, including toxic and hazardous wastes. As was previously noted, toxic waste is poisonous, while hazardous waste may be explosive, flammable, or dangerous for other reasons. Many urban areas have separate systems to collect and treat toxic and hazardous industrial wastewater.
- Stormwater is the runoff of rainfall and snowmelt. In municipal areas, it is typically collected using surface drains that feed into a combined sewage-stormflow system, or using a more advanced drainage system that keeps these wastewaters separate. Stormwater is not as grossly polluted as sewage or industrial wastewater, but it does contain significant amounts of fecal material (from pets and wild animals), metals, waste motor oil, road salt, and other substances.
Sewage Treatment
In most places, the principal objective of sewage treatment is to reduce the amounts of pathogenic microbes and oxygen-consuming organic matter that are disposed of into receiving waterbodies. In places where surface waters are vulnerable to eutrophication, sewage may also be treated to reduce the amounts of nutrients, especially phosphorus and nitrogen (see Chapter 20).
All towns and cities have networks of underground pipes to collect the sewage effluent from homes, businesses, institutions, and factories. (However, low-density residential areas may have septic systems installed at individual homes.) Some municipalities have separate collection systems for sewage and stormwater. Eventually, all of the wastewater is discharged to the environment, usually into a nearby lake, river, or ocean. To avoid environmental damage, the wastewater should be treated to reduce its pollutant load before it is discharged. However, some towns and cities still dump raw sewage. Most of these municipalities are located beside an ocean and rely on the local, well-flushed marine ecosystem to dilute and biodegrade organic pollutants and pathogens in the sewage. Because inland waters such as lakes and rivers have a much smaller capacity for diluting and biodegrading sewage wastes, municipalities located beside these waters treat their sewage. (See Chapter 20 for a description of various sewage-treatment systems.)
About 78% of Canadians were serviced by municipal wastewater treatment systems in 2006 (the rest used septic tanks, other private systems, or lived in municipalities that dump non-treated sewage; Environment Canada, 2007). Of the municipal populations, 40% were serviced by tertiary treatment, 38% by secondary, and 19% by primary (these terms are explained in Chapter 20). The remaining 3% had their sewage dumped untreated into the environment. Relatively advanced tertiary systems are used mostly in Ontario and the Prairies. This is because these regions discharge their treated wastewater into rivers and lakes, so a higher level of water treatment is needed to prevent environmental damage. The lowest standard of wastewater treatment is in parts of Atlantic Canada, Quebec, and British Columbia, where some cities are still dumping untreated or only partially treated sewage into coastal waters or large rivers.
Because of concerns about environmental quality in local receiving waters, particularly regarding fecal pathogens and ecological degradation, some cities (such as Calgary, Edmonton, and Toronto) have invested in higher-level systems of water treatment. As a result, the quality of local waterbodies has greatly improved. In contrast, coastal cities, such as St. John’s and Victoria, continue to discharge poorly treated sewage into the coastal ocean, relying on “free environmental services” to dilute and biodegrade their effluents. Environmental damages associated with the discharge of untreated or poorly treated sewage include the following:
- the pollution of receiving waters with human fecal pathogens, such as coliform bacteria and viruses, which renders the area unfit for swimming and for use as drinking water
- ecological damage caused by the deoxygenation of water and sediment by the decomposition of organic wastes, resulting in the deaths of many organisms and the development of foul odours
- stimulation of algal blooms through excessive nutrients from sewage effluent
- contamination of the environment with persistent, potentially toxic chemicals, such as metals and organochlorines
- aesthetic damage associated with the presence of sewage waste
These environmental damages, which can be severe, are largely avoided if municipalities invest in facilities to treat their sewage. Because of this widely recognized fact, all Canadian cities and towns, including coastal ones, will further upgrade their facilities to treat their wastewater during the next several decades.
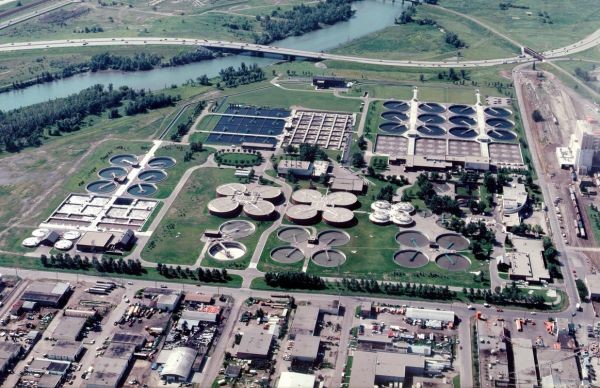
Image 25.4. This sewage-treatment complex serves a population of more than 1 million in the city of Calgary. Because the discharge goes into the Bow River, a relatively small waterbody, the treatment must be of a high standard to prevent ecological damage. In fact, this is perhaps the most advanced system being used in Canada, with tertiary treatment, ultraviolet disinfection, and production of composted sewage sludge for use as a soil conditioner. Source: Courtesy of the City of Calgary/Bonnybrook Wastewater Treatment Plant.
Urban Biodiversity
Urban areas are highly impoverished in terms of the amount and quality of habitat available to support plants, animals, and microorganisms. Nevertheless, many wild organisms do occur – even parking lots, sidewalks, and industrial areas, which from an ecological perspective are extremely degraded habitats, do manage to support some biodiversity.
Still, some urban places are relatively natural in character and are maintained in this condition as parks. Some prominent examples of “natural-area parks” include Stanley Park in Vancouver; a series of parks along the Bow River in Calgary and on the North Saskatchewan River in Edmonton; Assiniboine Park in Winnipeg; High Park and Hanlan’s Point in Toronto; Bois de Liesse in Montreal; Point Pleasant Park in Halifax; and Signal Hill in St. John’s. These greenspaces are remnants of natural habitat that have survived the urbanization process, and they contain ecological communities that are mostly dominated by native species.
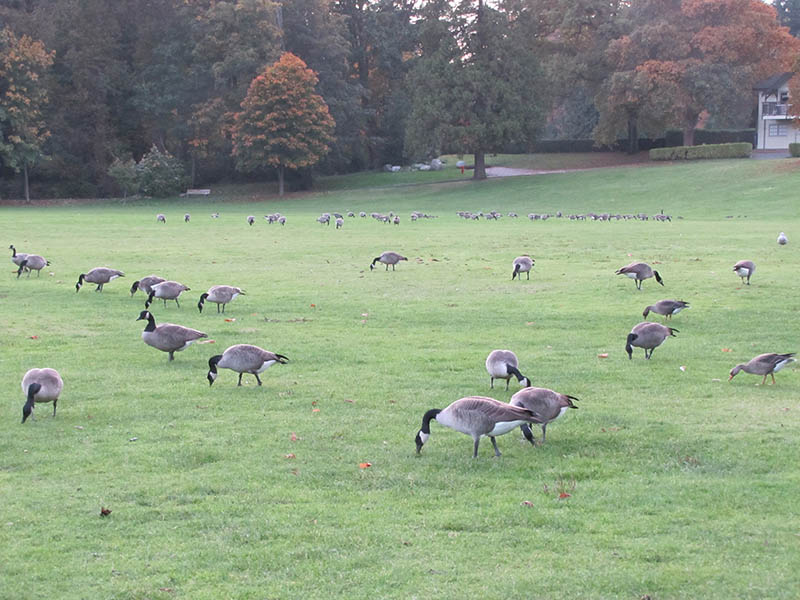
Image 25.5. Stanley Park in Vancouver is a greenspace with a mixture of natural and cultural values. During the autumn and winter, geese and other migrating waterfowl use the local ponds and other habitats for feeding and other purposes. Source: B. Freedman.
More typically, however, urban habitats are dominated by alien species, which were introduced in various ways. Most non-native plants were introduced in these ways:
- as seeds contained in soil carried by ships as ballast, which was dumped in a port when the cargo was discharged (this was particularly important before the twentieth century)
- as seeds that contaminated the seedstock of crop plants (this is now less of a problem because weed seeds are “cleaned” from commercial seedstock)
- or as plants used in agriculture, forestry, or horticulture. Some alien plants have found good habitat in urban areas, where they thrive and out-compete native species. These invasive aliens are an important ecological problem and can be regarded as a kind of “biological pollution” (see Chapters 1 and 26).
Non-native animals are also common in urban areas. Some, such as the house mouse (Mus musculus) and Norway rat (Rattus norvegicus), were introduced accidentally when they escaped from infested ships and cargoes. Others were deliberately introduced. For example, the rock dove (pigeon; Columba livea), starling (Sturnus vulgaris), and house sparrow (Passer domesticus) were introduced by a nineteenth-century society of gentlemen who were dedicated to bringing all of the birds mentioned in the plays of William Shakespeare to North America. Of the various species that these misguided naturalists attempted to introduce, only these three have established widespread populations.
Many alien species now have wild, self-maintaining populations in urban areas. Examples of these invasive plants and animals and the ecological problems that are associated with them include the following:
- The dandelion (Taraxacum officinale) is a perennial, herbaceous plant that was originally native to alpine habitat in Europe, but now occurs in temperate regions throughout the world, probably having been introduced in marine ballast. The dandelion is considered an important weed of lawns and pastures.
- Japanese knotweed (Polygonum cuspidatum) is a perennial, herbaceous plant that grows up to 2-m tall and is native to Japan. It has attractive foliage and was widely introduced for horticultural use. It can be invasive in disturbed areas.
- The sticky touch-me-not (Impatiens glandulifera) is an annual wildflower native to the Himalayas. It was introduced through horticulture and can be invasive in gardens and wetlands.
- Goutweed (Aegopodium variegatum) is a perennial, herbaceous plant native to Eurasia that was widely introduced through horticulture and is invasive in gardens and other disturbed habitats.
- Purple loosestrife (Lythrum salicaria) is a perennial, herbaceous plant of Eurasia that was introduced through ships’ ballast and horticulture and is a serious invader of wetlands.
- St. John’s wort (Hypericum perforatum) is a perennial, herbaceous plant of Europe that was introduced probably through marine ballast and is now a serious weed of pastures that causes a photosensitivity disease in cattle.
- Norway maple (Acer platanoides) is a native tree of Europe that was introduced for horticultural use. It invades natural hardwood forest.
- The oriental cockroach (Blatta orientalis) is an insect native to eastern Asia. It was probably introduced accidentally with ship cargo and is a serious pest in homes and other places where food is stored.
- The garden snail (Cepaea hortensis) is a terrestrial mollusk native to Europe. It was probably accidentally introduced with marine ballast and is a garden pest in some regions.
- The house mouse and Norway rat are rodents native to Eurasia that were accidentally introduced from ships and are now serious pests in homes and other places where food is stored.
- The starling, rock dove, and house sparrow are songbirds native to Eurasia that were introduced by European settlers in the Americas who were anxious to have familiar species from their homeland. They displace native birds from nesting sites and are invasive pests.
These and other free-living, alien species are the most abundant plants and animals in Canadian urban areas. Of course, the domestic dog (Canis familiaris), domestic cat (Felis catus), and other pets are also common non-natives in our cities and towns. (Even though Aboriginal peoples have lived in the Americas for at least 12-thousand years, the human species might also be considered non-indigenous to these continents.)
The characteristics of various urban ecosystems have been studied in Canada. Many urban habitats are highly disturbed and are managed to keep them in an early stage of succession. Urban lawns, for example, are mown frequently to prevent their vegetation from developing beyond a stage that is dominated by low-growing, herbaceous plants. Moreover, because most lawn-growers want a monoculture of only one or two species of grasses, they may apply herbicide to kill unwanted dicotyledonous plants, such as clovers, dandelion, and other “weeds.”
The most commonly grown grass in lawns in temperate-zone countries is the Kentucky blue grass (Poa pratensis), which, despite its common name, is actually a Eurasian species. Also cultivated in some regions are ryegrass (Lolium perenne), red fescue (Festuca rubra), and bent grasses (Agrostis species); these are also aliens. Other aspects of the intensive management of lawns include the use of fertilizer, insecticide, and irrigation. Some ecologists recommend less-intensive systems of lawn management, including tolerance of such non-grass plants as red clover (Trifolium pratense), black medic (Medicago lupulina), and other legumes, which fix atmospheric nitrogen and so reduce the need for fertilizer. Even such species as dandelion and buttercup (Ranunculus acris) can be tolerated in lawns and viewed as attractive “wildflowers” rather than as “weeds.”
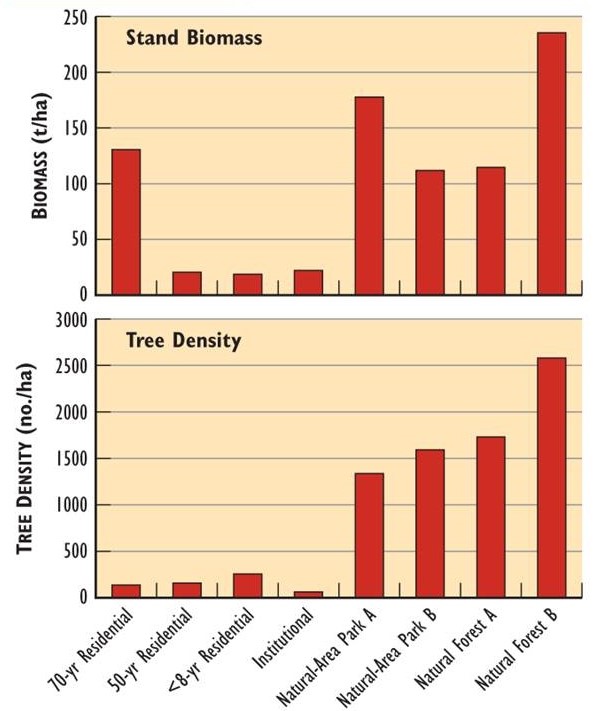
The urban forest is another prominent habitat in cities and towns, although it does not always support native species. Neighbourhoods with abundant trees can be studied using the same methods that are used to examine natural forest. One study looked at the urban forest in residential, institutional, and parkland areas of Halifax (Figure 25.8). Older residential neighbourhoods had a tree biomass similar to that of natural forest in the region, although the stem density was considerably less (many trees in the mature urban forest are relatively large). Younger neighbourhoods had a smaller tree biomass but a higher density, suggesting a pattern of succession in the urban forest. Even an institutional neighbourhood, consisting mostly of several hospitals and a university, had a substantial population of trees.
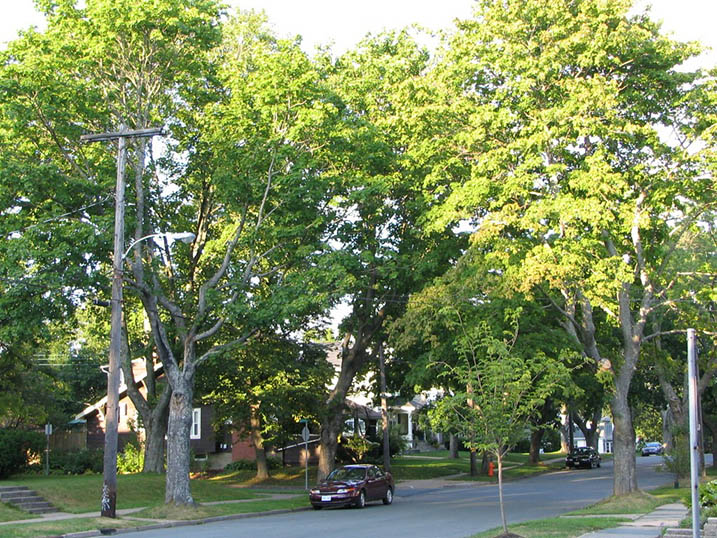
Image 25.6. Streets with large numbers of mature trees are relatively pleasant, compared with places in which the urban forest is sparse or missing. This residential street in Halifax is mostly forested with alien trees, such as Norway maple (Acer platanoides) and linden (Tilia cordata). Source: B. Freedman.
Figure 25.8. Characteristics of the Urban Forest in Halifax. Tree density and biomass are shown for stands of urban forest in different kinds of neighbourhoods. The data for natural forest are for rural mature hardwood stands. Source: Freedman et al. (1996).
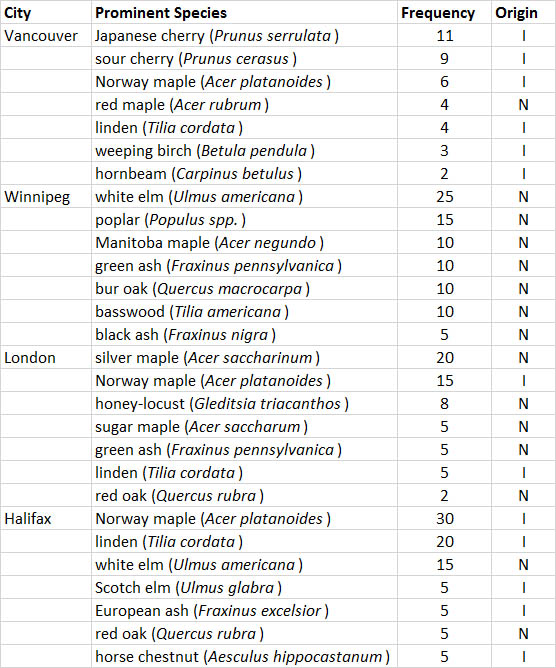
The majority of trees in urban forests are alien species (Table 25.2). In the oldest residential area sampled in Halifax, 72% of the trees were non-native, the most common being Norway maple (Acer platanoides), linden (Tilia europaea), European ash (Fraxinus excelsior), Scotch elm (Ulmus glabra), and rowan (Sorbus aucuparia). An eight-year-old residential neighbourhood had a much larger percentage of native trees (about 92%), which had survived the clearing of the natural forest when the suburb was developed. However, most of the local homeowners were choosing alien species for their horticultural plantings, so their prominence will increase rapidly as the neighbourhood ages.
Table 25.2. Prominent Street Trees in Selected Canadian Cities. The data show the frequency of the seven most abundant species growing in urban forests of four cities. Frequency is given as the percentage of the total number of trees, and Origin is: (N) native to North America or (I) introduced. Source: Data compiled from municipal governments.
The displacement of native plants by alien ones results in important ecological damage, especially if the foreign ones become invasive. Some ecologists believe that horticulturists should place much greater emphasis on the use of native plants, rather than risk the serious problems associated with biological “pollution” by aliens.
The urban forest provides many useful ecological services. For example, large amounts of carbon are stored in urban trees, which helps offset some emissions of CO2 from the combustion of fossil fuels. Urban parks and well-treed residential areas can store as much carbon in tree biomass as can a natural forest (Table 25.8). In addition, well-placed trees reduce the wind speed near buildings, which decreases the air-infiltration rate and thereby helps to conserve heat during cold weather. Trees can also shade buildings, reducing the energy needed for air conditioning during warm weather. Transpiration from tree foliage also helps to cool the ambient urban atmosphere, as does the shading of streets, lawns, and other areas. Urban trees also absorb some air pollutants (such as SO2 and particulates), help to reduce noise levels, and greatly improve outdoor aesthetics. A well-developed urban forest also provides habitat for lower-growing plants and for animals in built-up areas.
Another study in Halifax also examined the non-tree vegetation (Turner et al., 2005). In an older residential neighbourhood, 87% of the low-growing species were aliens as were 84% of the shrubs and trees. Even in a recent suburban development, which still had remnants of native habitat, 77% of the low vegetation and 69% of the woody plants were aliens. These observations are not particularly surprising in light of the results of surveys of commercial horticultural businesses in the study area, which offered few or no native plants for sale.
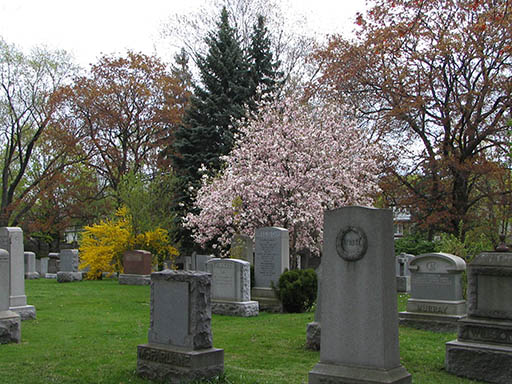
Image 25.7. Urban biodiversity can be pleasant, but it is often managed in a highly contrived manner and is dominated by alien plants and animals. Almost none of the species in this cemetery in Toronto are native to Canada. Source: B. Freedman.
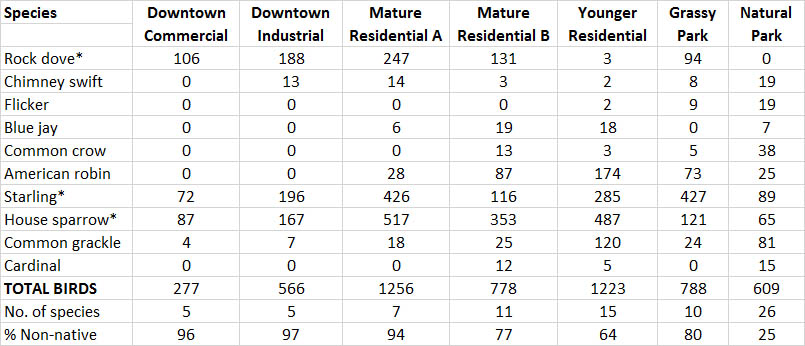
A study of birds in various Toronto neighbourhoods found that even commercial and industrial habitats sustained some species. However, about 97% of the birds in those habitats were aliens such as rock dove, starling, and house sparrow (Table 25.3). These introduced species also dominated the bird fauna of residential neighbourhoods, accounting for 64-94% of the birds present. However, the residential areas had a significant amount of habitat with abundant trees, shrubs, and other plants, which allowed some native birds to live in small numbers, including American robin (Turdus migratorius), blue jay (Cyanocitta cristata), and cardinal (Cardinalis cardinalis). Of all the habitats surveyed, only a natural-area park had a relatively low fraction of alien birds (25%). The mostly forested habitat of that park sustained 26 species of birds, most of which were not seen in the highly anthropogenic habitats. Not surprisingly, this study found that the more natural the vegetation in an urban habitat, the larger the number of native birds that was supported. Even relatively small areas of natural habitat in urban areas could sustain breeding by native birds.
Table 25.3. Density of Birds in Various Urban Habitats in Toronto. The data are the average numbers of birds observed per kilometre2 during censuses in May and June. Only the most abundant species are included. An asterisk (*) indicates a non-native species. Source: Data from Savard (1978).
Waterfowl are also abundant in urban areas with aquatic habitat, such as beside an ocean or near a lake or river. For example, many cities have wild breeding populations of “giant” Canada goose (Branta canadensis maxima), which are descended from birds that were released in those places since the 1950s. The geese find that grassy lawns near water provide suitable feeding habitat, and their population in some cities has increased enormously. However, many of these geese have lost the habit of migrating, and some people consider their abundance and year-round presence to be a nuisance. Some cities have attempted to alleviate their “over-population” of geese by capturing animals and shipping them to willing host cities elsewhere. Some cities are culling the geese by killing part of the population.
During the spring and fall migrations, some cities with aquatic habitat support large numbers of native waterfowl and other birds. Some waterfowl may remain during the winter if open water is present. Urban birders from Victoria to St. John’s often spend time viewing the numerous native ducks, geese, swans, gulls, shorebirds, and other migrating and wintering birds in local aquatic habitats. Each autumn, for example, the Toronto waterfront provides habitat for thousands of long-tailed ducks (Clangula hyemalis) that are migrating from their arctic breeding grounds. St. John’s is the only city in the world where ivory gulls (Pagophila eburnea) can be regularly seen.
Some native mammals also occur in urban habitats. Grey (black) squirrels (Sciurus carolinensis) and raccoons (Procyon lotor) may even inhabit downtown neighbourhoods as long as there is some open forest available. Urban areas with extensive shrubby and forested habitat may sustain white-tailed deer (Odocoileus virginianus), red fox (Vulpes vulpes), striped skunk (Mephites mephites), and coyote (Canis latrans). The key to sustaining populations of native animals in urban areas is to maintain as much relatively natural habitat as possible, dominated by indigenous plants. If this is done, even inner-city backyards can provide habitat for some native animals. This function is enhanced by the deliberate naturalization of urban habitats by growing native plants in horticulture (see In Detail 25.2).
In Detail 25.2. Urban Naturalization. Urban naturalization is a “new” horticultural practice that favours the use of native plants to achieve pleasing aesthetics in gardening. It is a more natural alternative to conventional horticulture, in which there is a very strong preference for the cultivation of alien plants. Naturalization avoids many of the ecological problems that are associated with growing aliens, which can become invasive and damage natural habitats and may be vectors of deadly diseases of native species (see Chapter 26).
But what is meant by terms such as “native” and “natural”? In the sense intended here, and in the context of the Americas, a native (indigenous) species is one that was present in an ecoregion before about 1500 (that is, in pre-Columbian times). If a species was introduced afterward, either deliberately or accidentally, and then developed self-maintaining populations, it would be considered “naturalized” but not indigenous (they may also be “invasive aliens” if they cause ecological damage). “Natural communities” are considered to be self-organizing, co-evolved assemblages of native species that occur in habitats that are appropriate for their survival.
Because many native plants are beautiful and can grow well in habitats provided by gardens, they can be easily used in horticulture. In fact, they may do very well because they are pre-adapted to local climate, soil, and other aspects of the habitat. They may be grown in contrived but pleasing arrangements of flowering plants, shrubs, and trees, as is commonly done in horticulture, or they may be managed to create a facsimile of a natural community.
If naturalization is used to replace conventional horticultural habitats, such as lawns and gardens that are dominated by alien species, it will result in areas being better suited to support native birds and other animals. This kind of gardening can create beautiful spaces, but it has a much softer ecological footprint. Although naturalized gardens are still uncommon, they are attracting increasing attention from people seeking to express a more natural view of their world.
Conclusions
Urban ecosystems sustain humans, associated non-native organisms, and some native species and remnants of natural habitats. However, urban ecosystems are ecological “islands” that draw upon the surrounding region to continuously supply immense quantities of natural resources and to assimilate wastes. A great challenge for urban ecologists is to develop a better understanding of the structure and function of the urban–industrial techno-ecosystem, including the exchanges of materials and energy and the factors that affect biodiversity. This knowledge can help to identify ecologically pathological relationships, which can then be mitigated to reduce the urban–industrial footprint. If this is done, then modern cities can become more ecologically sustainable than is now the case.
Questions for Review
- What changes were important in the development of urban places during the socio-cultural evolution of our species?
- What is an ecological footprint? What are its key components?
- Characterize the urban ecosystem of your community in terms of its structural (such as species and habitats) and functional (resource use, waste generation) attributes.
- What are major differences between urban and rural biodiversity?
Questions for Discussion
- Make a list of factors that are important in the ecological footprint of your community. How might these be changed in order to decrease the size of the footprint?
- Why do so few people use a bicycle as their routine means of transportation, in spite of its mechanical efficiency and low cost?
- How does your lifestyle contribute to pollution of your environment?
- Define the following terms: dumping (disposal), incineration, recycling, composting, reuse, and waste production and prevention. What role does each of these play in waste management in your community?
- What are the major practices used to treat urban sewage? Why have some cities chosen to treat their sewage in an environmentally responsible way, while others have not?
- Characterize the principal elements of urban biodiversity in your neighbourhood. How could habitats be naturalized in order to support more indigenous species?
- Use the footprint calculator provided by the Global Footprint Network (an environmental organization) to calculate your ecological footprint. (Go to http://www.footprintnetwork.org/en/index.php/GFN/page/personal_footprint/) Try doing a “virtual experiment” by varying aspects of your lifestyle in the calculator to see what effect it has on your personal footprint. For example, see what happens if you ride a bike, use public transit, or fly in an airplane.
Exploring Issues
- Your municipal government has hired you to provide advice as it seeks ways to make the community function in a less damaging, more sustainable manner. What studies would you undertake to determine ways by which urban functions (such as transportation, sewage treatment, and management of solid materials and wastes), land-use patterns, and biodiversity can be improved to contribute to the goal of sustainability? What do you think your recommendations would be?
References Cited and Further Reading
American Public Transportation Association (APTA). 2014. Public Transportation Fact Book, Appendix A: Historical Tables. APTA, Washington, DC.
Berkowitz, A.R., C.H. Nilon, and K.S. Hollweg. 2002. Understanding Urban Ecosystems. Springer Verlag, Berlin, Germany.
Breuste, J., H. Feldmann, and O. Ohlmann (eds.). 1998. Urban Ecology. Springer Verlag, Berlin, Germany.
Brinkhoff, T. 2015. Major Agglomerations of the World. http://www.citypopulation.de/world/Agglomerations.html
Environment Canada. 1996. The State of Canada’s Environment. Government of Canada, Ottawa, ON.
Environment Canada. 1999. Air Quality Trends in Canadian Cities, 1979–1992. Ottawa, ON: State of the Environment Reporting, Environment Canada. https://web.archive.org/web/20010214040646/http://www.ec.gc.ca/pdb/uaqt/aqfact_e.html
Environment Canada. 2007. Municipal population served by wastewater treatment. State of Environment Infobase Ottawa, ON. https://web.archive.org/web/20040621114650/http://www.ec.gc.ca:80/soer-ree/English/Indicators/Issues/Urb_H2O/Bulletin/uwind3_e.cfm
Environment Canada. 2014. Air Quality Indicators. Environment Canada, Ottawa, ON. http://www.ec.gc.ca/indicateurs-indicators/default.asp?lang=en&n=7DCC2250-1
Ewing, B., D. Moore, A. Ourser, A. Reed, and M. Wackernagel. 2010. Ecological Footprint Atlas 2010. Global Footprint Network, Oakland, CA. https://www.footprintnetwork.org/content/images/uploads/Ecological_Footprint_Atlas_2010.pdf
Federation of Canadian Municipalities (FCM). 2009. Waste Diversion Success Stories from Canadian Municipalities. FCM, Ottawa, ON. http://www.fcm.ca/Documents/tools/GMF/Getting_to_50_percent_en.pdf
Fincher, R. and J.M. Jacobs (eds.). 1998. Cities of Difference. Guilford Press, New York, NY.
Freedman, B., S. Love, and B. O’Neil. 1996. Tree species, biomass, and carbon storage in stands of urban forest of varying character in Halifax, Nova Scotia, Canada. Canadian Field-Naturalist, 110: 675–682.
Gill, D. and P. Bonnett. 1973. Nature in the Urban Landscape: A Study of City Ecosystems. York Press, Baltimore, MD.
Global Footprint Network. 2007. Canadian Living Planet Report. World Wildlife Fund Canada, Toronto, ON, and the Global Footprint Network, Oakland, CA. https://web.archive.org/web/20180618150932/https://www.footprintnetwork.org/content/documents/2007_Canadian_Living_Planet_Report.pdf
Holcomb, M.C. 1987. Transportation Energy Data Book, 9th ed. Oak Ridge National Laboratory, Oak Ridge, TN.
Jacobs, J. 1961. The Death and Life of Great American Cities. Random House, New York, NY.
Jacobs, J. 1969. The Economy of Cities. Random House, New York, NY.
Kreith, F. (ed.). 1994. Handbook of Solid Waste Management. McGraw-Hill, New York, NY.
Kryter, K.D. 1985. The Effects of Noise. 2nd ed. Academic Press, Orlando, FL.
Landsberg, H.E. 1981. The Urban Climate. Academic Press, New York, NY.
Langford, T.E.L. 1990. Ecological Effects of Thermal Discharges. Elsevier Science, Amsterdam, The Netherlands.
Lowe, M.D. 1989. The Bicycle: Vehicle for a Small Planet. Worldwatch Institute, Washington, DC. Nathanson, J.A. 2002. Basic Environmental Technology: Water Supply, Waste Management, and Pollution Control. 3rd ed. Prentice Hall, Upper Saddle River, NJ.
National Round Table on the Environment and the Economy (NRTEE). 1998. Greenhouse Gas Emissions from Urban Transportation: Backgrounder. NRTEE, Ottawa, ON.
Platt, R.H., R.A. Rowntree, and P.C. Muick. 1994. The Ecological City: Preserving and Restoring Urban Biodiversity. University of Massachusetts Press Amherst, MA.
Ponting, C. 1991. A Green History of the World. Sinclair-Stevenson London, UK.
Rees, W.E. 1992. Ecological footprints and appropriated carrying capacity: What urban economics leaves out. Environment and Urbanization, 4: 121–130.
Rees, W.E. 1997. Is “sustainable city” an oxymoron? Local Environment, 2: 303–310.
Rees, W.E. 2010. The Human Nature of Unsustainability. The Post Carbon Institute, Santa Rosa, CA.
Savard, J.-P. 1978. Birds in Metropolitan Toronto: Distribution, Relationships with Habitat Features, and Nesting Sites. Unpublished M.Sc. Thesis, University of Toronto.
Statistics Canada. 2006. Human Activity and the Environment. Annual Statistics 2006. www.statcan.ca/english/freepub/16-201-XIE/16-201-XIE2006000.pdf
Statistics Canada. 2006. Road motor vehicle, trailer and snowmobile registration, annual (registrations). Table 405-0001, Statistics Canada, Ottawa, ON. http://www5.statcan.gc.ca/cansim/a26?lang=eng&retrLang=eng&id=4050001&pattern=automobiles&tabMode=dataTable&srchLan=-1&p1=1&p2=50
Statistics Canada. 2012. Human Activity and the Environment, Waste Management in Canada. Statistics Canada, Ottawa, ON. http://www5.statcan.gc.ca/olc-cel/olc.action?ObjId=16-201-X&ObjType=2&lang=en&limit=0
Statistics Canada. 2017. Road motor vehicle registrations, by type of vehicle. Table 23-10-0067-01 (formerly CANSIM 405-0004), Statistics Canada, Ottawa, ON. https://www150.statcan.gc.ca/t1/tbl1/en/tv.action?pid=2310006701
Statistics Canada. 2014b. Leading causes of death, by sex. CANSIM Table 102-0561, Statistics Canada, Ottawa, ON. http://www.statcan.gc.ca/tables-tableaux/sum-som/l01/cst01/hlth36a-eng.htm Accessed November, 2014.
Timerson, B.J. 1999. A Guide to Noise Control in Minnesota. Minnesota Pollution Control Agency. Minneapolis, MN.
Transport Canada. 2012. Canadian Motor Vehicle Traffic Collision Statistics, 2004. Transport Canada, Ottawa, ON. http://www.tc.gc.ca/eng/roadsafety/tp-tp3322-2004-menu-691.htm
Transport Canada. 2017. Annual Reports: Transportation in Canada. Transport Canada Ottawa, ON. https://www.tc.gc.ca/eng/policy/anre-menu.htm
Turner, K., L. Lefler, and B. Freedman. 2004. Plant communities of selected urbanized areas of Halifax, Nova Scotia, Canada. Landscape and Urban Planning, 71: 191–206.
Wackernagel, M. and W.E. Rees. 1996. Our Ecological Footprint: Reducing Human Impact on the Earth. New Society, Gabriola Island, BC.
