Chapter 14 ~ Renewable Resources
Key Concepts
After completing this chapter, you will be able to:
- List the major classes of renewable resources and describe the character of each.
- Identify ways by which renewable resources can be degraded by excessive harvesting or inappropriate management.
- Describe the renewable resource base of Canada and discuss whether those resources are being used in a sustainable fashion.
- Show how the commercial hunts of cod and whales have represented the “mining” of potentially renewable resources.
Introduction
Renewable resources are capable of regenerating after harvesting, so their use can potentially be sustained forever. For this to happen, however, the rate of use must be less than that of regeneration – otherwise, a renewable resource is being mined, or being used as if it was a non-renewable resource.
The most important classes of renewable resources are water, agricultural soil quality, forests, and hunted animals such as fish, deer, and waterfowl. In the following sections we examine the use and abuse of these potentially renewable resources. (We previously looked at renewable sources of energy, such as hydroelectricity, solar power, wind, and biomass, in Chapter 13.)
Fresh Water
Although water is extremely abundant on Earth, about 97% of it occurs in the oceans and is too salty for many uses by organisms or the human economy. Of the remaining 3% that is fresh water, almost all occurs in glacial ice and is not easily available for use by people or other species. The “available” forms of fresh water mostly occur in the surface waters of lakes and rivers, or as groundwater in soil or rocks. These limited stocks of fresh water are a vital resource for ecosystem processes and for many of the economic activities of people.
Surface Water
Surface water is a collective term for lakes, ponds, streams, and rivers. Fresh water from these bodies can be used for drinking, cleaning, agricultural irrigation, generation of hydroelectricity, industrial cooling, and recreation. Surface waters are abundant in regions where the climate is characterized by more precipitation than evapotranspiration, which allows the aqueous resource to be recharged (see Chapter 3). However, in drier regions surface waters are uncommon or rare, and this presents a natural constraint on ecological and economic development.
In regions where there is a low rate of recharge of surface water, excessive use for irrigation or industrial or municipal purposes (such as drinking, washing, and flushing toilets) can rapidly deplete the resource. A deficiency of surface water in an arid region can lead to conflicts between local areas, and even between countries. Each region wants to have access to as much water as possible to support its agricultural and industrial activities and to service its urban areas. This is the reason why severe competition for surface water is a chronic problem in drier parts of the world, particularly in the Middle East, much of Africa, and southwestern North America.
In the Middle East, for example, the watershed of the Jordan River is shared by Israel, Jordan, Lebanon, and Syria. All of these countries have a dry climate, and all demand a share of the critical water resource. Also in the Middle East, the watersheds of the Tigris and Euphrates Rivers originate in Turkey, while Iraq and (to a lesser degree) Syria are highly dependent down-river users that are threatened by hydroelectric and agricultural diversion schemes in Turkey. In northern Africa, the watershed of the Nile River encompasses territory in nine countries: Egypt, Ethiopia, Sudan, Rwanda, Burundi, Democratic Republic of Congo, Tanzania, Kenya, and Uganda. The collective needs of those countries for water exceed the limited capacity of even that great river.
In North America, the most contentious water-use conflicts involve the Colorado River and the Rio Grande, which are shared by the United States and Mexico. The use of water from these rivers is extremely intensive, particularly for irrigated agriculture. In fact, virtually all the flow of the Colorado River could potentially be used in the United States before it even reaches northern Mexico, where there is also a substantial demand. In addition, the chemical quality of the water is degraded by inputs of dissolved salts mobilized by agricultural practices in the U.S., a factor that severely compromises the potential use of any remaining river-water flow in Mexico. Because this binational problem is important, the two federal governments have negotiated a treaty that guarantees a minimum quantity of flow and water quality where the Colorado River crosses the international boundary. The Rio Grande has a similar problem, which is also being dealt with by a treaty between the two countries.
Even where surface waters are relatively abundant, their quality can be degraded by pollution by nutrients, hydrocarbons, pesticides, metals, or oxygen-consuming organic matter. Excessive nutrients can increase the productivity of surface waters, causing a problem known as eutrophication (see Chapter 20). Biological contamination by bacteria, viruses, and parasites from fecal matter of humans, pets, or livestock can render the water unfit for drinking or even for recreation (Chapter 25). Thermal pollution, due to the release of heat from power plants or factories, can also cause ecological damage in receiving waterbodies. The effects of acidification, metals, pesticides, and eroded materials can also be an important issue for surface waters, as is examined in detail in various following chapters.
Groundwater
Groundwater occurs in underground reservoirs of water known as aquifers, in which the fluid is present in the interstitial spaces and cracks of overburden and porous bedrock (see Figure 3.2 in Chapter 3). Groundwater can be an extremely valuable natural resource, especially in regions where lakes and rivers are not abundant. It is typically accessed by drilling and pumping to the surface.
Groundwater stores are recharged through the hydrologic cycle. This happens as water from precipitation slowly percolates downward through surface overburden and bedrock in a sometimes extensive area known as a recharge zone. In humid regions, where the amount of precipitation is greater than the quantity of water that is dissipated by evapotranspiration and surface flows, the excess serves to recharge groundwater. An aquifer that quickly recharges can sustain a high rate of groundwater pumping and can be managed as a renewable resource.
In drier environments, however, the amount of precipitation available to recharge groundwater is much smaller. An aquifer that recharges extremely slowly is essentially stocked with fossil water (or paleowater) that has accumulated over thousands of years or more. Such aquifers have little capability to recharge if their groundwater is used rapidly, so their stores are easily depleted. Slowly recharging aquifers are essentially a non-renewable resource, whose reserves are “mined” by excessive use.
The largest aquifer in the world, known as the Ogalalla, occurs beneath about 450-thousand km2 of arid land in the western United States. The Ogalalla aquifer is recharged very slowly by underground seepage that mostly originates with precipitation falling on distant mountains. Most of the groundwater in the Ogalalla is fossil water that has accumulated during tens of thousands of years of sluggish infiltration. Although the aquifer is enormous (containing about 2.5 billion litres), it is being rapidly depleted by pumping at more than 170-thousand drilled wells. Most of the wells draw water for use in irrigated agriculture, and others for drinking and other household purposes. The level of the Ogalalla aquifer is decreasing by as much as 1 m/year in zones of intensive use, while the annual recharge rate is only about 1 mm/y. Clearly, the Ogalalla aquifer is being rapidly mined. Once it is effectively drained – which is likely to occur within several decades – irrigated agriculture in much of the southwestern United States may fail.
Groundwater resources are also threatened by pollution when chemicals are deliberately or accidentally discarded into the ground. For instance, groundwater may be polluted by gasoline leaking from underground storage tanks at service stations, degraded by the infiltration of agricultural fertilizer and pesticides, or contaminated by bacteria and nutrients seeping from manured fields or septic systems. Badly contaminated groundwater may not be usable as a source of drinking water, and even for the irrigation of crops.
It is important to understand that groundwater may be rendered persistently unusable as a source of drinking water if it has been contaminated by hazardous or toxic substances, such as hydrocarbons (gasoline, engine oil, or home-heating fuel), pesticides, nitrate originating with agricultural fertilizer, or Escherichia coli and other pathogens originating with the dumping of livestock manure or untreated urban sewage sludge. Because many aquifers recharge and turn over slowly, it may take decades or even centuries for these kinds of contaminants to be purged from the system. In general, the “dilution solution to pollution” does not work well when groundwater is the receiving medium. It is always precautionary to avoid activities that carry a risk of damaging the quality of water in an aquifer.
Groundwater can also be degraded by the intrusion of salt water, which can render the resource unfit for drinking or irrigation. In areas close to an ocean, deeper saline groundwater is typically overlain by a surface layer of fresh water (which is less dense than salt water and therefore “floats” above it). If fresh groundwater is withdrawn at a rate faster than the recharge capability of an aquifer, the deeper salt water will rise. Once this happens, it is extremely difficult to displace the salt water, and the ability of the aquifer to supply fresh water may have been destroyed.
Water Supply and Use
The regions of the world with the smallest per-capita water resources are Asia, Africa, and Europe, a pattern that partly reflects the high population densities of those continents. In general, Canada has abundant supplies of both surface water and groundwater. Nevertheless, water is scarce in relatively arid regions of our country, such as southern parts of the Prairie Provinces and southeastern British Columbia. There, the shortage of water for irrigation is a constraint on agricultural development, a problem that may intensify in the future, according to most climate-warming scenarios.
Groundwater is an important resource in some regions of Canada, particularly where surface water is not abundant or its chemical quality is poor. Often, groundwater is naturally cleaner than surface water and is therefore better suited for many purposes, especially household use. Sometimes, however, groundwater quality is impaired through naturally high concentrations of calcium, iron, and other chemicals.
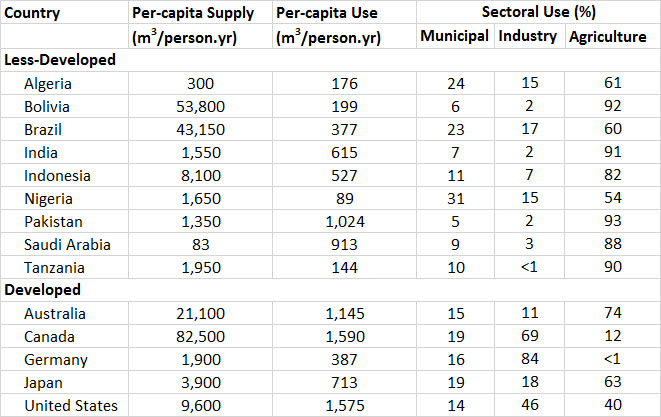
In general, national patterns of water use are influenced by the degree and kind of economic development, the population size, and amounts of rainfall. Among the less-developed nations, those that depend heavily on irrigated agriculture have a relatively water use, with agriculture accounting for more than 85% of the total (Table 14.1). However, many less-developed countries with an arid climate, such as Ethiopia, Kenya, Somalia, and others, would also benefit greatly from having more irrigated agriculture. However, these countries do not have access to sufficient water for this kind of management, so per-capita water use, even while largely agricultural, remains small.
Table 14.1. Water Supply and Use in Selected Countries, 2014. Source: Data from FAO (2014a).
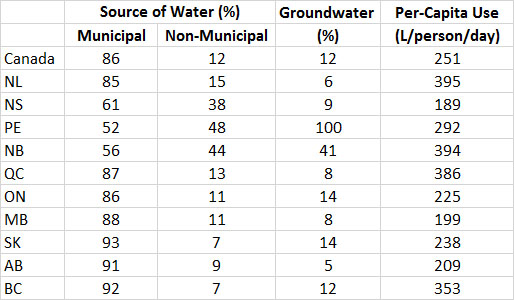
Some developed countries have rather high per-capita water use. Canada and the United States, for example, use much of their surface water for generating hydroelectricity. In addition, the western United States has invested heavily in irrigated agriculture. Canadians use about 5 billion cubic metres of water per year from both surface-water and groundwater sources. Only about 4% of that total water usage is groundwater. However, about 12% of Canadians rely on groundwater for domestic use (Table 14.2).
Table 14.2. Use of Water by Households in Canada, 2011. Municipal sources refer to a centralized facility to treat and distribute water. Non-municipal sources are almost entirely private wells. Groundwater refers to the percent of household water that is derived from this source. Per-capita use refers to households. Source: Data from Environment Canada (2011) and Statistics Canada (2013).
Water is used for myriad purposes in Canada, by all individuals as well as municipal, institutional, and industrial users. Averaged across the country, about 66% of the total water use is to cool thermal electric plants (fuelled by either fossil fuels or nuclear power), 13%, for manufacturing purposes, 11%, in municipalities (including residential use), 5%, in agriculture (mostly for irrigation), and 2%, for the mining and fossil-fuel industries (in 2005; Statistics Canada, 2013).
Within the home, about 35% of the total use of water is typically for showers and baths, 30%, to flush toilets, 20%, to do laundry, 10%, for drinking, and 5%, for cleaning (Environment Canada, 2014). The water returned to the environment after these various uses is typically degraded in quality because of the presence of various kinds of dissolved and suspended substances.
In addition, about 12% of the water used for various purposes is consumed during the process, This occurs because some of the water evaporates into the atmosphere so that the discharge of used water is smaller than the quantity initially withdrawn. This is particularly true of most agricultural uses, in which much of the applied water evaporates. This is a reason why about 58% of the water used in the Prairie Provinces is consumed during the process, compared with only 2% of that used in Ontario.
In addition, Canada manages the flow of tremendous quantities of surface water using dams and reservoirs (see Chapter 20). This is done to generate hydroelectricity, control flooding, accumulate water for irrigation, and manage municipal reservoirs. Canada has about 930 large dams (taller than 15m), of which 64% are primarily used to provide hydroelectricity; 9% are multipurpose, 9% to confine mining tailings, 6% for municipal water supply, 5% for irrigation, and 7% for other purposes (Environment Canada, 2010). There are thousands of additional smaller dams as well.
Environmental Issues 14.1. Bad Water at Walkerton
In 2000, the town of Walkerton in southern Ontario suffered a widespread outbreak of water-borne disease caused by contamination of the town’s improperly treated water-supply system. After drinking tap water supplied by the town, hundreds of people suffered the debilitating symptoms of poisoning by toxic E. coli bacteria, and seven people died.Like many towns and cities, Walkerton provides its citizens with drinking water, in this case extracted using a system of drilled wells. Unfortunately, E. coli polluted the groundwater in one of the wellfields. This was likely caused by livestock manure that had been spread on the surface of nearby agricultural fields. This practice is commonly used to discard the enormous amounts of fecal waste generated by livestock in Canada.
A subsequent inquiry discovered a remarkable combination of irresponsibility and incompetence on the part of town officials. Initially, the bacterial pollution was not detected by routine water-quality monitoring, but even when it was discovered, sensible action was not immediately taken to deal with the problem. According to the local Medical Officer of Health, officials in the Walkerton Public Utilities Commission knew about the E. coli pollution for several days before they informed the public about the hazard. Meanwhile, people continued to drink their tapwater, which resulted in hundreds of them becoming severely ill. Seven people died from their bacterial poisoning.
A post-disaster study reported that the Walkerton tragedy caused direct economic damage of about $6.9 million to the citizens and businesses of the town and decreased property values by $1.1 million. Additional economic costs included more than $9 million to fix the water system and $3.5 million spent on legal fees by the Government of Ontario. However, if the indirect costs of illness and suffering are also considered, the incident may have caused damages equivalent to $65–155 million.
Obvious lessons to be learned from the Walkerton tragedy include the need for (1) competent local maintenance and monitoring of public water supplies; (2) oversight of the local agencies by higher authorities (in this case, the Provincial Government); and (3) sensible regulation and close monitoring of the disposal and environmental effects of the enormous amounts of untreated livestock sewage that are produced in Canada.
Agricultural Resources
The production of an agricultural crop is measured in gross units, such as tonnes of wheat harvested on a farm, in a region, or in a country as a whole. The production is related to several factors, including the amount of land under cultivation and the productivity of the crop.
By comparison, the productivity is a rate function and is standardized per unit area and unit time, such as the tonnes of wheat harvested per hectare in a particular year. The productivity is related to the management system being used, plus a vital quality of the land that is referred to as site capability.
Ultimately, the amount of agricultural land in any region (and on Earth) is a limited resource. To some degree, the area of land suitable for cultivating crops can be increased by clearing the pre-existing natural forest and grassland that may be growing on fertile sites, and by draining certain kinds of wetlands. There are, however, finite areas of those kinds of natural ecosystems that are suitable for conversion into arable land. Only about 30% of Earth’s surface is terrestrial, and most of that land is too cold, hot, dry, wet, rocky, or infertile to be converted into an agricultural land-use.
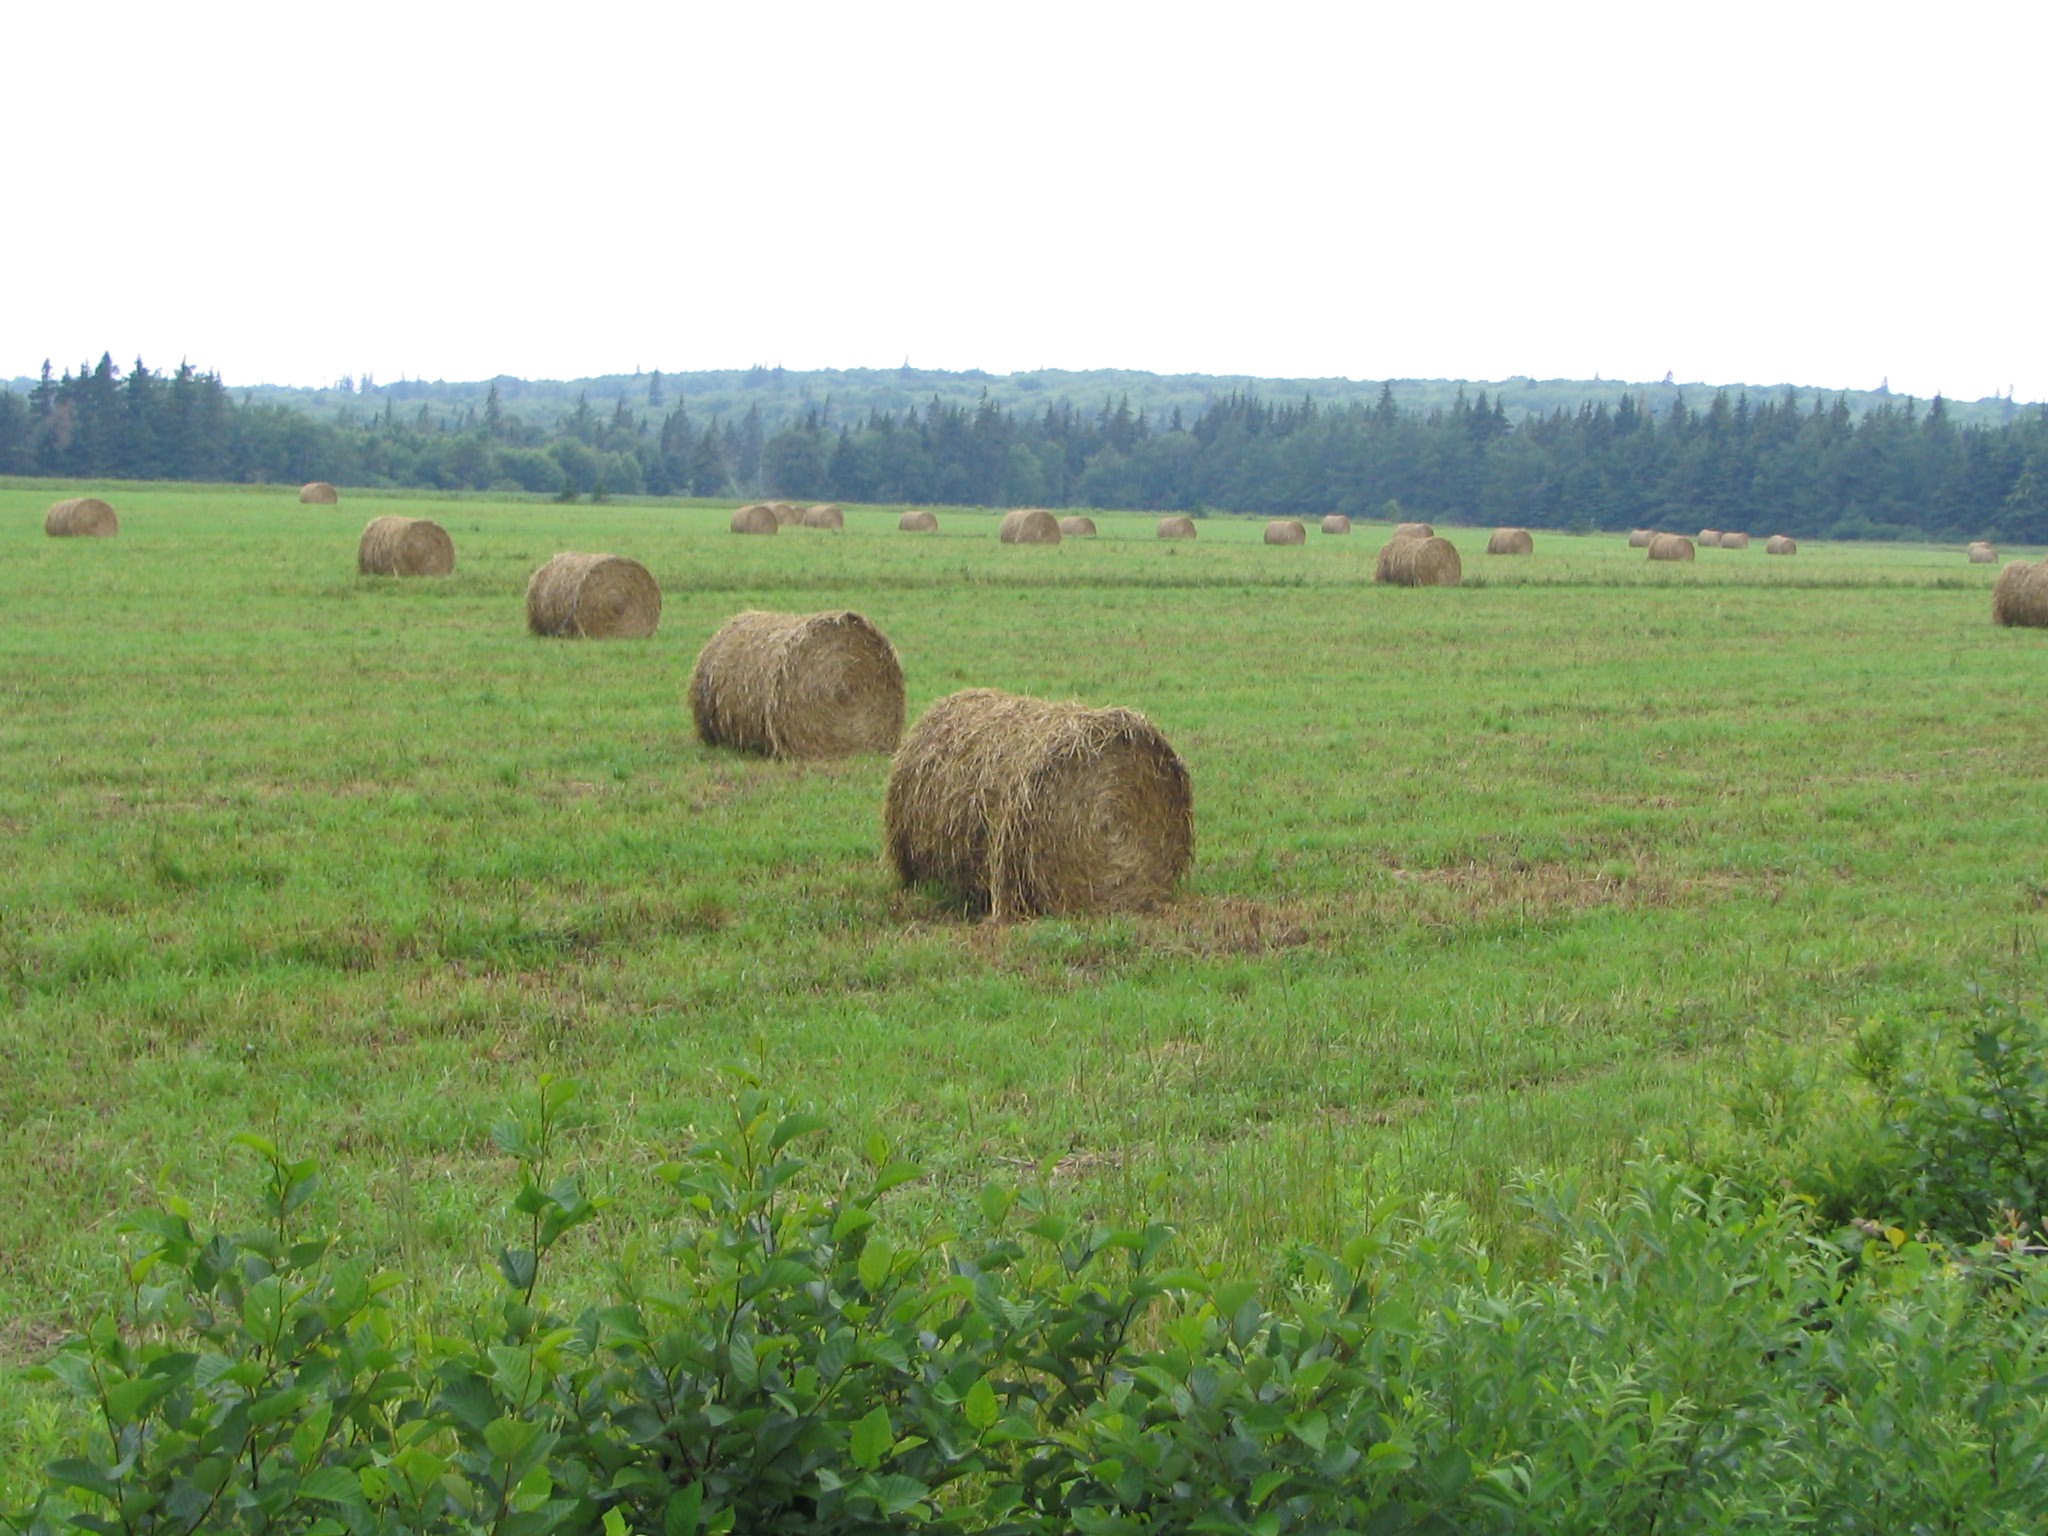
Image 14.1. Agricultural production relies on rainfall and site capability, which supply moisture, nutrients, and other factors crucial to plant growth. This is a view of a hayfield on Prince Edward Island. Source: B. Freedman.
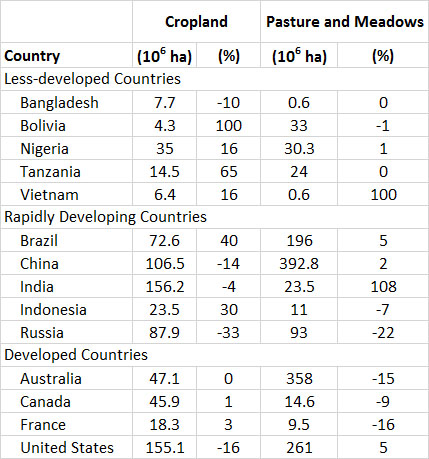
Some countries still have substantial areas of natural ecosystems that are suitable for conversion. Most of those countries are less-developed and have a rapidly growing population, and they are actively pursuing this tactic of economic development by clearing tropical rainforest, savannah, and wetlands (see Table 14.3 for examples of recent changes). Other less-developed countries have few remaining areas of natural land that are suitable for agricultural development. In spite of their rapidly growing populations, these countries have not managed to create much additional cropland in the past several decades. For instance, this is the situation of Bangladesh, China, and India.
Table 14.3. Agricultural Land in Selected Countries. Land areas are for 2012; % refers to percentage change of 2012 compared with 1993 (a positive value indicates an increase). Source: Data from FAO (2014b).
Most wealthier countries are not developing much additional agricultural land, largely because their areas with good potential are already being used. In fact, many developed countries have taken a great deal of land out of agricultural use since about 1980. The land withdrawals have occurred for two major reasons: (1) to reduce the production of certain crops, which keeps their prices relatively high, and (2) to conserve environmental quality through less intensive use of marginal land that is prone to erosion and other kinds of degradation. In addition, some high-quality agricultural land has been lost to urbanization in most developed countries, including Canada.
Site Capability
Agricultural site capability (or site quality) can be defined as the potential of an area of land to sustain the productivity of agricultural crops. Site capability is a complex ecological quality that depends on nutrients, organic matter, and moisture in the soil, plus additional factors that affect the productivity of crops. These factors are influenced by climate and drainage, by the vigour of ecological processes such as decomposition and nutrient cycling, and by the kinds of microbial and plant communities that are present.
Site capability is extremely important to the productivity of agricultural systems, and therefore to the production and availability of food. Because the beneficial qualities of cultivated land can be maintained and even improved by the use of appropriate management practices, site capability represents a potentially renewable resource. However, it can also be degraded by certain agricultural practices (see Chapter 24).
Ultimately, site capability for agriculture depends on seven interrelated factors: soil fertility, organic matter, bulk density (including compaction), resistance to erosion, moisture status, salinization, and the abundance of weeds. These factors are examined below:
Soil fertility is related to the ability of an ecosystem to supply the nutrients that are needed to sustain the productivity of a crop. Especially important are the sources of nitrogen, particularly inorganic forms such as ammonium and nitrate, as well as phosphate, potassium, calcium, magnesium, and sulphur. Soil fertility is influenced not only by the amounts of these nutrients, but also by factors that affect their availability to plants, such as:
- the cation exchange capacity, or the degree to which positively charged ions (these are cations) of such nutrients as ammonium (NH4+), potassium (K+), and calcium (Ca2+) are bound by soil
- the anion exchange capacity, which is related to the binding of negatively charged ions (anions) such as nitrate (NO3-), phosphate (PO43–), and sulphate (SO42–)
- soil acidity or alkalinity, which are usually measured as pH, and affect the solubility of many nutrients as well as key aspects of microbial activity
- the rate of oxidation of organically bound nutrients into inorganic compounds that plants can take up and use more effectively in their nutrition
- the enhancement of nutrient availability through the addition of agricultural fertilizer or other practices
For example, consider the process of nitrification (see Chapter 5), an important function that is performed by certain bacteria and that transforms ammonium into nitrate. The rate of nitrification is greatly decreased in soil that is acidic or waterlogged, which results in much less availability of nitrate to crops. Soil fertility is also degraded if excessive amounts of nutrients are removed when crops are harvested, and also by the compaction of soil, depletion of soil organic matter, waterlogging, and acidification.
Soil organic matter consists of plant debris and humified organic material. Organic matter contributes to the ability of soil to form a loose, crumbly structure called tilth. Soil with good tilth is well aerated, allows plant roots to grow freely, and retains moisture, all of which are important factors that affect crop growth.
In addition, some nutrients are components of soil organic matter. These organically bound nutrients are slowly released for plant uptake through the process of decomposition, which in this respect can be viewed as a natural, slow-release, organic fertilization. Organic matter in the soil also helps to retain ionic forms of nutrients through cation and anion exchange capacity. Intensive cropping with insufficient return of crop residues typically results in a loss of soil organic matter and degradation of the valuable ecological services it provides.
Bulk density of soil (its weight per unit volume) has a large effect on tilth and drainage. It is generally preferable to have a low bulk density, but this can be degraded by the loss of soil organic matter and by compaction caused by the repeated passage of heavy machinery, especially when fields are wet. Soil that has been degraded by compaction may become wetter, lack oxygen, and have impaired nutrient cycling and poor root growth. These changes can result in a substantial decrease of productivity.
Resistance to erosion is degraded when soil is left without a cover of vegetation or crop residues during the winter, when contour ploughing is not practiced (such as when cultivation runs down a slope rather than along it), and when steep terrain is tilled. In contrast, sites are resistant to erosion if they are well vegetated, have good tilth, are flat, and the climate is not excessively wet or windy. In effect, erosion represent an important problem because it is a loss of soil mass, which occurs as particles are carried away by the forces of wind or running water. Any agricultural practices that increase the rate of erosion should be viewed as a mining of soil capital. In severe cases, erosion can strip away the relatively fertile, surface horizons of the soil. In the worst cases, bedrock may be exposed and the land is forever ruined for agricultural use.
Moisture status is another important aspect of site capability. In general, an intermediate moisture status (referred to as mesic) is preferred for the growth of most crops. Excessively dry (xeric) sites will produce a small yield, and crops may perish from drought. In contrast, excessively wet (hydric) sites tend to have cool soil with little or no oxygen present, which are conditions that are stressful to most crops.
The moisture status of sites is largely affected by climatic factors, especially the rates of precipitation and evapotranspiration. Soil moisture is also affected by the drainage characteristics – coarse-grained soils may drain too rapidly and have little ability to hold moisture, while heavy clay soils may not drain well enough, retaining water close to the surface. Soils with good tilth tend to have a degree of drainage midway between these extremes.
Salinization refers to the accumulation of various kinds of salts in the soil, particularly excessive amounts of sodium, magnesium, potassium, chloride, or sulphate. These and other salts are present in irrigation water and in certain kinds of fertilizer and they remain behind when water evaporates to the atmosphere. Salinization is a common problem in agricultural fields that are irrigated but do not have enough drainage to carry the salts downward into the soil and away, causing them to accumulate at the surface.
The abundance of weeds is important because when abundant, they provide too much competition for crop plants. The term “weed” can be defined as plants that are judged to be interfering with some human purpose (see Chapter 22). An increased abundance of weeds may be caused when a particular species of crop is cultivated in a continuous fashion, without rotation with other crops. An excessive abundance of weeds is commonly managed by tilling the soil and/or by using herbicide. In addition, a buildup of weed populations can be avoided by rotating crops and by using other management practices that provide less favourable conditions for the unwanted plants.
Degradation of Site Capability
Over the longer term, intensive agricultural management can result in a degradation of site capability. When this happens, the productivity of crops decreases, and in severe cases the land may no longer be suitable for agricultural use. Fortunately, such damage can often be avoided or repaired by changing the management system. For example, inorganic fertilizer may be applied to the soil in an attempt to compensate for declining fertility. Organic soil conditioners, such as compost and manure, can also be added to mitigate losses of organic matter, thereby helping to maintain the fertility and tilth of soil. In other cases, pesticides may be used to try to manage weeds and other pests. These management options are, however, intensive in their use of material and energy resources, and they may cause additional damage to the site and nearby ecosystems. Ultimately, truly sustainable agricultural systems involve the use of management strategies that conserve site capability while minimizing the use of nutrients, pesticides, and non-renewable sources of energy (see the section on Organic Agriculture in Chapter 24).
Production and Management
In 2014, more than 7.3-billion people were alive, and almost all were reliant on agricultural crops as their prime source of food. There are also relatively minor amounts of food that are harvested from the wild, such as by fisheries, but agricultural production is responsible for the great bulk of the modern human diet.
In addition, our associated domestic animals largely depend on the production of agricultural crops. The numbers of livestock are actually greater than those of people, including about 1.5-billion cows, 1.5-billion sheep, 1.2-billion goats, 1.0-billion pigs, and 22 billion chickens (Chapter 10). Although some of these domestic livestock forage on wild plants in unbroken pastures (which have not been seeded to agricultural forage plants), many are fed grain and hay that has specifically been grown for them. In fact, about 40% of the global production of grain is fed to livestock. Eventually, food products derived from the livestock are eaten by people, who are secondary consumers (and top predators) in this part of the agricultural food chain.
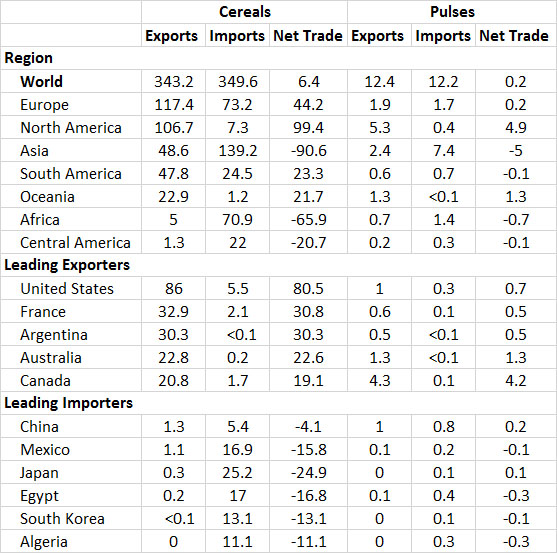
If a country has an excess of agricultural production over domestic consumption, then it has a surplus available for export, while those with a deficit must import some of their food (Table 14.4). In general, the greatest food-exporting nations have a relatively developed economy. Although many poorer countries export certain foods such as coffee, palm oil, sugar, tea, and other cash crops, most less-developed countries have food deficits or are only marginally self-sufficient. The food deficits must be made up by expensive purchases of food that was grown elsewhere or by donations from wealthier countries (the latter is known as food aid).
Table 14.4. International Trade of Agricultural Produce. Net trade is calculated as exports minus imports. A positive number is a net export, and a negative one a net import. Cereals include maize, rice, sorghum, and wheat. Pulses are legumes, such as peas, beans, and soybeans. Regions and countries are listed according to decreasing exports of cereals. Data are for 2011 and are in 106tonnes per year. Source: Data from FAO (2014b).
In terms of the gross food value provided to people, the world’s most important crops are cereals, such as barley, maize, rice, sorghum, and wheat. Also important, but secondary, are tuber crops, such as cassava, potato, sweet potato, and turnip. In any country, the total production of cereals plus other crops is a function of the amount of land devoted to the cultivation of those species, multiplied by the average productivity.
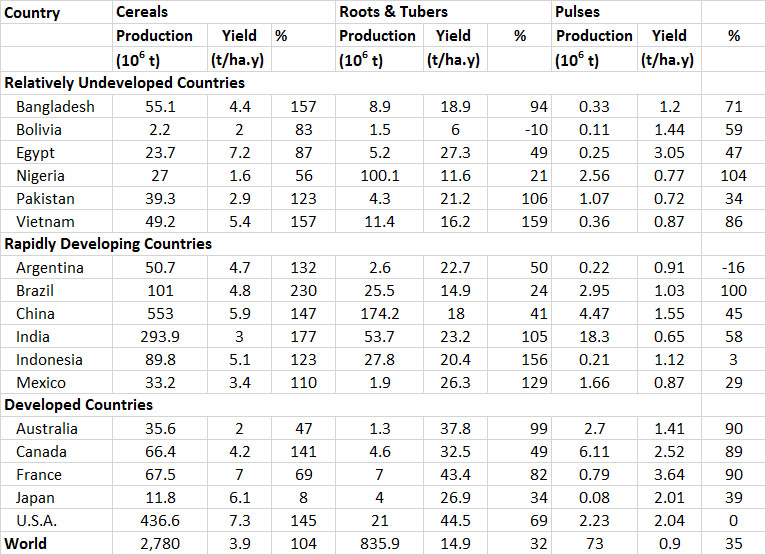
Productivity (or yield, typically measured in tonnes of crop harvested per hectare per year) reflects the combined influences of site capability and the kind of management system that is being used. In agriculture, management practices are intended to mitigate some of the constraints that are limiting crop productivity, including those associated with site quality, inclement weather, insect infestations, weeds, and diseases. The productivity of cereals and other crops varies greatly among countries, but it is not necessarily lower in less-developed than in more-developed ones (Table 14.5). Although wealthier countries use highly mechanized management systems with inputs of fertilizer, pesticides, and sometimes irrigation water, less-wealthier countries may also use intensive management systems, albeit ones that depend more strongly on human and animal labour and with smaller material inputs.
Table 14.5. Agricultural Production in Selected Countries. Data are for 2013; % refers to the percentage change in yield between 1974 and 2013. Source: Data from FAO (2014b).
Note also that Table 14.7 also has data that shows how the yield of crops has increased over the past four decades (from 1974 to 2013; note that a 100% increase means there was a doubling of yield). The increases in productivity are rather impressive, and are due to crop varieties that have been selectively bred to respond well to intensive management systems, as well as to increased use of management practices such as the use of fertilizer, pesticides, and irrigation. The improved rates of yield have been key to increased rates of agricultural production during the same period. Of course, many of the benefits of increased agricultural production have been absorbed by large increases in population, especially in less-developed countries.
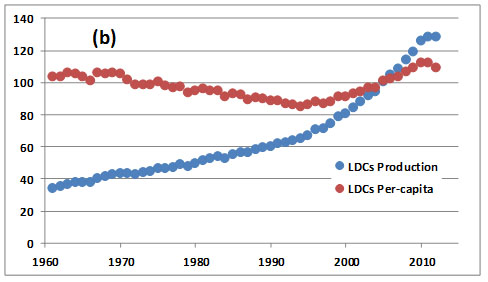
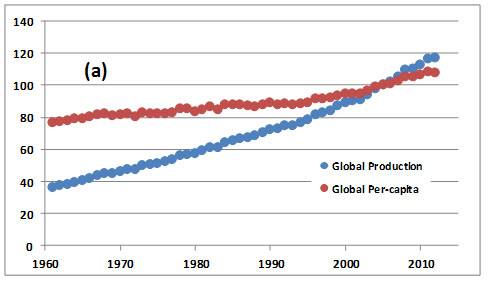
These trends are also shown by indicators of food production that are compiled by the Food and Agriculture Organization of the United Nations (Figure 14.1). The index is a composite indicator that takes into account the production of all important crop species, with the data being expressed relative to the base period 2004-2006 (for which the value is set to 100). The index covers all edible agricultural products and is a price-weighted summation measured in constant dollars, so that inflation is not an issue. Therefore, the index shows whether agricultural production has increased (> 100) or decreased (< 100) during the time period, both on a total and per-capita basis.
The global data show a strong and steady increase of overall agricultural production from 1961 to 2012, although the increase is much more moderate in the per-capita data (Figure 14.1a). In other words, most of the increase in global agricultural production during the past half-century has been eroded (on a per-capita basis) by population growth. Not surprisingly, this pattern is even more striking in the data for the least-developed countries, which show little improvement in per-capita food production over the period.
These observations suggest that there is a food “treadmill”, in which increases in food production, obtained by converting natural habitats and adopting more intensive management practices, are being mostly offset by population growth. The metaphor of a treadmill is apt in this case, because on that sort of running machine a great deal of effort is expended, but the runner stays in about the same place.
Figure 14.1. Changes in two indicators of agricultural production. The production index data (a), as well as the per-capita index (b), are relative to the period 2004-2006, which are set to a scale of 100. Separate graphs are shown for global values and least-developed countries. Source: Data from FAO (2014b).
It is important to understand that high yields that are obtained by the use of intensive agricultural systems are heavily subsidized by large inputs of non-renewable resources. For example, the most important agricultural fertilizers are inorganic compounds of nitrogen, such as urea or ammonium nitrate, both of which are manufactured using natural gas. The second- and third-most important fertilizer nutrients are compounds of phosphate and potassium, which are produced from mined minerals. In addition, most pesticides are manufactured from petrochemicals, using energy-intensive technologies. Moreover, the mechanization of agricultural systems involves the use of tractors pulling heavy equipment for tilling, harvesting, and other purposes. The manufacturing of these machines requires large amounts of non-renewable energy and materials, such as metals and plastics. Furthermore, the machines run on non-renewable fuels, such as gasoline or diesel.
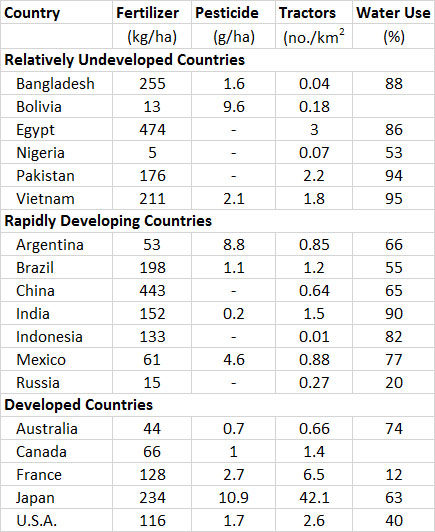
Table 14.6 compares indicators of the intensity of agricultural management among selected countries. There is great variation among countries, with some less-developed ones using practices that are intensive as some developed ones. In general, however, the intensity of management is greater in wealthier countries, with greater use of fertilizer and pesticide, more mechanization, and larger more industrial farms.
Table 14.6. Intensity of Agricultural Management in Selected Countries. Fertilizer data are combined applications of inorganic nitrogen, phosphorus, and potassium fertilizer (for 2012). Pesticide data combined applications of insecticide, herbicide, fungicide, and bactericide (for 2011, or the most recent year for which there were data). Tractor data are for 2011 or most recent. Water use is the percent of total withdrawals that are used for agriculture. Source: Data from FAO (2014b).
As was just noted, some agricultural systems used in less-developed countries are quite intensive and result in high yields. For example, in many humid tropical countries, rice is cultivated using a system known as paddy. Although some paddy-rice agriculture has been mechanized, it is often carried out on smaller-scale family farms. Typically, water buffalo are used to plough and till the dyked, flooded fields (each of which is a paddy). People then hand-transplant young rice plants, weed the crop with hoes, and eventually harvest by scything and gathering sheaves of the plant stalks. In places with evenly spaced precipitation through the year and naturally fertile soil, such as parts of Java, Sumatra, and the Philippines, as many as three rice crops can be grown each year. This non-mechanized paddy system can achieve high yields with relatively small inputs of inorganic fertilizer or pesticide.
Other agricultural systems used in less-developed countries are much less productive than paddy rice, generally because of suboptimal rainfall and less fertile soil. The least productive systems are used in semi-arid regions. Under such conditions, it is not possible to cultivate many plant crops. However, livestock such as camels, cows, goats, and sheep can roam extensively over the landscape, harvesting the sparse production of native forage. The dispersed plant biomass of semi-arid ecosystems is too small in quantity and too poor in nutritional quality for direct harvesting and use by people. However, grazing livestock are able to convert the poor-quality forage into a form (such as meat or milk) that people can utilize as food.
Increasingly, the agricultural systems used in less-developed countries are becoming more intensive in their management. In this sense, they are rapidly proceeding toward the kinds of systems used in developed countries. Indicators of this change include increasing use of fertilizer, pesticides, and mechanization. Another indicator is the increasing size of farm holdings, which occurs as the agricultural activities become commercialized and owned by large companies. These changes have resulted in increasing yields in many less-developed countries over recent decades (see Table 14.7). These increases of productivity are largely due to the cultivation of “improved” varieties of crop plants as well as the adoption of intensive agricultural practices.
The industrialization of agricultural production in these countries also results in important social changes. Of particular importance is the rapid amalgamation of small family farms into larger commercial units. This results in the displacement of many poor people from agricultural livelihoods. These economic refugees then migrate to towns and cities, which causes the rate of urbanization to be much faster than what would be expected from population growth alone.
Agriculture in Canada
Canada is one of the world’s great agricultural nations and a major contributor to the international trade in food. Canada’s production of cereals was 66-million tonnes in 2013, which ranked 8th in the world and comprised 2.3% of the global production (FAO, 2014). In that same year Canada exported 21 x 106 t of grain, which ranked 5th in the world.
The gross domestic product (GDP) associated with agricultural production is about $22-billion, of which 73% is crops and 27% livestock (in 2011; Statistics Canada, 2014a). Canadian exports of agricultural products in 2011 had a value of $41-billion, and imports $31-billion, for a net trade surplus of $10-billion for the agricultural sector (FAO, 2014).
At the beginning of the twentieth century, more than 80% of the Canadian labour force was employed in agriculture. At the time, farming mostly relied on animal and human labour as sources of energy for cultivation and harvesting. Most farms were relatively small, family-operated enterprises, run mainly as subsistence operations to produce food and other crops for use by the family. Any surplus production was traded in local markets for cash or manufactured goods. The agricultural surplus was eventually sold in Canadian cities or exchanged internationally by traders. Much of today’s agricultural activity in less-developed countries still has this sort of socio-economic character.
Today, however, most Canadian agriculture involves highly mechanized, industrial operations. Only about 2.2% of the national workforce is employed in farming (in 2011; Statistics Canada, 2014b). Virtually all cultivation, harvesting, and processing is accomplished by large fossil-fuelled machines. Tractors haul cultivating, seeding, and spraying machines, and self-contained harvesters harvest and process crops. Canadian farmers use about 733-thousand tractors (in 2008; FAO, 2014).
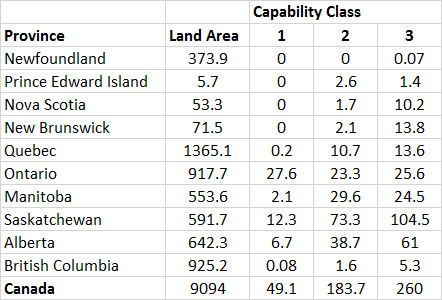
Canada has an immense land base, some 10-million km2, making it the second-largest country in the world (after Russia). However, the area suitable for agriculture is largely confined to southern parts of the country. The ability of land to support agricultural uses is categorized by a system known as the Canada Land Inventory. The distribution of the most productive lands for agriculture is shown in Table 14.7.
Table 14.7. Distribution of Class 1–3 Land in Canada. Soil capability classes 1-3 are suitable for the cultivation of crop species, with 1 being best and 3 less so. Classes 4 and 5, used for pasture or rough grazing, are not reported here. Not all of the high-quality land is used for agriculture – some has been converted to urban and suburban land-uses. Data are expressed in 103 km2. Source: Data from Hoffman et al. (2005).
Most of the highest-capability land is located in southern regions of Canada, where the growing season is relatively long and moist, and on sites with relatively flat terrain and fertile soil. Southern Ontario, for example, has 56% of the class-1 land in Canada, while Saskatchewan has 25%; Alberta, 14%; and Manitoba, 4%. Unfortunately, some of the best-quality land has been lost to urbanization, which swallowed up 7,400 km2 of prime agricultural land between 1971 and 2001, more than doubling the total amount lost to this process (Hoffman et al., 2005). In total, more than 7% of class-1 agricultural land has been converted. This loss of the best agricultural land has serious consequences for the production of crops, particularly high-value ones such as soft fruits in the Niagara region of Ontario and the Okanagan Valley of southern British Columbia.
As was previously examined, the quality of land for agriculture is influenced by such factors as soil fertility, organic matter concentration, drainage, and the abundance of weeds. All of these qualities can be degraded by inappropriate land management. It is important to monitor changes in these site factors over time, in order to track changes in the sustainability of agriculture. Unfortunately, suitable monitoring data do not yet exist in most areas, although programs are being designed.
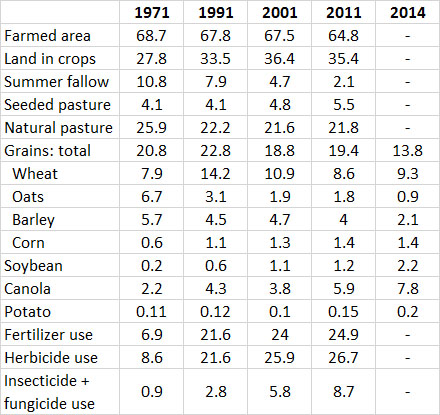
There are, however, some general indications that soil fertility and other site factors are declining in quality over much of the agricultural land base. For example, in order to maintain the productivity of many agroecosystems, large amounts of fertilizer and soil conditioners must be added to the system. Similarly, herbicide, insecticide, fungicide, and other pesticides must be used to manage pests (see Chapter 22). The need to use intensive management practices to maintain productivity could, in itself, be considered a symptom of unsustainable stress on the agroecosystem. In addition, most fertilizers, pesticides, and their mechanized application systems are based on the mining and use of non-renewable resources, which representing another element of non-sustainability (see also Chapter 24).
Huge amounts of fertilizer are used to increase crop productivity in Canada. In 2011, fertilizer was applied to 25 million hectares of farmland, more than a three-fold increase over 1971 (Table 14.8). In 2013, agricultural land was fertilized with 2.5-million tonnes of nitrogen and 0.9 million tonnes of phosphate. Compared with rates of fertilizer use in 1970, these represent increases of about 10-fold and 3-fold, respectively.
Table 14.8. Agricultural Land-Use and Crops in Canada. Data are in millions of hectares (106 ha). Data from Statistics Canada (2014c).
The use of pesticides to deal with insect pests, weeds, and fungal pathogens is also intensive in Canadian agriculture. In 2011, herbicide was applied to 25-million hectares of farmland, representing a three-fold increase over 1971 (Table 14.10). Insecticide was applied to 3.2-million hectares and fungicide to 5.5-million hectares, together representing a 9-fold increase over 1971.
Canadian agricultural systems also utilize crop varieties that have been selectively bred to increase their potential productivity and resistance to pests and pathogens, to respond vigorously to fertilizer addition and other intensive management practices, and to grow well under regional climatic regimes. This is not to say that these varieties are optimally adapted to intensively managed agroecosystems. New pests and diseases often develop, so the crop-breeding industry must continuously respond to changes in ecological conditions.
Overall, the intensification of industrial agriculture has greatly increased the production of crops in Canada. Similarly large increases in production have been accomplished in other countries that have adopted intensive and mechanized agricultural systems. This includes the United States, most countries of Western Europe, and, increasingly, Brazil, China, India, Russia, Ukraine, and other rapidly developing countries. Increases in agricultural production have been accomplished mainly through intensified management and the cultivation of improved crop varieties, rather than by increasing the areas of cultivated land.
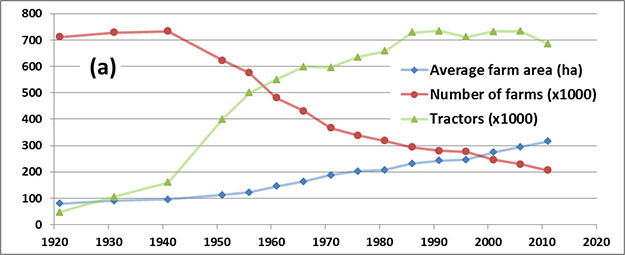
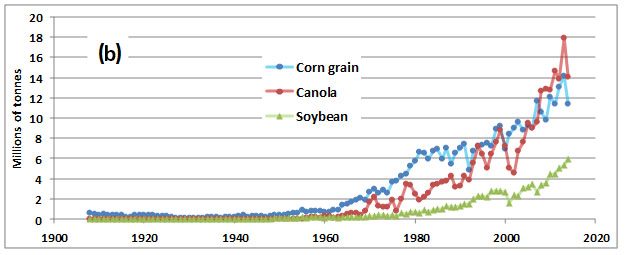
About 65-million hectares of land are cultivated on 206,000 farms in Canada (2011 data). This area is equivalent to about 7% of Canada’s landmass. Over time, however, the number of farms has decreased markedly, even while their average area has increased (Figure 14.2a). Farming has also become greatly intensified in Canada, in terms of mechanization and the use of fertilizer and pesticides. In recent years, the largest production and areas of crops have been wheat (27 x 106 t in 2014), canola (14 Mt), corn (maize; 12 Mt), barley (7 Mt), and soybean (6 Mt) (Figure 14.2b,c). In addition, new crops have been introduced to Canada and are grown over large areas, especially canola (oil rapeseed), lentils, soybeans (Figure 14.2b).
Animal husbandry has also become intensive in Canada. Most production of chickens, cows, and pigs now occurs on so-called factory farms. This is an industrial system that involves raising livestock indoors under densely crowded conditions. The livestock are fed to satiation with nutritionally optimized diets, while diseases are managed with antibiotics and other medicines. Productivity may be enhanced with growth hormones (see Chapter 24).
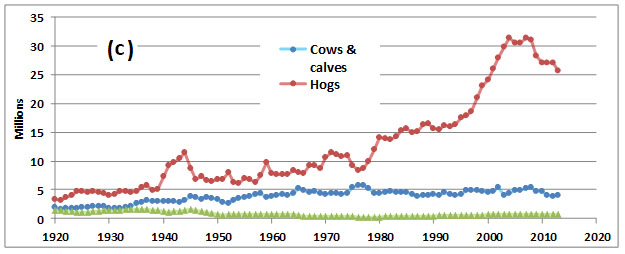
More than 167-million chickens are raised annually for meat and eggs on Canadian farms, most of them in operations of an industrial scale and intensity (Statistics Canada, 2014f; FAO, 2014b). As well, more than 8-million turkeys are raised, mostly on factory farms. Larger livestock include about 16-million cows (including 2-million milk cows), 26-million pigs, 0.8 million sheep, and 0.9 million horses. Dairy cows and pigs are raised mostly on factory farms. Most beef cows spend part of their lives grazing outdoors in pastures or on semi-natural prairie. However, prior to slaughter, most of the animals are rounded up and then kept in crowded feedlots, where they are well fed so that they can gain weight rapidly. Sheep, goats, and horses are raised under less intensive conditions.
Figure 14.2. Historical Changes in Agricultural Activity in Canada. (a) The number and size of farms and tractors as an indicator of mechanization ; (b) production of select crops; (c) livestock slaughtered. Source: Modified from Statistics Canada (2006). Source: Data from Statistics Canada (2014e).
In overview, it is clear that since the beginning of the 20th century there has been an enormous increase in agricultural production. This has fed similarly rapid increases in the global populations of people and domestic animals. The rapid intensification of agriculture is, however, substantially dependent on the use of non-renewable sources of energy and materials, a fact that challenges the sustainability of the production systems. Moreover, intensive agricultural systems cause important damages to the environment, many of which are examined in later chapters, especially in Chapter 24.
Canadian Focus 14.1. Weather Extremes and Agriculture
Climatic factors, such as heat, wind, and soil moisture, have an important influence on agricultural production. Harvests can be bountiful when climatic conditions are good, but if they occur as extreme events, crops can be wiped out. For instance, periods of extended dry conditions, or drought, are occasionally present in the Prairie region, where large areas have only a marginal availability of soil moisture for key crops such as wheat and canola (Agriculture Canada, 2014; Canada History, 2013).The most devastating period of drought during the past century occurred from 1929 to 1937, when low precipitation and over-cultivation of prairie soil caused the land to turn to a fine dust that blew away during windstorms. The dust accumulated as dunes and windrows, covering roads and buildings and making life difficult or impossible for many rural people in the affected regions. Since then, the precipitation regime has been more moderate and there has been a widespread adoption of soil-conservation practices, such as planting lines of trees and windbreaks, fallowing of fields as part of a crop rotation, and additional measures.
Nevertheless, events of severe drought continue to occur in the prairie region. For example, during 2001 much of western Canada experienced some of the driest growing conditions ever recorded. Large southern regions of Alberta, British Columbia, and Saskatchewan had record-low precipitation and severe drought. This resulted in widespread decreases in yield and even crop failures in the drought-stricken areas. Drought was also severe in 2002, although the most severely stricken areas were further north, in central Alberta and nearby Saskatchewan. In the southernmost Prairie Provinces, where drought was most severe in 2001, moisture was normal or better in 2002. Drought has been generally less of a problem since those years.
Years of severe drought have a destabilizing influence on the agricultural economy of the Prairie region. In 2002, owing to the cumulative effects of three consecutive years of poor spring runoff (due to below-average snowfall) and sparse precipitation during the growing season, the amount of forage available in drought-stricken areas was critically low. Many ranchers had to sell off most or all of their cattle, including vital breeding stock, because they were unable to grow enough forage to feed their animals and were unable to pay the high cost of importing feed.
The production of crops was also hard hit. The national production of non-durum wheat, which is mostly grown in the Prairie Provinces, was only 12-million tonnes in 2002, compared with 18-million tonnes in 2001 and 21-million tonnes in 2000 (an overall 44% decrease). The production of canola was also markedly down, from 7-million tonnes in 2000 to 5-million tonnes in 2001 and 3-million tonnes in 2002 (a 55% decrease). Although Canada is normally an exporter of grain to global markets, in 2002 we imported wheat from Russia.
Farmers have a number of management options available to them during periods of drought. For instance, they can practice summer fallow, a practice in which the land is not cultivated in some years in order to conserve its vital soil moisture. Farmers can also choose to grow crops that are relatively tolerant of drought, such as field-pea or wheat. If surface water or groundwater are available, irrigation may be an option.
The practice of agriculture has always been somewhat risky in the Prairie region, and farmers can suffer terribly from the economic and emotional damage of drought. During such times, it is essential that affordable crop insurance and other means of financial support be available to the agricultural community. This should, in fact, be a national priority – all Canadians are fed by the produce grown by farmers, and we must share with them the consequences of the ecological and economic risks inherent in their agricultural enterprise.
Forest Resources
Forests of various kinds are extremely important terrestrial ecosystems. They cover extensive areas of the surface of Earth, and fix and store huge amounts of biomass. The global cover of forest is about 40-million km2, of which 56% is in temperate and boreal regions and 44% in tropical regions (2012 data; FAO, 2014b). The present forest area is about half of what it was before humans began to cause deforestation about 10-thousand years ago, mostly to develop agricultural land. Although temperate and boreal forests now cover an area comparable to the tropical forest, their production is only about half as large, and they store only 60% as much biomass. There are also another 3-billion hectares of open woodlands and savannah. The most heavily forested regions are in North and South America, Europe, and Russia, all of which have more than 30% forest cover.
Worldwide, an immense area of about 25 million hectares of forest is cleared or harvested each year. Tree biomass is harvested for three major reasons:
- as a fuel for subsistence, that is, to burn as a source of energy for cooking and warmth
- as an industrial fuel, used to generate electricity or to produce steam or heat for a manufacturing process
- as a raw material to manufacture lumber, paper, composite materials such as plywood and waferboards, and other products, such as synthetic rayon and celluloid In addition, forests may be cleared not so much for their biomass, but to create new agricultural or urbanized land. These longer-term ecological conversions result in deforestation, which is a permanent loss of forest cover.
The net primary production of global forests has been estimated to be about 49-billion tonnes per year, of which an extraordinary 28% is used by humans (Vitousek et al., 1986). Human use can be divided into the following categories:
- short-term clearing of forests for shifting cultivation in less-developed countries (45%)
- more permanent conversion of forests to agricultural land-uses (18%)
- harvesting of tree biomass (16%)
- productivity of trees in plantations (12%)
- loss during harvest (9%)
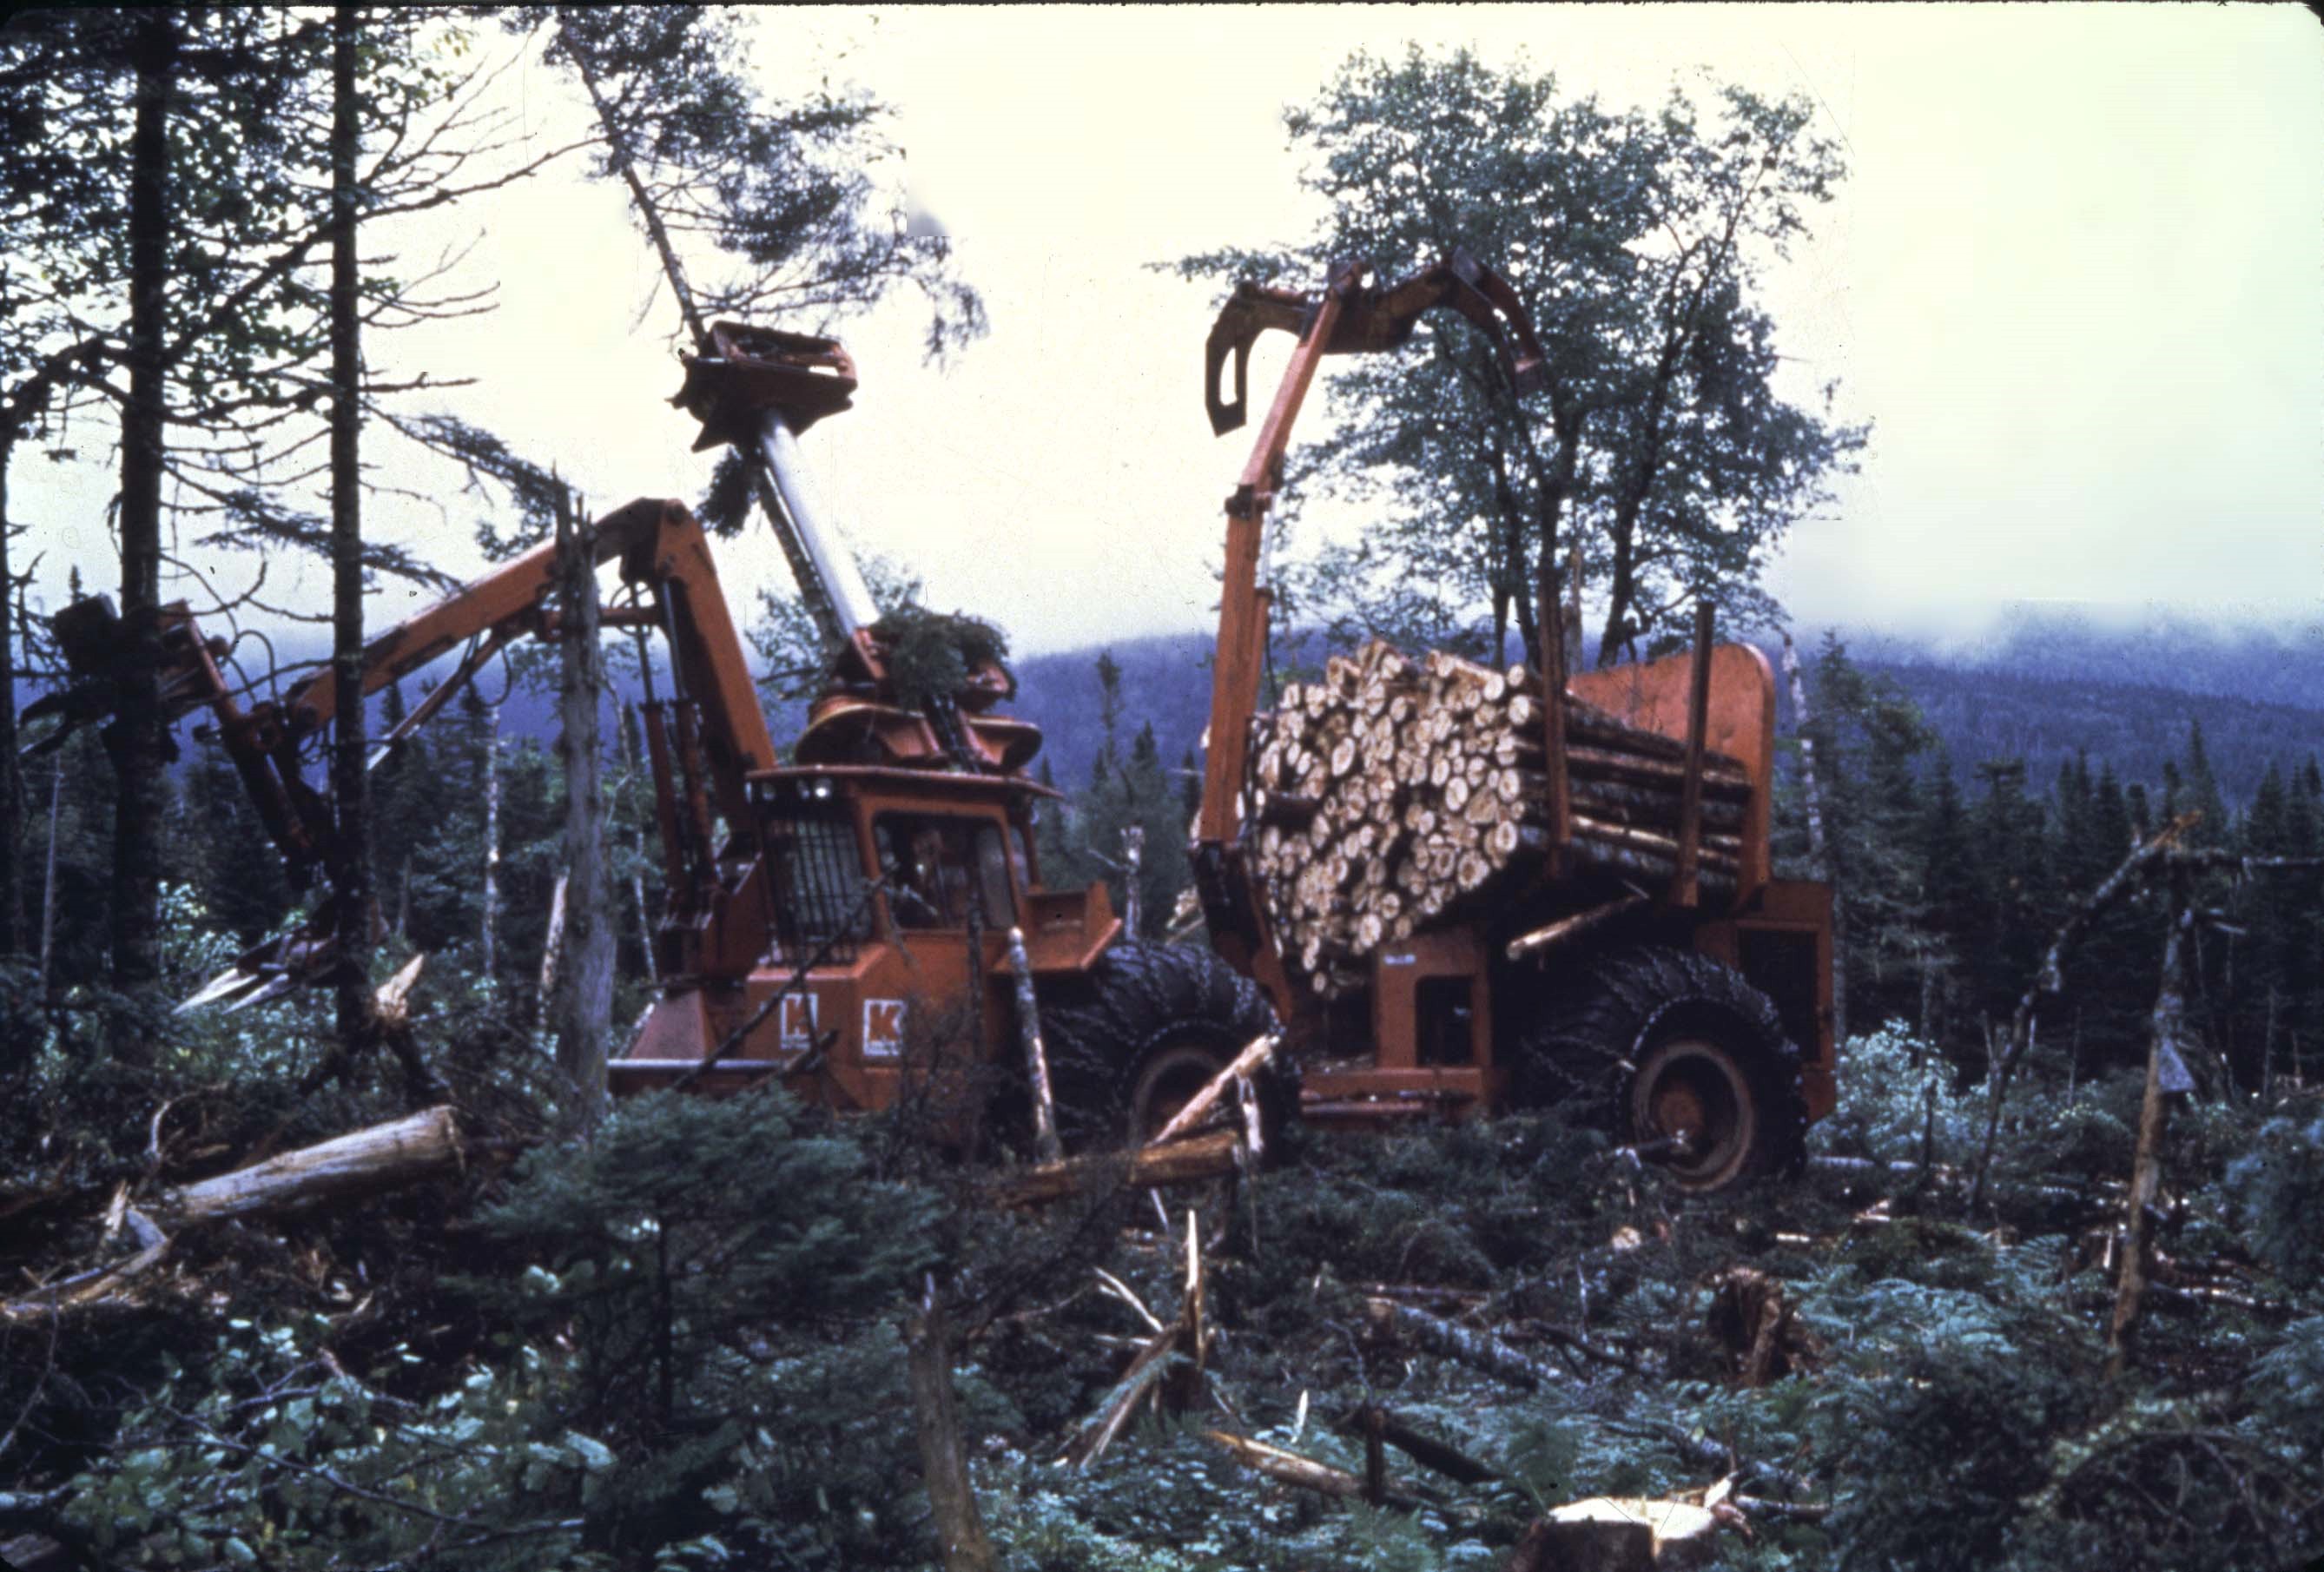
Image 14.2. Clear-cutting is the most common method of harvesting forests in Canada. Mechanized harvesting systems are used in most areas, such as this machinery that fells and de-limbs trees, cuts them into convenient lengths, and hauls the wood to a roadside. Source: B. Freedman.
Changes in Forest Cover
Forest resources in many countries are being rapidly depleted by high rates of clearing. This is particularly true in many tropical countries, where deforestation is largely driven by increasing populations and the resulting need for more agricultural land and wood fuels. Also important are the economic and industrial demands for tree biomass to manufacture into charcoal and products for international trade.
The global rate of deforestation was 6.1-million hectares per year between 1990 and 2010 (UNEP, 2014). These are high rates of forest loss, and they appear to have increased since the late 1990s. Satellite data for Amazonia, for example, suggest that the rate of clearing increased by about 50% in 1996-1997, which was a relatively dry year that was favourable for removing tropical forest by burning for conversion into pasture or fields for growing soybeans.
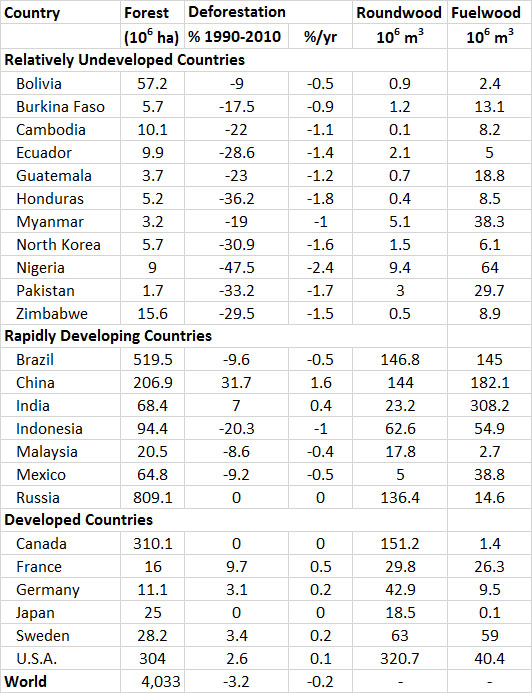
The rates of deforestation of some less-developed and rapidly developing countries are shown in Table 14.11. Recently, some of these countries have been losing their forests at extraordinary rates. For instance, between 1990 and 2010, Nigeria lost 48% of its forest cover at an average rate of 2.4% per year. Another African country, Burundi, lost 41% of its forest during that period, while Honduras in Central America lost 36%. The rapid deforestation that is occurring in most developing countries represents the mining of potentially renewable lumber, fuelwood, and other uses of tree biomass. In addition, deforestation in tropical and subtropical regions causes terrible ecological damages, such as endangerment and extinctions of biodiversity. These topics are examined in Chapters 23 and 26.
In contrast to the rapid deforestation that is occurring in most less-developed countries, the forest cover of many developed ones has recently been stable or increasing (Table 14.9). This is happening in spite of industrial harvesting of timber resources in many of those countries, largely to manufacture lumber and paper. This is because the industrial forestry that is typically pursued in Canada, the United States, and Western Europe allows, and even works to encourage the regeneration of another forest on harvested sites. Consequently, there is no net loss of forest cover, although the character of the ecosystem may change because of the management system being used, especially if tree plantations replace the natural forest (see Chapter 26).
Table 14.9. Forest Resources and Forestry Production in Selected Countries. Forest area is for 2010; deforestation is the change in forest area between 1990 and 2010 (if positive, the forest increased), expressed over the entire period and as an annual average. Harvesting data for industrial roundwood and fuelwood are for 2012. Source: Data from FAOSTAT (2014) and UNEP (2014).
Although most developed countries now have a stable or increasing forest cover, this has not always been the case. Many of these countries were being actively deforested as recently as the beginning of the 20th century. Most of the early deforestation occurred in order to develop land for agriculture. For instance, most of Western Europe was still forested as recently as the Middle Ages (up until about 1500), as was eastern North America up until one to three centuries ago. Extensive deforestation also occurred during the First World War, when European countries were engaged in “total war” economies and were harvesting wood as quickly as possible, often for use as pit props in underground coal mining. Large parts of these regions are now largely devoid of forest cover, which has been replaced by agroecosystems and urbanized land.
This process of deforestation largely stopped around 1920 to 1930. At that time, forested areas began to increase in many developed countries. This happened because many small farms of marginal agricultural capability were abandoned and their inhabitants migrated to urban areas to seek work. Over time, the land reverted to forest. In much of Europe, this involved the establishment of plantations (tree-farms), usually of conifer species. In other regions there was a natural afforestation as tree-seeds established new populations on disused rural land. For example, because of these socio-economic and ecological dynamics, the area of forest in much of the Maritime Provinces has approximately doubled since the beginning of the twentieth century. Similar changes have occurred in other developed regions of the world.
Harvesting and Managing Forests
Globally, the net trend is one of rapid deforestation. Between 1990 and 2010, about 7-million hectares of forest per year were lost to deforestation (UNEP, 2014). Almost all of this aggressive deforestation is associated with the conversion of tropical forest into agricultural land, but the harvesting of forest products is also important in some regions. Globally, only about half of the original forest area remains.
During 2013, the global consumption of wood averaged 3.6-billion cubic metres, representing a 1% increase from a decade earlier (Table 14.11). The wood consumption included the following:
- 0.96 x 10⁹ m3 of sawn and veneer timber (a 7% decrease from 2004)
- 0.43 x 10⁹ m3 of wood panels such as plywood (45% increase)
- 0.40 x 10⁹ m3 of fibre such as pulpwood, used to make paper (12% increase)
- 1.70 x 10⁹ m3 of industrial roundwood (no change)
- 1.88 x 10⁹ m3 of fuelwood (2% increase; 90% was consumed in less-developed countries)
In Canada, an enormous industrial complex depends on the harvesting of forest biomass, largely for manufacturing into lumber, composite materials such as plywood and waferboard, and pulp and paper. The total value of products manufactured from forest resources in 2013 was $53-billion (Canadian Forest Service, 2014).
Most of Canada’s production of forest products is intended for export, providing foreign earnings that are crucial to maintaining a positive balance of trade. In 2013, Canadian exports of forest products had a value of $33.7-billion, and the net contribution to the international balance of trade was $12.7-billion (this is the value of exports minus imports within the forestry sector (Canadian Forest Service, 2014). By comparison, Canada’s overall balance of trade in 2012 was minus $6.7-billion, and it would have been worse without the positive contribution of the forestry sector (Statistics Canada. 2014g). Overall, Canada is the world’s leading exporter of forest products, accounting for 9% of global trade.
For comparison to the net earnings from the export of forest products ($12.7-billion), those of other key economic sectors in Canada in 2013 were:
- energy, +$69.6 billion
- metals and minerals, +$20.2 billion
- agriculture and fish, +$14.8 billion
- automotive and aircraft, –$14.4 billion
- consumer goods, –$45.5 billion
- industrial machinery, equipment, electronics, –$52.5 billion
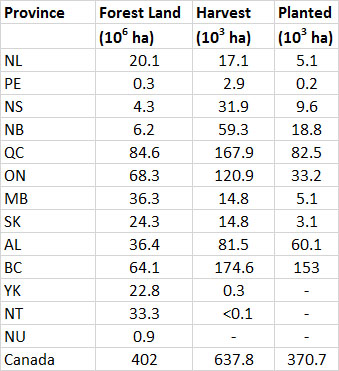
Of course, to achieve the great economic benefits of forestry, large areas of mature forest must be harvested each year. In 2013, 638-thousand hectares of mature forest were harvested, which is considerably less that the 1-million hectares that was the annual harvest from 1995 to 2006 (Natural Resources Canada, 2013). The large decrease reflects a general downturn in global markets for forest commodities, especially for paper products. About 90% of the harvesting is by clear-cutting, and the rest by more selective methods. About 80% of the industrial harvest was conifer trees (softwoods) and 20% broad-leafed trees (hardwoods). The area of forest harvested was equivalent to about 0.4% of the area of “productive” forest of Canada (which is located in more southern regions and is relatively productive and accessible) and 0.2% of the total area of forest.
Almost all of the industrially harvested area in Canada is allowed to regenerate to forest. Deforestation, or long-term conversion to non-forest land-uses, is relatively uncommon in Canada. The recent amount of deforestation has been about 46-thousand hectares per year (in 2010), of which agricultural conversions were responsible for 41%, oil and gas activities for 24%, municipal conversions for 10%, forestry for 8%, industry for 7%, road-building for 6%, and others the rest (Natural Resources Canada, 2013). However, it should be understood that much of the harvested forest is not regenerating well because it is poorly stocked with commercially valuable tree species. For example, about 15% of Crown land harvested since 1975 is considered to be understocked.
In addition, the regeneration of trees on most of the harvested area (this is known as reforestation) is encouraged by the planting of seedlings and other aspects of silvicultural management. In 2012, about 67% of the harvested area was planted with tree seedlings. Many of the planted areas are managed quite intensively to develop tree plantations, a system that represents the application of an agricultural model to the growing of trees, also known as agroforestry. Tree farms are generally more productive of biomass than natural forest, but they lack many elements of native biodiversity and other ecological and aesthetic values (Chapter 23). Other aspects of intensive forestry management may include the thinning of overly dense tree regeneration, the use of herbicide to reduce the abundance of non-crop plants (or “weeds”), and the use of insecticide if there is an irruption of insects that threaten the tree cop, such as spruce budworm (Chapter 22).
Almost all the non-planted tracts of the harvested area (33% of the total) also regenerates back to forest. However, this occurs through a “natural regeneration” of tree species. Natural regeneration may involve seedlings that existed on the site prior to harvesting and survived the disturbance (known as advanced regeneration), seedlings that established from seeds dispersed onto the site from nearby forest, or seeds dispersed by mature seed-trees left on the site.
Overall, from the industrial perspective, forestry as it is practiced in Canada appears to be conserving its primary economic resource – the area of forest and the productivity of tree biomass. Supporting this bold statement are three observations: (1) there is little net deforestation in Canada, and most of what does occur is not directly due to forestry practices; (2) almost all harvested sites regenerate back to another forest, which will be available for harvesting again once the trees grow to an appropriate size; and (3) except in some local areas, for short periods of time, the amount of timber harvesting does not exceed the landscape-scale forest productivity. Of course, not all considerations are so positive. For instance, as was previously noted, natural regeneration has resulted in extensive areas that are, from the economic perspective, understocked with commercial tree species.
Moreover, additional environmental considerations must be weighed before Canadian industrial forestry can be considered to be ecologically sustainable (in the sense that was explained in Chapters 1 and 12). These issues, to be examined in Chapter 23, include the following:
- long-term effects of harvesting and management on site capability, which may become degraded by nutrient losses and erosion
- effects on populations of fish, deer, and other hunted species, which are also an economic “resource”
- effects on indigenous biodiversity, including native species and naturally occurring ecosystems (such as old-growth forest)
- effects on hydrology and aquatic ecosystems
- implications of forestry for carbon storage (this is important with respect to anthropogenic influences on the greenhouse effect; Chapter 17)
These ecological values can be severely degraded by forestry, and this detracts from the ecological sustainability of this industrial activity.
Table 14.10. Forest Resources and Forestry Production in Canada. Land classified as “productive” of timber has a sufficiently high productivity and stocking of trees to be economically exploitable, while “non-productive” forest is considered to be non-economical. Harvest data are for 2013. Increases are from 1990. Source: Data from Natural Resources Canada (2013).
Fish Resources
Wild populations of fish have long been exploited as food. In recent decades, there have been enormous increases of the rate of harvesting of wild fish, and also in the cultivation of certain species in semi-domestication, a practice known as aquaculture. Like crop plants, livestock, and forests, populations of fish can be harvested in a sustainable manner, which would allow the yields to be maintained. However, fish stocks can also be over-harvested to the degree that their regeneration is impaired. When this happens, productivity declines and the bio-resource can disastrously collapse. Regrettably, the recent history of many of the world’s major fisheries provides abundant examples of over-exploitation causing rapid declines in resources.
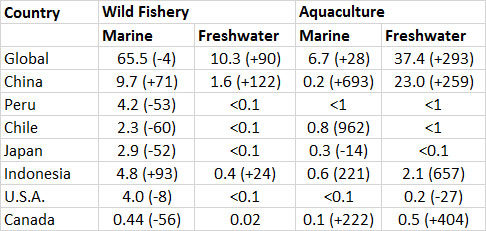
The global harvest of fish, crustaceans, and shellfish in 2012 was about 91-million tonnes. This included 66-million tonnes of marine fish (representing a 4% decrease over 1993), 10 x 106 t of freshwater fish (a 91% increase), 1.7 x 10⁶ t of diadromous fish (these are mostly salmon that migrate between salt and fresh water; +6%), and 44 x 106 t of fish grown in aquaculture (294% increase) (Table 14.11).
Table 14.11. Fish Catches and Aquaculture in Selected Countries. Data are in 106 t/y in 2012, with percentage increase since 1993 given in brackets. Countries are listed in order of decreasing catches of marine fish (data include diadromous fishes). Source: Data from FAO (2014).
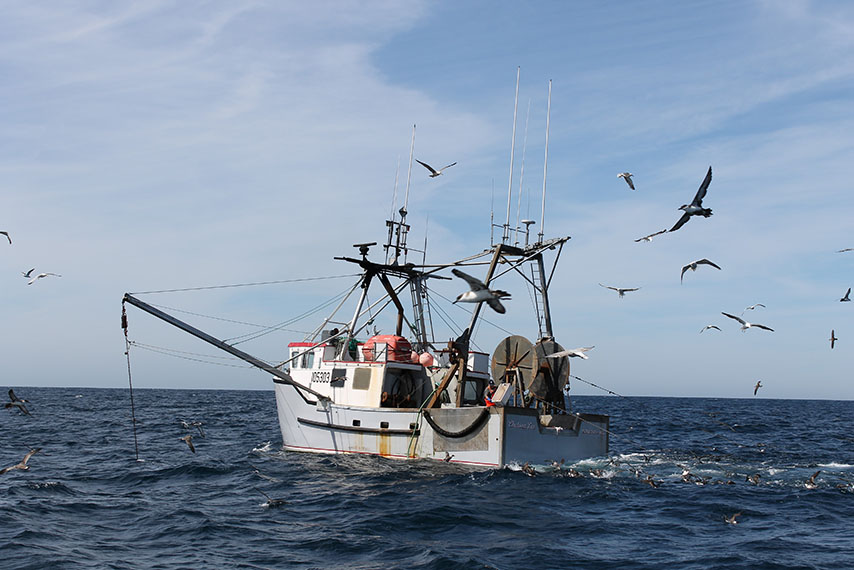
Image 14.3. Bottom-dragging is a technology used to harvest fish or scallops by drawing an open net along the sea floor, which in some respects is the marine equivalent of clear-cutting a forest. This boat is used to drag for scallops off southwestern Nova Scotia. Source: B. Freedman.
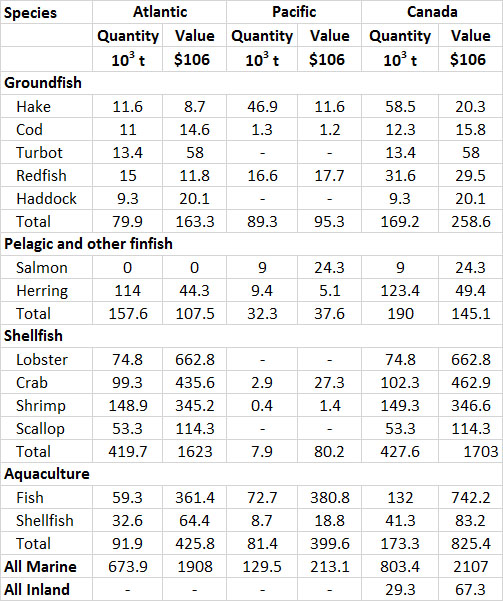
Canada is a major fishing nation, with an annual harvest of 803-thousand tonnes of marine fish in 2013, with a value of $2.1 billion (Table 14.14). There was also a substantial harvest of freshwater fish, equivalent to 29 x 103 t and a value of $67 million. Aquaculture is also becoming increasingly important. The total harvest of fish in 2013 was 174-thousand tonnes, with a value of $834 million. Total exports of fish products had a value of $4.15-billion. The exports were partly offset by fish imports of $2.74-billion, for a net trade balance of $1.41-billion in this economic sector.
The most important marine species harvested are summarized in Table 14.12. Note that these data are for Canadian landings only. Some foreign nations also fish waters within Canada’s 320 km management jurisdiction, but their landings are not included in the table.
Table 14.12. Landings of Selected Fishes in Canada. Catch biomass is in 103 t/y, and economic value is in millions of dollars. Data are for 2012. Source: Data from Fisheries and Oceans Canada (2014a).
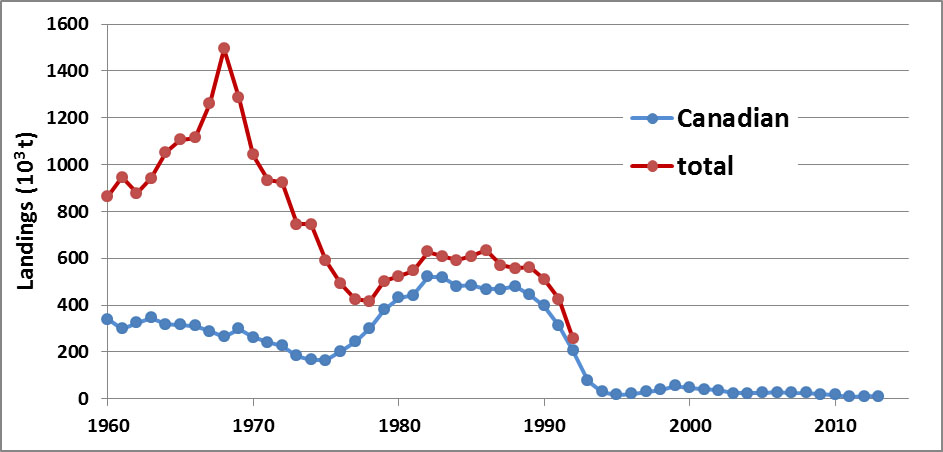
In 1992, the total catch of cod in Atlantic Canada was 239-thousand tonnes, of which 80% was landed by Canadian vessels and 20% by the foreign fleet working within the 320-km management zone (see Canadian Focus 14.2). The 1992 catch was, however, much smaller than what had been attained in previous decades, which averaged as much as 598-thousand tonnes during 1982–1986 (81% was Canadian landings). In fact, the declining harvest reflected a collapse of the cod stocks throughout eastern Canadian waters, a resource calamity that resulted in the closure of virtually the entire fishery in 1992. The cod stocks were still largely closed to commercial exploitation in 2014 (when this was written), and will likely remain so for several years. In 2012, the cod landings in the Atlantic region were 11-thousand tonnes, only 5% of the catch in 1992. The devastation of cod stocks in the northwestern Atlantic Ocean, mostly caused by Canadian over-fishing, is a world-class example of the mining of a potentially renewable bio-resource.
Canadian Focus 14.2. Mining the Cod
In 1497, John Cabot explored waters around Newfoundland on behalf of the English Crown. On his return, he wrote with enthusiasm that the Grand Banks were so “swarming with fish [that they] could be taken not only with a net but in baskets let down [and weighted] with a stone.” At that time, cod (Gadus morhua) was a bountiful resource on the Grand Banks, a relatively shallow marine ecosystem of 25-million hectares. Large cod stocks also occurred off Labrador, Nova Scotia, the Gulf of St. Lawrence, and New England.By 1550, hundreds of ships were sailing from coastal Europe, catching cod and preserving it by drying or salting to sell in their home markets. By 1600, about 650 ships were fishing off Newfoundland, and by 1800, it was about 1,600 vessels. Between 1750 and 1800, the average landings were 190-thousand t/y which increased to 400-460-thousand t/y during 1800-1900, and almost 1-million t/y between 1899 and 1904 (Mowat, 1984; Cushing, 1988).
In those early times, the cod were harvested using hand-lines, long-lines, traps, and seines. Many men fished from small dories, often launched from a larger mother ship, such as one of the celebrated fishing schooners that sailed from Newfoundland or Nova Scotia. Although this technology is inefficient, the total fishing effort was large and therefore so was the catch. Consequently, some near-shore cod stocks became depleted, although not those of the offshore banks.
The fishery greatly intensified during the twentieth century because of such technological innovations as the following:
- the development of more efficient netting technologies, particularly trawls and monofilament gill nets
- the use of sonar equipment to locate schools of fish
- increases in ship-borne capacity to store and process fish, which allowed vessels to stay at sea for a longer time
The improved technology allowed enormous catches to be made, particularly in the 1960s when the fishery was essentially an unregulated, open-access enterprise. By this time, unsustainably high catches were causing cod stocks to collapse (see Figure 1).
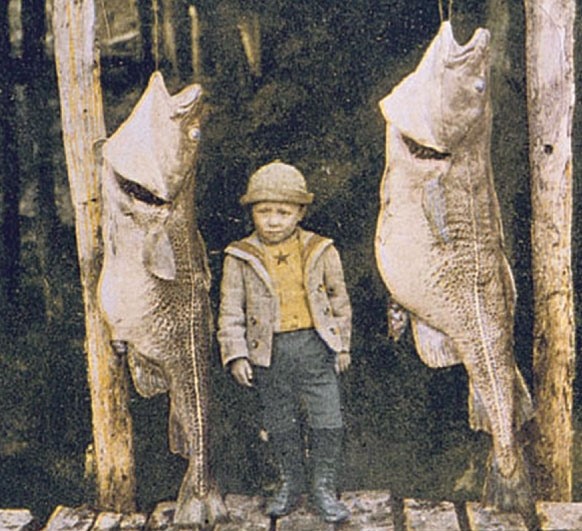
Image 14.4. Before the stocks of cod were heavily exploited, individual fish were much larger than they are today. Huge “mother cod” are now exceedingly rare. This is unfortunate because they have much greater spawning capacity than smaller cod. This photo was taken in Battle Harbour, Labrador in the 1890s. Source: National Archives of Canada.
Because the declining stocks of cod were causing an economic crisis to occur in the Atlantic fishery, in 1977 the Government of Canada declared a 320-km wide fisheries-management zone within which quotas of fish were allocated. The conservation actions resulted in short-lived increases in cod stocks and landings. However, exploitation levels were still too high, and the fishery experienced an even more serious collapse. In 1992, the federal government declared a moratorium on commercial fishing for cod, a ban that was still largely in force in 2014 (when this was written). Because only small populations of adult cod are available for spawning, the recovery of the stocks has been slow. However, if allowed, the cod may eventually recover to again be a bounteous resource.
Figure 14.3. Recent History of Landings of Cod off Eastern Canada. Note the large decrease in overall landings, and the increasing proportion of Canadian landings after the declaration of a 320-km management zone in 1977. A moratorium on cod fishing was declared in 1992, but there have been some by-catch and sporadic quotas since then. Data are in thousands of tonnes. Sources: Statistics Canada (1994) and Fisheries and Oceans Canada (2014a).
Several explanations have been proposed for the collapse of cod stocks in the Northwest Atlantic, each based on more or less convincing logic and information. The most important of these are discussed below (Freedman, 1995; Hutchings and Myers, 1995).
The hypothesis of over-exploitation suggests that the cod resource was exploited faster than it could regenerate, which caused a decline that became especially acute from the 1970s to early 1990s. The excessive harvesting was caused by several factors. Over the years, scientists had estimated the size and productivity of cod stocks and their maximum sustainable yield (MSY). The scientific information was, however, imperfect. First, it is extremely difficult to estimate the abundance of fish in the open ocean. In addition, a population model being used in the 1980s to determine stock size and to set quotas was systematically overestimating cod biomass and MSY, and that resulted in the allocation of unsustainable fishing quotas.
Moreover, politicians and other decision makers in Canada (and everywhere else) are influenced by socio-economic considerations in addition to the advice of scientists. In the context of cod, these pressures come from individual fishers, their associations, and fish companies. These interest groups all need cash flows and livelihoods, in a context where there are few alternatives to fishing for employment and revenue generation. These powerful socio-economic influences led to political decisions to set larger quotas than were being recommended by fishery scientists, a factor that has contributed to the mismanagement of cod stocks and many other resources.
Most of the Grand Banks falls within Canada’s 320-km management zone. Some parts, however, extend into international waters, where, until 1995, there was an unregulated multinational fishery. Because cod and most other marine species are mobile and do not recognize the boundaries of management zones, foreign over-fishing in international waters compromised efforts to conserve the stocks. However, between 1977 and 1991, Canadians landed about 85% of the cod caught in the Northwest Atlantic, and their fishery was being regulated. Humans are not the only predators of marine resources. The harp seal (Pagophilus groenlandicus) is the most abundant marine mammal in the Northwest Atlantic (more than 7-million). The seal population consumes about 1 million tonnes of food per year. However, this seal’s prey consists of a wide variety of species, especially crustaceans and small fish such as capelin (Mallotus villosus) and Arctic cod (Boreogadus saida). Even though the cod stocks collapsed at the same time that the seal population was increasing, the minor role of cod in their diet makes it unlikely that seals were an important cause.
Finally, some people believe that the recruitment of cod may have been somehow impaired by environmental changes, including several years of cold surface-water temperatures in parts of the Northwest Atlantic. However, there is no direct evidence to support such an environment-related cause of the collapse of the cod stocks. The simplest and most compelling hypothesis offered to explain the collapse of cod stocks is this: the valuable resource was exploited at an intensity that exceeded its capability for renewal. In other words, the cod stocks of the Northwest Atlantic, one of the world’s greatest potentially renewable bio-resources, were fished to commercial extinction.
Other Hunted Animals
Marine Mammals
Marine mammals have been subjected to intensive commercial hunting in many oceanic regions. Initially, they were hunted mostly as a source of oil, which in pre-petroleum times was a valuable commodity as a fuel in lamps and for cooking. A few marine mammals, including Steller’s sea cow, the Caribbean monk seal, and the Atlantic grey whale, became extinct because of over-hunting, and many other species or populations became endangered (see Chapter 26). Among the best-known commercial hunts of marine mammals are those of the great whales of all oceans of the world and the harp seal of eastern Canada.
Whaling
People have been hunting whales for centuries. The first species to be commercially hunted was the northern right whale (Balaena glacialis), which was considered the “right” whale to kill because it swims slowly and close to shore and floats when dead. Early records tell of hunts in the Bay of Biscay (coastal Europe) in the eleventh century. Men would row or sail near a right whale, harpoon it, allow it to tow their boat until exhausted, and then repeatedly lance the animal until it bled to death. The carcass would then be towed to shore and butchered, and the blubber rendered by boiling into a valuable oil. Even this crude hunt was enough to exterminate the right whale from European waters.
The development of steam ships made it possible to hunt swifter whales, such as the roquals (blue, fin, sei, and minke). The invention of the harpoon gun in 1873, and later the exploding-head harpoon, made it easy to kill even the biggest whales. By 1925, huge factory ships would spend months or years in remote waters, processing whales killed by a small fleet of boats, sometimes guided to their prey by spotter aircraft. Whales of all species and sizes could be efficiently located, killed, and processed. This onslaught resulted in a rapid, and profitable, depletion of whale stocks.
With only a few exceptions, whale populations were not over-harvested to extirpation, but rather to commercial extinction – to a small population that was no longer profitable to find and kill. The sequential exploitation of a whale community is best illustrated by the hunt in Antarctic waters, where five species initially co-existed in great abundance (Figure 14.2).
Figure 14.4. Whaling in Antarctic Waters. Annual catches in thousands of whales. Source: Data from Ellis (1991).
In response to concerns about declining populations of whales, the International Whaling Commission (IWC) was established in 1949. The IWC was given a mandate to develop and implement conservation-related controls over the multinational, highly capitalized, competitive, and profitable whaling industry. Unfortunately, the initial efforts of the IWC were not very successful, partly because it is so difficult to estimate whale stock sizes and recruitment and to determine accurate sustainable yields. More importantly, the major whaling nations were not particularly co-operative, and the IWC was not aggressive in setting and enforcing quotas small enough to ensure that whale populations would not be depleted. These problems are to be expected whenever a for-profit enterprise is allowed to regulate and police itself. According to J.L. McHugh, a former commissioner and chairperson of the IWC, “From the time of the first meeting of the Commission … almost all major actions or failures to act were governed by short-range economic considerations rather than by the requirements of conservation” (cited in Ellis, 1991).
Because of its enormous size, with the largest males reaching 32 m and 136 tonnes, the blue whale (Balaenoptera musculus) was initially the most profitable species in the Antarctic seas. The original population in those waters was about 180-thousand, and as many as 29-thousand were killed in a single year (Figure 14.2; note that during the Second World War, as few as 59 animals were harvested in a year). Between 1955 and 1962, declining stocks meant an annual harvest of only 1-2-thousand. After 1965, killing this species was prohibited by the IWC. In total, about 331,000 blue whales were killed in Antarctic waters between 1920 and 1965. The present Antarctic population of blue whales is fewer than 2,000, only about 1% of their initial abundance. The global population is now about 3,000 individuals, compared with an initial 250-thousand.
As blue whales became depleted, the fin whale (B. physalus) became the favoured species of the Antarctic hunt. This is the second-largest species, up to 21 m long. As many as 29-thousand animals were harvested in a year, causing this species to decline, though not to commercial extinction. More than 704-thousand fin whales were killed in this region. The present population is less than 85-thousand animals, about 21% of the original abundance. The global abundance is about 163-thousand, compared with an initial 700-thousand.
As the largest species became difficult to harvest because of their increasing rarity, initially “less desirable” species were hunted. These were the sei whale (B. borealis), humpback whale (Megaptera novaeangliae), sperm whale (Physeter macrocephalus), and minke whale (B. acutorostrata). These smaller species were also over-harvested, and their populations also declined.
Toward the end of the hunt in the Antarctic Ocean, the population of blue whales had been reduced by about 99%, humpback whales by 97%, sei whales by 82%, and fin whales by 79%. By the early 1980s, whalers were killing mostly the relatively small (up to 9.1 m long) and abundant minke whale. Finally, in 1982, the IWC announced a moratorium on Antarctic whaling, to begin in 1985-1986. Japan and the former USSR continued a commercial hunt until 1986-1987. Since then, only Japan has whaled in the Southern Ocean, killing hundreds of minke whales in most years for the purposes of “research,” as well as fin whales.
Industrial whaling also depleted whale stocks in the Northern Hemisphere. Early European explorers found large populations of northern right whales in waters off Atlantic Canada, and these valuable animals were soon hunted. The Basque hunt of 1530-1610 killed about 25-40-thousand right whales (but few afterward because of the severely depleted stocks). The right whale survives today in the western Atlantic as an endangered population of about 350 animals, only 3-4% of the original abundance. Although this species has been protected from hunting for more than 50 years, its abundance is not increasing much. This is probably because of mortality caused by accidental collisions with ships and entanglement in fishing gear.
Soon after the right whales were depleted off eastern North America, populations of bowhead whales (Balaena mysticetus) were discovered in Arctic Canada, Alaska, and eastern Siberia. Like right whales, the slow-swimming bowhead could be easily overtaken by whaling boats and killed. The population of about 55-thousand bowheads in the western Arctic was soon depleted. Bowhead whales are now rare, although their populations are increasing. These animals are no longer hunted commercially, although a hunt by Inuit in northern Alaska kills 20-40 animals per year. Since 1996, Canadian Inuit have been allowed to again hunt a few bowhead whales, a practice that is permitted because of the importance of this species in their culture.
A final example of depletion of a whale stock involves the grey whale (Eschrichtius robustus) of western North America. This species winters and breeds in warm waters off Mexico and migrates up the Pacific coast to summer in the western Beringean Ocean. Commercial hunting began in 1845 and largely ended by 1900 because the stock had been reduced to an endangered several thousand animals. These were protected from further hunting, and the grey whale has since increased to about its pre-exploitation abundance of about 24-thousand animals. However, the species remains extirpated off Western Europe and is critically endangered in eastern Asia.
In total, more than 2.5 million whales of all species were killed during the commercial hunts of the past four centuries. Although there is now a ban on commercial whaling, Norway and Japan are still hunting minke whales, each killing several hundred per year. These and several other countries are lobbying aggressively for a return to a limited commercial hunt. In recent years, Japanese whaling interests have announced intentions to harvest larger numbers of minke whales, as well as fin whales and humpback whales in Antarctic waters. This was obviously a commercial harvest, but because biological and ecological data were collected, it was undertaken under the umbrella of “scientific” whaling.
Seal Hunting
Seals breed on land or sea ice, often in dense populations, and during the past several centuries, huge numbers have been commercially slaughtered for their skin, blubber, meat, and other products. Until the mid-twentieth century, seal hunting was an unregulated enterprise that severely depleted the resource, with several species made extinct and many regional and local extirpations (see Chapter 26). Since then, conservation measures have protected most seal populations. Some severely depleted species have managed to increase in abundance, such as the California sea lion (Zalophus californianus), northern fur seal (Callorhinus ursinus), and northern elephant seal (Mirounga angustirostris) in Pacific waters near North America.
One of the largest commercial hunts has involved the harp seal (Pagophilus groenlandicus), an abundant species of the northern Atlantic Ocean. These seals breed prolifically on pack ice in the Gulf of St. Lawrence and around Newfoundland and Labrador, and then summer in the eastern Arctic. Harp seals are especially vulnerable to hunters in April, when large numbers of newborn pups, called whitecoats because of the colour of their birth fur, lie about on the pack ice. Because they are not yet aquatic, the pups are easily approached and killed. Adults are also concentrated at that time and can be caught in nets, shot on the ice, or clubbed if they try to defend their young. The skins of harp seals are a valuable commodity, and many people enjoy eating their meat.
Historically, the largest hunts were by Newfoundlanders, but hunters from Labrador, Nova Scotia, Prince Edward Island, and Quebec have also been active. The numbers harvested in any year mostly depended on the ice conditions, which affect how close sealers can get to the whelping aggregations of seals. During the heyday of this enterprise, more than 600-thousand animals were harvested annually, as occurred in 1831, 1840, 1843, and 1844 (Busch, 1985). Overall, about 21-million harp seals were taken between 1800 and 1914. This vast slaughter of a large wild animal has only a few parallels, including the massacre of bison in the nineteenth century (Chapter 26), the modern hunt of kangaroos in Australia, and that of deer in the Americas.
Another 12-million harp seals were taken between 1915 and 1982, with up to 380-thousand in one year (1956). Since then, the harvests have been smaller, mostly because of intense controversy about a commercial harvest of wild animal babies and the consequently diminished market for seal products. For instance, in 1984 the European Union (EU) banned the import of whitecoat pelts, which resulted in reduced harvests in Canada, from 190-thousand per year in 1981-1982 to 19-80-thouand per year during 1983-1990. (Note that young harp seals are not called whitecoats after they are 9-10 days old, when they begin to shed their white fur. At the time, older young could still be imported to the EU, but the most lucrative market had been for whitecoats. In 2010, the EU banned the importing of all sea products.)
In recent decades, animal-rights and conservation advocates, as well as elements of the popular media, have engaged in sensationalized reporting of the hunting of harp seals in Atlantic Canada. This has resulted in the hunt being widely regarded as a cruel and barbaric enterprise, mostly because baby seals, which are extremely attractive animals, were the object of the hunt. The young seals were killed by clubbing or shooting, which are humane methods of slaughter. However, some sealers were not competent in these killing methods, and videos have shown that during the rush to harvest young seals, animals might be inadequately clubbed and then skinned while apparently “alive” (or at least still twitching – the seals were likely brain-dead). Video images like this are extremely upsetting to most people, and they have been widely publicized by well-organized opponents of the Canadian hunt of harp seals.
Many people, however, do not agree with the portrayal of the seal hunt as being unusually “cruel and brutal.” They contend that the commercial harvesting of wild seals is no more ruthless than the slaughter of domestic livestock. For example, each year tens of millions of large mammals and hundreds of millions of chickens are raised and slaughtered annually in Canada, often under cruel conditions, to provide meat and other products (see also Chapter 24). Clearly, there are elements of cruelty in the commercial slaughter of both wild animals and livestock. An analysis of the ethics of killing animals should also, however, recognize that seals are wild creatures while livestock are specifically bred, raised, and killed for consumption by humans. It is up to philosophers, and to individual consumers of animal products, to determine which of these commercial slaughters, if either, represents the greater moral outrage.
Although the intense hunting caused harp seals to decrease in abundance, the species was never depleted to the degree of biological or commercial endangerment. This was not a result of a conservation ethic by the sealers or their industry. In fact, sealers typically killed as many harp seals as they could, particularly before 1970 when the Canadian government began to regulate the hunt through a quota system. In general, only the physical difficulty of hunting in treacherous pack ice limited the numbers of seals that could be found and killed, and so prevented a severe depletion of their stocks.
When the commercial hunt was reduced in the late 1980s, the global abundance of harp seals was about 3 million animals, including 2 million in Canadian waters. Even then, the harp seal was among the world’s most populous large wild animals. In 2014, its abundance in Canadian waters was more than 7.4-million (there are also up to 0.6-million hooded seals and 0.5-million grey seals; Fisheries and Oceans Canada, 2014b). In fact, the rapidly increasing harp seal population is alarming some people, who are concerned that the seals are “eating too many fish” (although there is little evidence to support this idea; see Canadian Focus 14.2).
In any event, harp seals are again being harvested. The harvest is intended to cull the seal population somewhat, while providing economic benefits through the sale of meat, hides, and other products (including penises, for which there is a market in eastern Asia). The most recent quota allowed the harvest of 400-thousand harp seals in 2013-2014, including adults and recently moulted young (but not whitecoats). The quota for hooded seals was 8,200, and grey seals 60-thousand. However, the actual harvests are much smaller, largely because of collapsed markets in the European Union and elsewhere. The actual harvest of harp seals in 2013 was 94-thousand, with a markey value of the raw pelts being about $3-million. A nominal goal of the management plan is to reduce the abundance of harp seals to about 3.85 million.
Terrestrial Hunting
Many terrestrial animals are also hunted in large numbers, including big mammals such as bears, deer, gazelles, kangaroos, and pigs. Many birds are also hunted, particularly grouse, pheasants, shorebirds, and waterfowl. Much hunting of wild animals is undertaken for subsistence purposes, but sport hunting is also important in some regions.
Hunting is a popular activity. Many Canadians hunt on a regular basis, whether for subsistence, as a blood sport, or for both reasons. The most commonly hunted large mammals are species in the deer family, but other animals are also taken. The most important big-game species in Canada are the following (annual harvests during 2011-2013):
- white-tailed deer (Odocoileus virginianus), 201-thousand
- moose (Alces alces), 72-thousand
- mule deer (Odocoileus hemionus), 73-thousand
- caribou (Rangifer tarandus), at least 10-thousand
- black bear (Ursus americanus), 21-thousand
- elk (Cervus canadensis), 11-thousand
- pronghorn antelope (Antilocapra americanus), 1,400
- wolf (Canis lupus), 2,800
(Note that these data were compiled from information provided by provincial and territorial governments, using the most recent available information. However, the data are incomplete in that they are based on incomplete surveys of hunters, and kills due to poaching (illegal hunting) are not included. In addition, hunting by Aboriginal persons is not usually reported or is considered proprietary information, especially in northern regions of Canada.)
Image 14.5. Many white-tailed and mule deer are harvested by hunters each year in Canada. This mule deer was photographed in Jasper National Park, Alberta. Source: B. Freedman
Although the demand for wild furs has declined in recent decades, fur-bearing animals are still trapped in large numbers in Canada. During 2011-2013, at least 900-thousand furbearers were trapped annually, including 295-thousand muskrat, 170-thousand beaver, 75-thousand marten, 72 000 squirrels, 52-thousand raccoons, 73-thousand coyotes, 55-thousand mink, and 27-thousand fox. An additional 1.46 million mink were raised and harvested on fur farms.
Image 14.6. About one million geese are harvested by hunters each year in Canada. This snow goose was photographed on its nest on Ellesmere Island. Source: B. Freedman
Waterfowl are also harvested in large numbers. In total, about 1.2-million ducks were taken by hunters in 2013, along with 1.1-million geese (Canadian Wildlife Service, 2013; U.S. Fish and Wildlife Service, 2014). This is considerably smaller than the U.S. harvest from this essentially same population of migratory waterfowl, which totaled about 13.7-million ducks and 3.4-million geese in 2013. The most commonly hunted game birds in Canada (harvested in 2013) are the following:
- mallard (Anas platyrhynchos), 547-thousand
- black duck (Anas rubripes), 100-thousand
- green-winged teal (Anas crecca), 83-thousand
- wood duck (Aix sponsa), 71-thousand
- ring-necked duck (Aythya collaris), 31-thousand
- northern pintail (Anas acuta), 56-thousand
- gadwall (Anas strepera), 40-thousand
- lesser scaup (Aythya affinis), 32-thousand
- 21 additional duck species, 278-thousand
- Canada goose (Branta canadensis), 726-thousand
- snow goose (Chen caerulescens), 225-thousand
- white-fronted goose (Anser albifrons), 75-thousand
- murres (Uria lomvia and U. aalge), 114-thousand
- woodcock (Scolopax minor), 20-thousand
- sandhill crane (Grus canadensis), 5-thousand
- coot (Fulica americana), 2-thousand
Some of the species that are hunted or trapped in Canada have declining populations over at least some of their range where they are exploited. This is the case of many southern populations of caribou, wolf, and grizzly bear, and of some waterfowl, such as canvasback and redhead ducks. This is not to say that these species should be considered endangered in Canada, but it does indicate that it is necessary to monitor their population changes to ensure that over-hunting does not cause them to decline to an unacceptable degree.
Conclusions
Renewable resources are the only fundamental basis of a sustainable economy. In this chapter, we learned that the most important kinds of renewable resources in Canada and the rest of the world are fresh water, agricultural products, forest biomass, fish, and hunted birds and mammals (renewable sources of energy were examined in Chapter 13). Some of these are wild resources that are harvested from natural ecosystems, while others are managed in agricultural systems to achieve higher yields (including in agroforestry and aquaculture). In general, Canada is rich in renewable natural resources, with a bountiful surplus of many of them available to export to other countries. Nevertheless, Canada also provides cases of the depletion of potentially renewable resources by excessive harvesting or inadequate management of the regeneration.
Questions for Review
- What is meant by a renewable natural resource? Explain the principle by referring to one of the following: surface water and groundwater, agricultural site capability, timber, or a hunted animal.
- What are the most important renewable resources in Canada? Indicate, giving reasons, whether you think those resources are being used in a sustainable manner.
- Use data on natural resources in Chapters 13 and 14 to develop a “resource profile” for the province or territory where you live. Consider the relative importance of non-renewable and renewable resources in the economy and the implications for longer-term sustainability.
- What are the criteria for ecological sustainability?
Questions for Discussion
- Identify a potentially renewable natural resource that has been over-harvested and depleted in your region. What are the reasons for the unsustainable use of the resource?
- Should relatively abundant species of whales (such as the minke) or harp seals be hunted? Your answer should consider whether the species can be harvested in a sustainable manner, and should also address the ethics of hunting wild animals.
- What are the political and economic problems of sharing water resources between countries or regions?
- Although food can be purchased in a store, it does not really come from there – it is actually harvested from wild ecosystems or is cultivated in agriculture. Consider the food that you eat and the ethical and environmental issues associated with its production. You may find this question to be particularly interesting if you focus on meat, which is lethally harvested from millions of animals each year in Canada.
Exploring Issues
- The Minister of the Federal Department of Fisheries and Oceans has been asked to allow the resumption of whale hunting in Canadian waters. The minister asks for your advice on the matter, and you decide to develop lists of benefits and damages that would occur if the hunting were allowed. Prepare these lists and explain how each item relates to the ecological sustainability of a potential whale harvest.
References Cited and Further Reading
Agriculture Canada. 2008. Drought watch. http://www.agr.gc.ca/eng/?id=1326402878459
Bolen, E.G. and W.L. Robinson. 2002. Wildlife Ecology and Management. 5th ed. Prentice Hall, Upper Saddle River, NJ.
Busch, B.C. 1985. The War Against the Seals: A History of the North American Seal Fishery. McGill-Queen’s University Press, Kingston, ON.
Canada History. 2013. Prairie Drought. http://www.canadahistory.com/sections/eras/crash%20depression/Drought.html
Canadian Forest Service. 2014. State of Canada’s Forest Report. Ottawa, ON. http://www.nrcan.gc.ca/forests/report/16496
Canadian Wildlife Service. 2014b. Population Status of Migratory Game Birds in Canada, 2013. http://www.ec.gc.ca/rcom-mbhr/default.asp?lang=En&n=B2A654BC-1
Chiras, D.D. and J.P. Reganold. 2004. Natural Resource Conservation: Management for a Sustainable Future. 10th ed. Prentice Hall, Upper Saddle River, NJ.
Craig, J.R. and D.J. Vaughan. 2010. Earth Resources and the Environment. 4th ed. Prentice Hall, Upper Saddle River, NJ.
Cushing, D.H. 1988. The Provident Sea. Cambridge University Press, Cambridge, UK. Ellis, R. 1991. Men and Whales. Knopf, New York, NY.
Environment Canada. 2010. Dams and Diversions. https://web.archive.org/web/20170922055509/https://www.ec.gc.ca/eau-water/default.asp?lang=En&n=9D404A01-1.
Environment Canada. 2011. 2011 Municipal Water Use 2009 Statistics. http://www.ec.gc.ca/doc/publications/eau-water/COM1454/survey2-eng.htm#table2_toc Accessed November 2014.
Environment Canada. 2014. Water. http://www.ec.gc.ca/eau-water/ Accessed November 2014.
Fisheries and Oceans Canada. 2014a. Statistics. http://www.dfo-mpo.gc.ca/stats/stats-eng.htm Accessed November, 2014.
Fisheries and Oceans Canada. 2014b. Seals and Sealing in Canada. http://www.dfo-mpo.gc.ca/fm-gp/seal-phoque/index-eng.htm
Food and Agricultural Organization of the United Nations (FAO). 2014a. AQUASTAT. FAO, Rome. http://www.fao.org/nr/water/aquastat/data/query/index.html Accessed November, 2014.
Food and Agricultural Organization of the United Nations (FAO). 2014b. FAOSTAT. FAO, Rome. http://faostat3.fao.org/download/T/TP/E Accessed November, 2014.
Food and Agricultural Organization of the United Nations (FAO). 2014c. FAOSTAT Forestry Statistics Database. FAO, Rome. http://www.fao.org/forestry/statistics/84922/en/ Accessed November, 2014.
Food and Agricultural Organization of the United Nations (FAO). 2014d. Fisheries and Aquaculture Department. Statistics. FAO, Rome. http://www.fao.org/fishery/statistics/en
Freedman, B. 1995. Environmental Ecology. 2nd ed. Academic Press, San Diego, CA.
Freedman, B., J. Hutchings, D. Gwynne, J. Smol, R. Suffling, R. Turkington, R. Walker, and D. Bazeley. 2014. Ecology: A Canadian Context. 2nd ed. Nelson Canada, Toronto, ON.
Fryxell, J.M. and A.R.E. Sinclair. 2014. Wildlife Ecology, Conservation, and Management. Wiley-Blackwell, New York, NY.
Harris, J.M. and B. Roach. 2014. Environmental and Natural Resource Economics: A Contemporary Approach. 3rd ed. Routledge, New York, NY.
Holechek, J.L., R.A. Cole, J.T. Fisher, and R. Valdez. 2002. Natural Resources: Ecology, Economics, and Policy. 2nd ed. Prentice Hall, East Rutherford, NJ.
Hofmann, N., G. Filoso, and M. Schofield. 2005. The loss of dependable agricultural land in Canada. Rural and Small Town Canada Analysis Bulletin, 6(1): 1-16. http://www5.statcan.gc.ca/olc-cel/olc.action?objId=21-006-X2005001&objType=46&lang=en&limit=0
Hutchings, J.A. and R.A. Myers. 1993. What can be learned from the collapse of a “renewable” resource? Atlantic cod, Gadus morhua, of Newfoundland and Labrador. Department of Fisheries and Oceans, Science Branch, St. John’s, NL.
Hutchings, J.A. and R.A. Myers. 1995. The biological collapse of Atlantic cod off Newfoundland and Labrador: An exploration of historical changes in exploitation, harvesting technology, and management. Pp. 39–93 in: The North Atlantic Fisheries: Successes, Failures, and Challenges. Institute of Island Studies, Charlottetown, PE.
Mowat, F. 1984. Sea of Slaughter. McClelland & Stewart, Toronto, ON.
National Marine Fisheries Service (NMFS). 1991. Endangered Whales: Status Update. Silver Spring, MD: U.S. Dept. of Commerce, National Oceanic and Atmospheric Administration, NMFS.
NationMaster. 2014. Agriculture, Tractors, Countries Compared. NationMaster, Sydney, Australia. http://www.nationmaster.com/country-info/stats/Agriculture/Tractors Accessed November, 2014.
Natural Resources Canada. 2013. The state of Canada’s forests: annual report. Natural Resources Canada, Ottawa, ON. http://publications.gc.ca/pub?id=9.505771&sl=0
Statistics Canada. 2013a. Households and the Environment 2011. Cat. No. 11-526-X, after CANSIM 153-0062, Statistics Canada, Ottawa, ON. http://www.statcan.gc.ca/pub/11-526-x/11-526-x2013001-eng.htm
Statistics Canada. 2013b. Table 3.1. Water use in Canada, by sector, 2005 In: Human Activity and the Environment, Annual Statistics. http://www.statcan.gc.ca/pub/16-201-x/2010000/t233-eng.htm
Statistics Canada. 2014a. Gross domestic product (GDP) at basic prices, by North American Industry Classification System (NAICS), annual (dollars). Table 379-0029, CANSIM database. Statistics Canada, Ottawa, ON. http://www5.statcan.gc.ca/cansim/a26?lang=eng&id=3790029 Accessed November, 2014.
Statistics Canada. 2014b. Employment by industry and sex. Statistics Canada, Ottawa, ON. http://www.statcan.gc.ca/tables-tableaux/sum-som/l01/cst01/labor10a-eng.htm Accessed November, 2014.
Statistics Canada. 2014c. Agriculture Database. CANSIM Tables 001-0010, 004-00021, 004-00101. Statistics Canada, Ottawa, ON. http://www5.statcan.gc.ca/cansim/a33?lang=eng&spMode=master&themeID=920&RT=TABLE
Statistics Canada. 2014d. Fertilizer shipments to Canadian agriculture markets. CANSIM Table 001-0069, Statistics Canada, Ottawa, ON. http://www5.statcan.gc.ca/cansim/a26?lang=eng&id=10069
Statistics Canada. 2014e. Agriculture Database. CANSIM Tables 001-0010, 001-0014, 003-0026, 003-0028, 004-0001, 004-0011. Statistics Canada, Ottawa, ON. http://www5.statcan.gc.ca/cansim/a33?lang=eng&spMode=master&themeID=920&RT=TABLE
Statistics Canada. 2014f. Snapshot of Canadian agriculture. Statistics Canada, Ottawa, ON. http://www.statcan.gc.ca/ca-ra2006/articles/snapshot-portrait-eng.htm
Statistics Canada. 2014g. Imports, exports and trade balance of goods on a balance-of-payments basis, by country or country grouping. Statistics Canada, Ottawa, ON. http://www.statcan.gc.ca/tables-tableaux/sum-som/l01/cst01/gblec02a-eng.htm
Stenson, G.B. 2014. The Status of Harp and Hooded Seals in the North Atlantic. Serial No. N6321, NAFO SCR Doc. 14/026, Northwest Atlantic Fisheries Organization. http://archive.nafo.int/open/sc/2014/scr14-026.pdf
Tietenberg, T. and L. Lewis. 2011. Environmental and Natural Resource Economics. 9th ed. Addison Wesley, Boston, MA.
United Nations Environment Program. 2014. Environmental Data Explorer. http://ede.grid.unep.ch/
U.S. Fish and Wildlife Service. 2014. Migratory bird hunting activity and harvest during the 2012-13 and 2013-14 hunting seasons. Bethesda, MD. http://www.flyways.us/sites/default/files/uploads/migratory_bird_hunting_activity_and_harvest_2013-2014_hunting_seasons_estimates.pdf
Vitousek, P.M., P.R. Ehrlich, A.H. Ehrlich, and P.A. Matson. 1986. Human appropriation of the products of photosynthesis. Bioscience, 36: 368-373.

