Section 1: Data and Measuring Health Equity
LLana James; Dr. Robyn K. Rowe; and Dr. Robert W. Smith
Section Objectives
By the end of this section, you will be able to:
- Understand how contemporary discourses of data emerge from and sustain historic and new forms of colonization;
- Define, critically evaluate, and make visible the actors and power asymmetries;
- Understand the meanings of health equity and justice;
- Identify commonly used sources of data for measuring inequity; and
- Understand core concepts from social epidemiology on the measurement of health inequities.
Temporality and Historical Present: How Did We Get Here?
The landmass that stretches from what is now referred to as Canada, the United States, the Caribbean, Central and South America is called the American continent or the Americas. The Indigenous peoples of the Americas have lived here from time immemorial in relationship to the land and the ecosystems that support the web of life. Tens of millions of people inhabited the Americas with official estimates ranging from 60 million to 112 million, with thousands of languages spoken (Koch et al., 2019). A diversity of sophisticated socio-legal and economic systems flourished for thousands of years that did not rely on capitalism.
Many spiritual traditions co-existed without decimation from holy wars. The pristine landscapes, abundance of wildlife, clean rivers, lakes, intact bogs, and wetlands are the evidence that domination over nature was not an organizing tenet of First Peoples’ lives. The absence of irreparable environmental desolation, mass homelessness, food insecurity, intractable, and ever-increasing social inequity in North America prior to the arrival of colonizing Europeans is further evidence of responsible stewardship, and an active ethic of respect for the earth, skies, water, and all its inhabitants.
Deeper Dive
For more on these processes of colonization, colonialism, racial capitalism, and environmental destruction, here are a few key texts:
- Colonialism (Kroll-Zeldin, 2021)
- The Origins of AIDS, Revised and Updated Edition (2021)
- Racial Capitalism (Melamed, 2015)
- Indigenous ExtrACTIVISM in Boreal Canada (Willow, 2016)
- Colonialism, Rubber, and the Rainforest (Ross, 2017)
Datafication and the New World
In 1455, Pope Nicholas the V signed the Papal Bull on January 8th, declaring that any subject of Portugal willing and able was encouraged to invade, murder, and vanquish any and all Africans in service to the Portuguese crown (Wise & Wheat, 2016). They were also directed to enslave Africans into perpetuity and cease their lands.
However, when the Portuguese arrived on the coast of West Africa, they engaged in deception and stated that they came in peace and to trade. That deception provided the cover to trade and secretly unload massive quantities of guns, and gun powder, while simultaneously incentivizing locals to increase and accelerate the capture of slaves against the wishes of their King, King Alfonso of the Kongo (Hochschild, 2005; Newit, 2010). This began a massive export of Africans into transatlantic slavery that proliferated throughout the coast of West coast and Central Africa.
In 1492, Columbus arrived on what was called Hispaniola Island, but currently hosts two countries, Haiti and Dominican Republic. Upon returning to Spain, Pope Alexander the VI issued the Inter Caetera, Papal Bull asserting the rights of both Portugal and Spain to the lands Columbus landed on, as well as territories yet to be known in the New World. The Inter Caetera explicitly authorized the murder, subjugation/enslavement, and theft of land from the Indigenous inhabitants (National Library of Medicine, n.d.). These colonies would be filled by enslaved Africans living under the horrors of chattel slavery. Indigenous peoples of Africa would be kidnapped and sold to the Spanish as replacements for the Indigenous peoples of the Americas that were dying because of the contagions spreading from European contact, and because a Dominican friar, Bartolomé de Las Casas, successfully petitioned the Crown on behalf of the Taino to cease enslaving and killing of Indigenous peoples of the Americas (Clayton, 2009). Instead, Las Casas recommended that the Indigenous peoples of Africa should be enslaved (Clayton, 2009). The Indigenous peoples of Africa were not treated with kindness or compassion, a haunting reality that persists among the many who profit from their blood, sweat, and tears (See The Motivation).
With each trip, European expansion brought more and more disease, killing over sixty million people that came into contact with producing what is known as the Great Dying (Koch et al., 2019). To ensure a ready supply of slaves, and to prevent any regulation by African Kings, Queen Mothers, or Chieftains, the Portuguese needed to sow chaos and bedlam. They achieved this by offering a ready supply of weapons and other preferred trade items. The Spanish incited violence that facilitated the raiding of neighbouring villages. This resulted in villages being emptied, and some societies collapsing, as millions upon millions of Indigenous African people, citizens of robust societies, were disappeared into the transatlantic enslavement and trade lead by Europeans. By the year 1600, over half a million African slaves had been kidnapped, transported, and sold into chattel.
Deeper Dive
Further reading:
- New World Labor Systems: African Slavery (Battle & Sawula, 2013a)
- New World Labor Systems: American Indians (Battle & Sawula, 2013b)
- Lose your mother: A journey along the Atlantic slave route (Hartman, 2007)
Chattel slavery in the New World began with the Portuguese, followed by the Spanish, and then other European countries seeking to acquire wealth flooded into the market over the next four hundred years. The British were the largest English-speaking slave traders in the world, although they abolished slavery within Britain in approximately 1805 and abroad in 1834. Slave trading was a lucrative business and their greed was potent. Britain continued to ply the trade covertly for several more years after abolition. This required yet another set of data and datafication processes.
Transatlantic slavery required a system of rapid, verifiable documentation, finance, valuation, bankers, and assurances. Assurances were achieved via data that was used for forecasting profits, labour, and materials. These are the same tools needed to curate training data, develop and run Machine Learning and Artificial Intelligence applications in the health sector and business, however, the term prediction is used in the contemporary moment. Extensive cataloging and labeling, via branding of the flesh of the enslaved and tracking of enslaved people, was central to transatlantic chattel slavery. Chattel slavery was the mechanism of datafication that transformed Indigenous African people into data units. This was a massive undertaking that has been unmatched in scale until the arrival of computing power, and materials that can tolerate the rapid calculations, storage, and retrieval needs.
The Motivation
The rationale was to acquire wealth faster, with less labour, by Euro-settlers. Ultimately, the desire was to have an easier life, and to do away with repetitive tasks, increase convenience, and provide more time for leisure. Interestingly, these are the same logics underpinning slavery, which occurred from 1455 to well into the 19th century. Despite the abolition of slavery taking effect in 1834, this was a paper dragon for most enslaved African people because they were without human rights and means to participate meaningfully in the economy.
Throughout the US and the colonial world, most Black people who were enslaved remained so for several years under a range of apprenticeships that were wageless. Their labour was exchanged for food and shelter, conditions that varied little from their previous state of enslavement.
Over 20 million African slaves arrived in the New World, with millions more dying in the interior as they were marched to shore. Many more died at sea from the dehumanizing treatment, cramped and putrid slave ships, and more died after arrival due to the violence of slave owners, and their overseers. The brutal conditions, malnutrition, lack of proper shelter, and clothing, lead to short life spans often wracked with pain, unspeakable violence, and inhumane deaths. During the early days of Jamaica’s colonial life, enslaved Africans lived on average three years, that were kidnapped, and seasoned (a violent and brutal process of dehumanizing a person until they are submissive and without a sense of self). The life span of slaves only improved when prices stayed elevated, and the abolition of slavery was imminent.
Vast amounts of wealth and data were produced from the sale of the enslaved. Further, wealth and data were extracted from the sexual trafficking of the children and women who were forced to bear children as a result of routine rape by and for slavers to increase the labour force and wealth, generating yet more data for forecasting/prediction. Additional wealth and data were generated by the agriculture and vast array of heterogenous products slaves made. This resulted in even more wealth.
The British East India Company, one of the largest profiteers of slavery, as of 1805 amassed over $1.3 billion USD because of the wealth generated by slavery (Richards, 2011). The US plantation economy would have generated massive amounts data, that were to improve profits and efficiency. Chattel slavery is the genesis of datafication and the contemporary data economy we are being swept up in.
The slavers grew into massive plantation economies, but more importantly, banking practices arose that created the need for data and datafication, storage, rapid retrieval, and the demand increase for more sophisticated accounting, and profit-making instruments. For example, the London stock exchange formally emerged in 1773 to meet that challenge (Smith, 1929).
In summary, the origins of contemporary data and data discourse in health, as well as the process that converts living breathing people into data units is the same process that free Indigenous peoples of West and Central Africa underwent when being converted into chattel slaves. This process of capture, datafication, cataloging, labeling, and repurposing of data (and lives) was developed and employed to increase profit, generate wealth, and facilitate convenience. Datafication removed the human (the datafied version/digital twin stands in its place) but allowed for a human to stay in the loop (the overseer plantation).
Deeper Dive
Further reading:
- Dark matters: On the surveillance of Blackness (Browne, 2015)
The logics, rationale, and actors driving current datafication of peoples’ bodies and health experiences in Canadian health care often share the same Euro-ancestry, structural social privilege and are the individual as well as collective beneficiaries of the wealth and data systems whose development was catalyzed through the transatlantic slave trade.
The economic value of the 4 million slaves in 1860 was, on average, $1,000 per person, or about $4 billion total. That was more than all the banks, railroads, and factories in the U.S. were worth at the time. In today’s dollars, that would come out to as much as $42 trillion, accounting for inflation and compounding interest. (Saraiva, 2021)
Their descendants continue to bear the brunt of datafication, the process of extracting the human-turning living beings into data units to be manipulated and reconfigured without consent for purposes yet to be decided. The history of data in the New World has become the historical origin story of data and datafication of the entire world. As the new data-driven economy emerges from the avails of slavery, the only difference is how the process is being repackaged as data for equity. But the combined wealth of the Big Six: Alphabet (Google), Amazon, Apple, Facebook, and Microsoft in 2019 was only $900 billion USD, this still falls frighteningly short of the $42 trillion USD value of 4 million slaves in the USA in 1860. Nor does it account for the wealth and data generated from their bodies and lives.
Black people have not benefited from being dehumanized into data. An example of this is with Henrietta Lacks and HeLA cells (Skloot, 2011). Her cells continue to be exploited for the benefit of universities, corporations, and scientists, and white people derive the vast majority of all the clinical advances, as her children and extended family die of poor health care and limited income.
In Canadian law, the definition of equity is analogous to substantive equality, and the term describes a disequilibrium that must be remedied. Substantive equality, rather, is aimed at “recognizing and responding to difference and remedying discrimination and stereotyping” (Law Society of Ontario, 2022). It requires “acknowledgment of and response to differences that members of a particular group might experience” in order to be treated equally.
What Do We Mean By Health (In)Equity?
Health Inequality or Inequity or Injustice: Trifles of Language?
The jargon surrounding injustice places unfairness on a scale of how much is minimally acceptable through the divergent uses and intended meanings of the words equality and equity. Often, health inequalities are defined as measurable differences in health between individuals or groups in a population. Some inequalities may even seem reasonable and not raise concerns around fairness. Over time, a transformation of perceived justice led to the mainstream usage of the term equity.
Equality versus equity has become a topic of conversation within many sectors, but at their core, both definitions include an overall lack of fairness through systemic and avoidable differences in treatment. Western medicine defines health as the absence of disease, but complicated that same thinking when it comes to what is just and fair. Inequities and inequalities are the absence of justice. Where that absence falls on a scale is largely irrelevant to understanding that the system is unjust for some and not others. Intersections of social determinants of health, including race, gender, class, and ability, are factors that interact to determine how visible and measurable those injustices are.
However, health inequity is not just about unfair differences in health outcomes or exposure to health threats, but also the complex social, political, and economic processes and ideas that determine whether optimal health is distributed fairly across societies.
Health inequity also refers to the mechanisms that concentrate power among a privileged few (e.g., colonialism, white supremacy, capitalism, sexism) and the resulting process of exclusion of others from the same access and rights to optimal health as that privileged minority (Breilh, 2021).
Deeper Dive
For key terms and overviews of key concepts on social determinants of health and health equity, check out:
- A Glossary for Health Inequalities (Kawachi et al., 2002)
- World Health Organization “Closing the Gap” report (Commission on the Social Determinants of Health, 2008)
- World Health Organization “COVID-19 and the social determinants of health and health equity” report (World Health Organization, 2021)
- National Academies of Science, Engineering, and Medicine “Communities in Action” report (National Academies of Sciences, Engineering, and Medicine, 2017)
Where Does Data Come From?
Many different data sources are used for quantifying or qualifying the extent of, predicting the likelihood of, or trying to explain the processes causing health inequity. Generally put, this data is produced by measuring people, places, and systems.
People
A common approach to collecting data is asking people questions and then recording their responses using words or numbers. Table 2.1 shows a few ways data is collected and created to measure inequities.
| Method | Example | Further Reading |
| Public and Community Surveys |
|
|
| Health Care Setting Surveys and Interviews |
|
|
| Interactions with Service Providers | Information recorded in:
|
|
| Interactions with Technology | Information extracted through:
|
|
Places
Data from people can also be summarized to create data on the places we live. Survey or registry data are often summarized (i.e., by calculating percentages, means, medians, or other statistics) across everyone living within specific postal codes to examine how health and the determinants of health vary across geographic areas and neighbourhoods (Centres for Disease Control and Prevention, 2022; Diez Roux, 2016; Statistics Canada, 2022a).
Publicly available or “open” data collected by governments and public organizations through routine processes, evaluations, and required reporting can also serve as data sources on employment, businesses, housing, transportation infrastructure, crime and criminalization, water sanitation, recreation space, natural resource extraction, land management among many other areas (City of Toronto, 2022; Government of Canada, n.d.; OpenStreetMap, 2022).
Geographic information systems are a tool for visualizing and generating data on people’s social, built, and natural environments, access to services and essentials of daily living (Green, 2012; Wang, 2020).
Systems
Data detailing the characteristics of, and priorities advanced by, health, economic, justice, political, and other systems in society are harder to pin-point (e.g., organizational structure, enacted values, governance, financing).
However, with some effort, this data can be gathered from, for example:
- People performing or experiencing functions of a system (See Section 3: Indigenous Data Sovereignty for information about “Indigenous Peoples’ Data”);
- Written and unwritten policy or rules; and
- The presence or absence of publicly available legal documents (Krieger, 2020).
Take a look at the approaches Dr. Nancy Kreiger (2020) compiled in Table 3 of their paper specifically for measuring racism, sexism, heterosexism, and gender binarism. Another interesting resource is the Canadian Institute for Health Information’s Cultural Safety in Health Systems Indicators (Canadian Institute for Health Information, 2021). This document aims to support health system administrators and researchers in assessing strengths and areas for improvement in addressing anti-Indigenous racism within their organizations.
Measuring Health Inequality and Inequity
Three key tasks in the field of data science are generally to describe, predict, and understand cause and effect relationships (Hernán et al., 2019). These tasks are also commonly used to assess health inequity.
Description – How Big Is the Issue?
Statistics like percentages and averages are used to compare differences in health across predefined categories of social, demographic, geographic, and other characteristics (e.g., race or gender or income or place of residence). Similar statistics can also be mapped using geographic data to describe inequity.
In May 2020, journalist Matt Elliot tweeted this photo of a map of Toronto with its bus routes highlighted according to their levels of overcrowding early in the COVID-19 pandemic. The routes with greater overcrowding were lit-up and shown as thicker lines as if they were “hot” compared to routes with less or no overcrowding. A subsequent article in The Local described how the patterns of overcrowding and risk of COVID-19 exposure were not random but the latest example of inequitable distribution of health risk that largely working class and racialized communities navigate compared to higher-income and largely white communities (Huynh, 2020).
Prediction – Who Is at Risk?
Analytic approaches like regression modeling or machine learning algorithms are used to see whether social and demographic factors are correlated with and can improve the prediction of health outcomes.
QUICK SIDENOTE: Intersectionality
It’s important to remember that if you’re grouping people using social and demographic characteristics, you are assuming:
- That there are meaningful “cut-offs” or differences between people identifying (or being made to identify) with each category; and
- That there are no meaningful differences between people within categories.
Socially constructed categories of gender, race, and class don’t have objective boundaries (Krieger, 2020). Furthermore, our expressions of femininity and masculinity, the darkness and lightness of our skin, and our economic resources – and thus our experiences of privilege, oppression, inclusion, and marginalization – overlap and intersect in complex ways and evolve over time (Bowleg, 2012; Krieger, 2020). Henceforth, analyses of equity need to carefully consider and apply intersectionality.
For more on intersectionality theory and analysis see:
- Abrams et al. (2020)
- Bauer et al. (2021)
- Bowleg (2012)
Cause-And-Effect – What Is Causing Inequity?
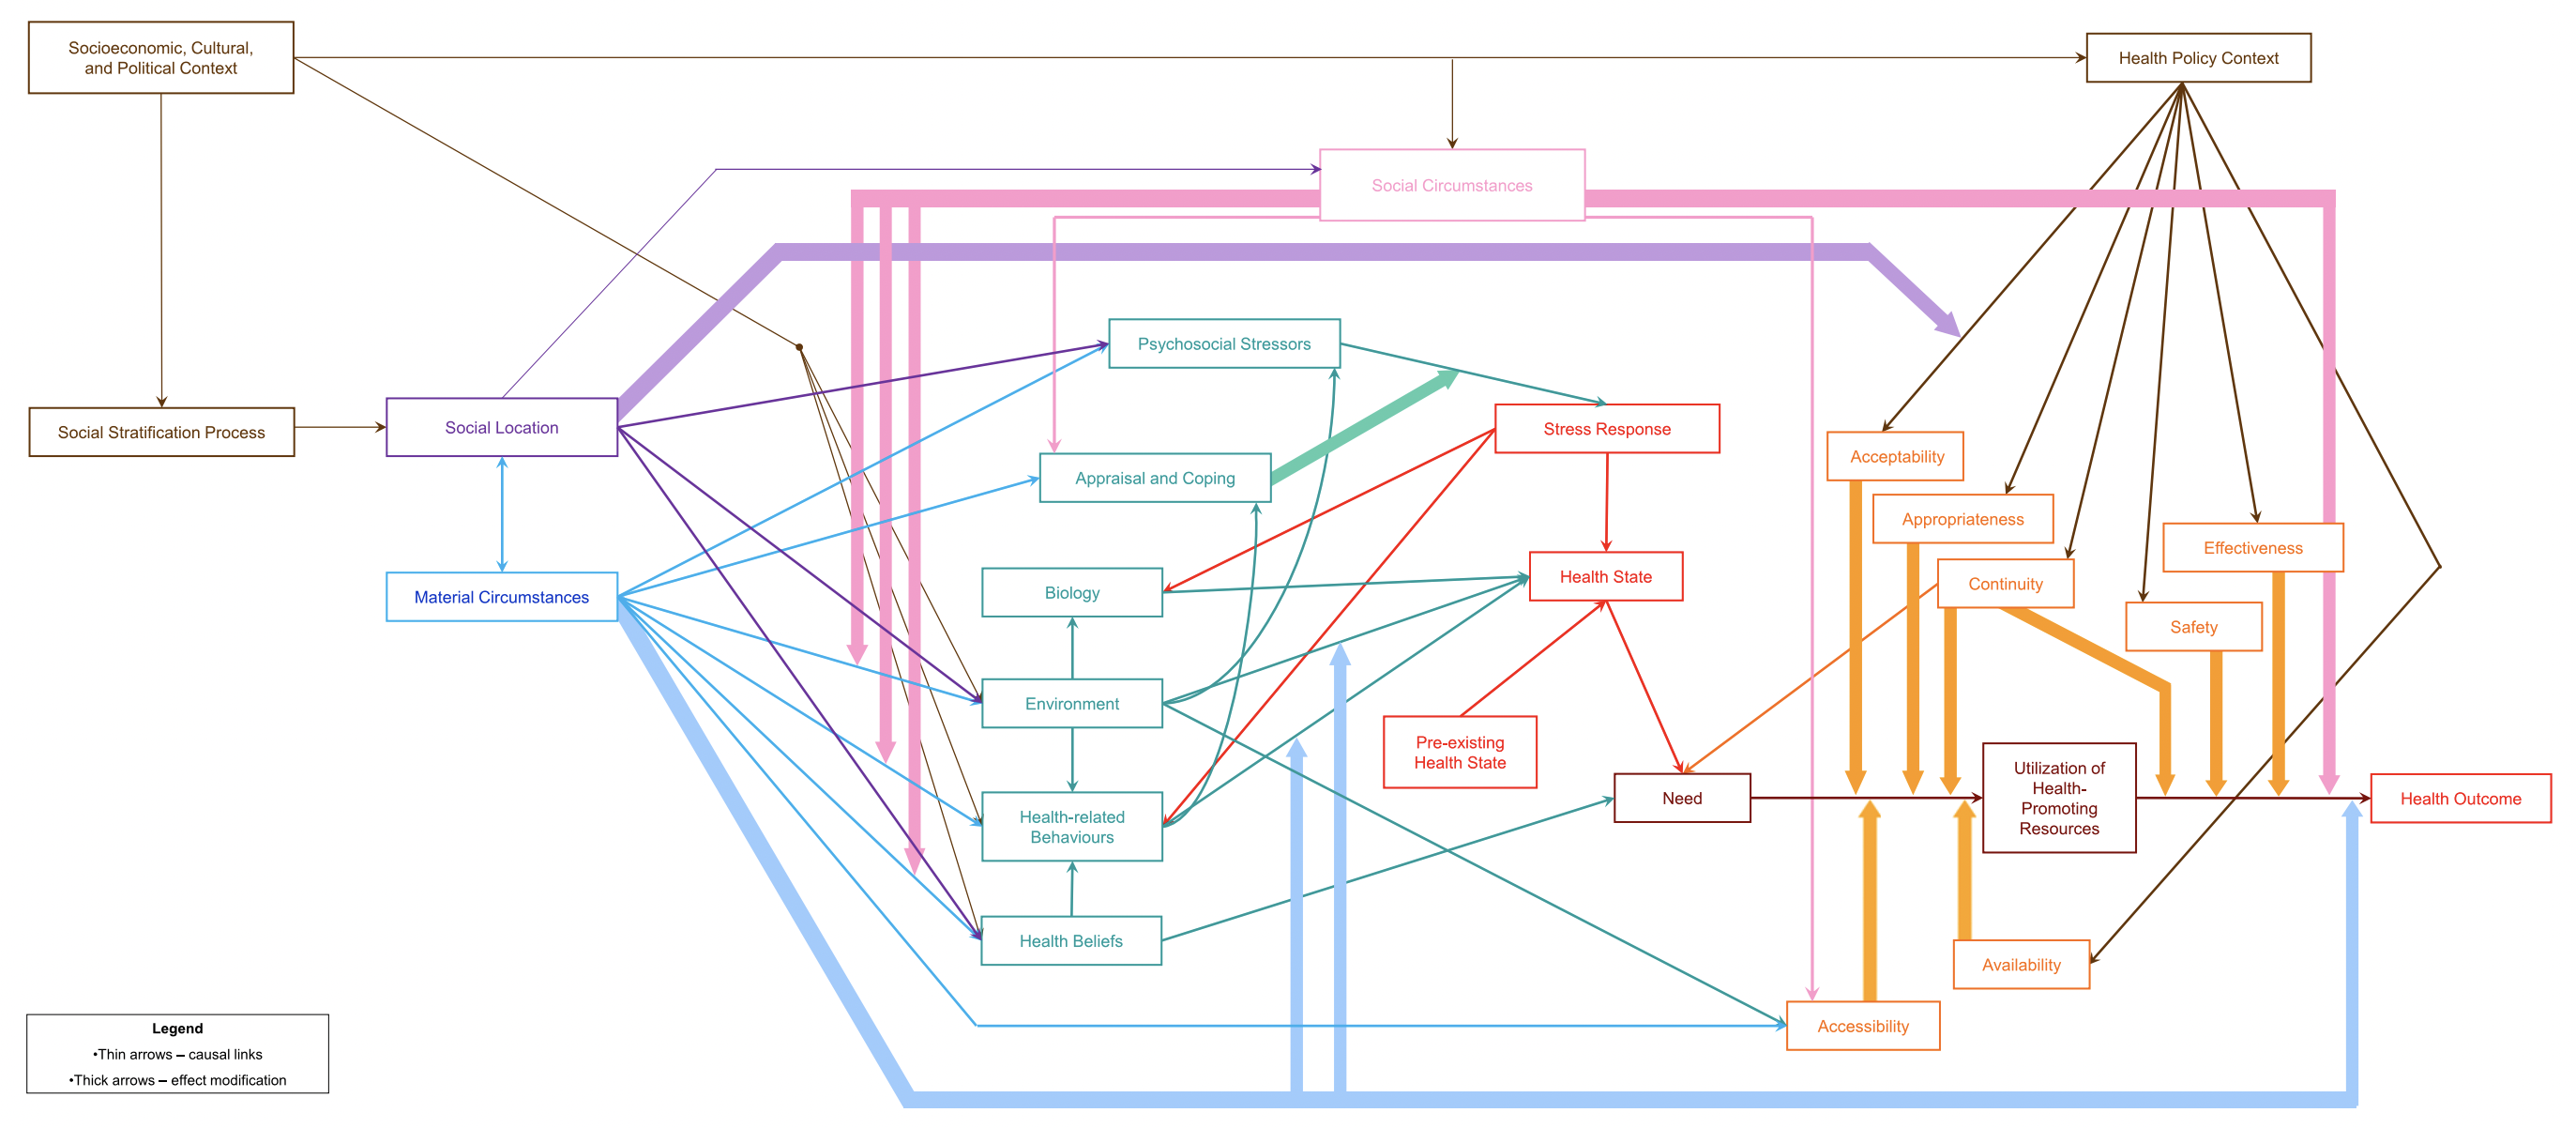
To estimate whether social determinants of health cause or influence the physiology of health and specific illnesses, or put another way, whether statistical tests suggest the arrows in Figure 2.1 connect the boxes, approaches like regression analysis (carefully using a causal inference framework) may be used. Click here to see a larger image of Figure 2.1.
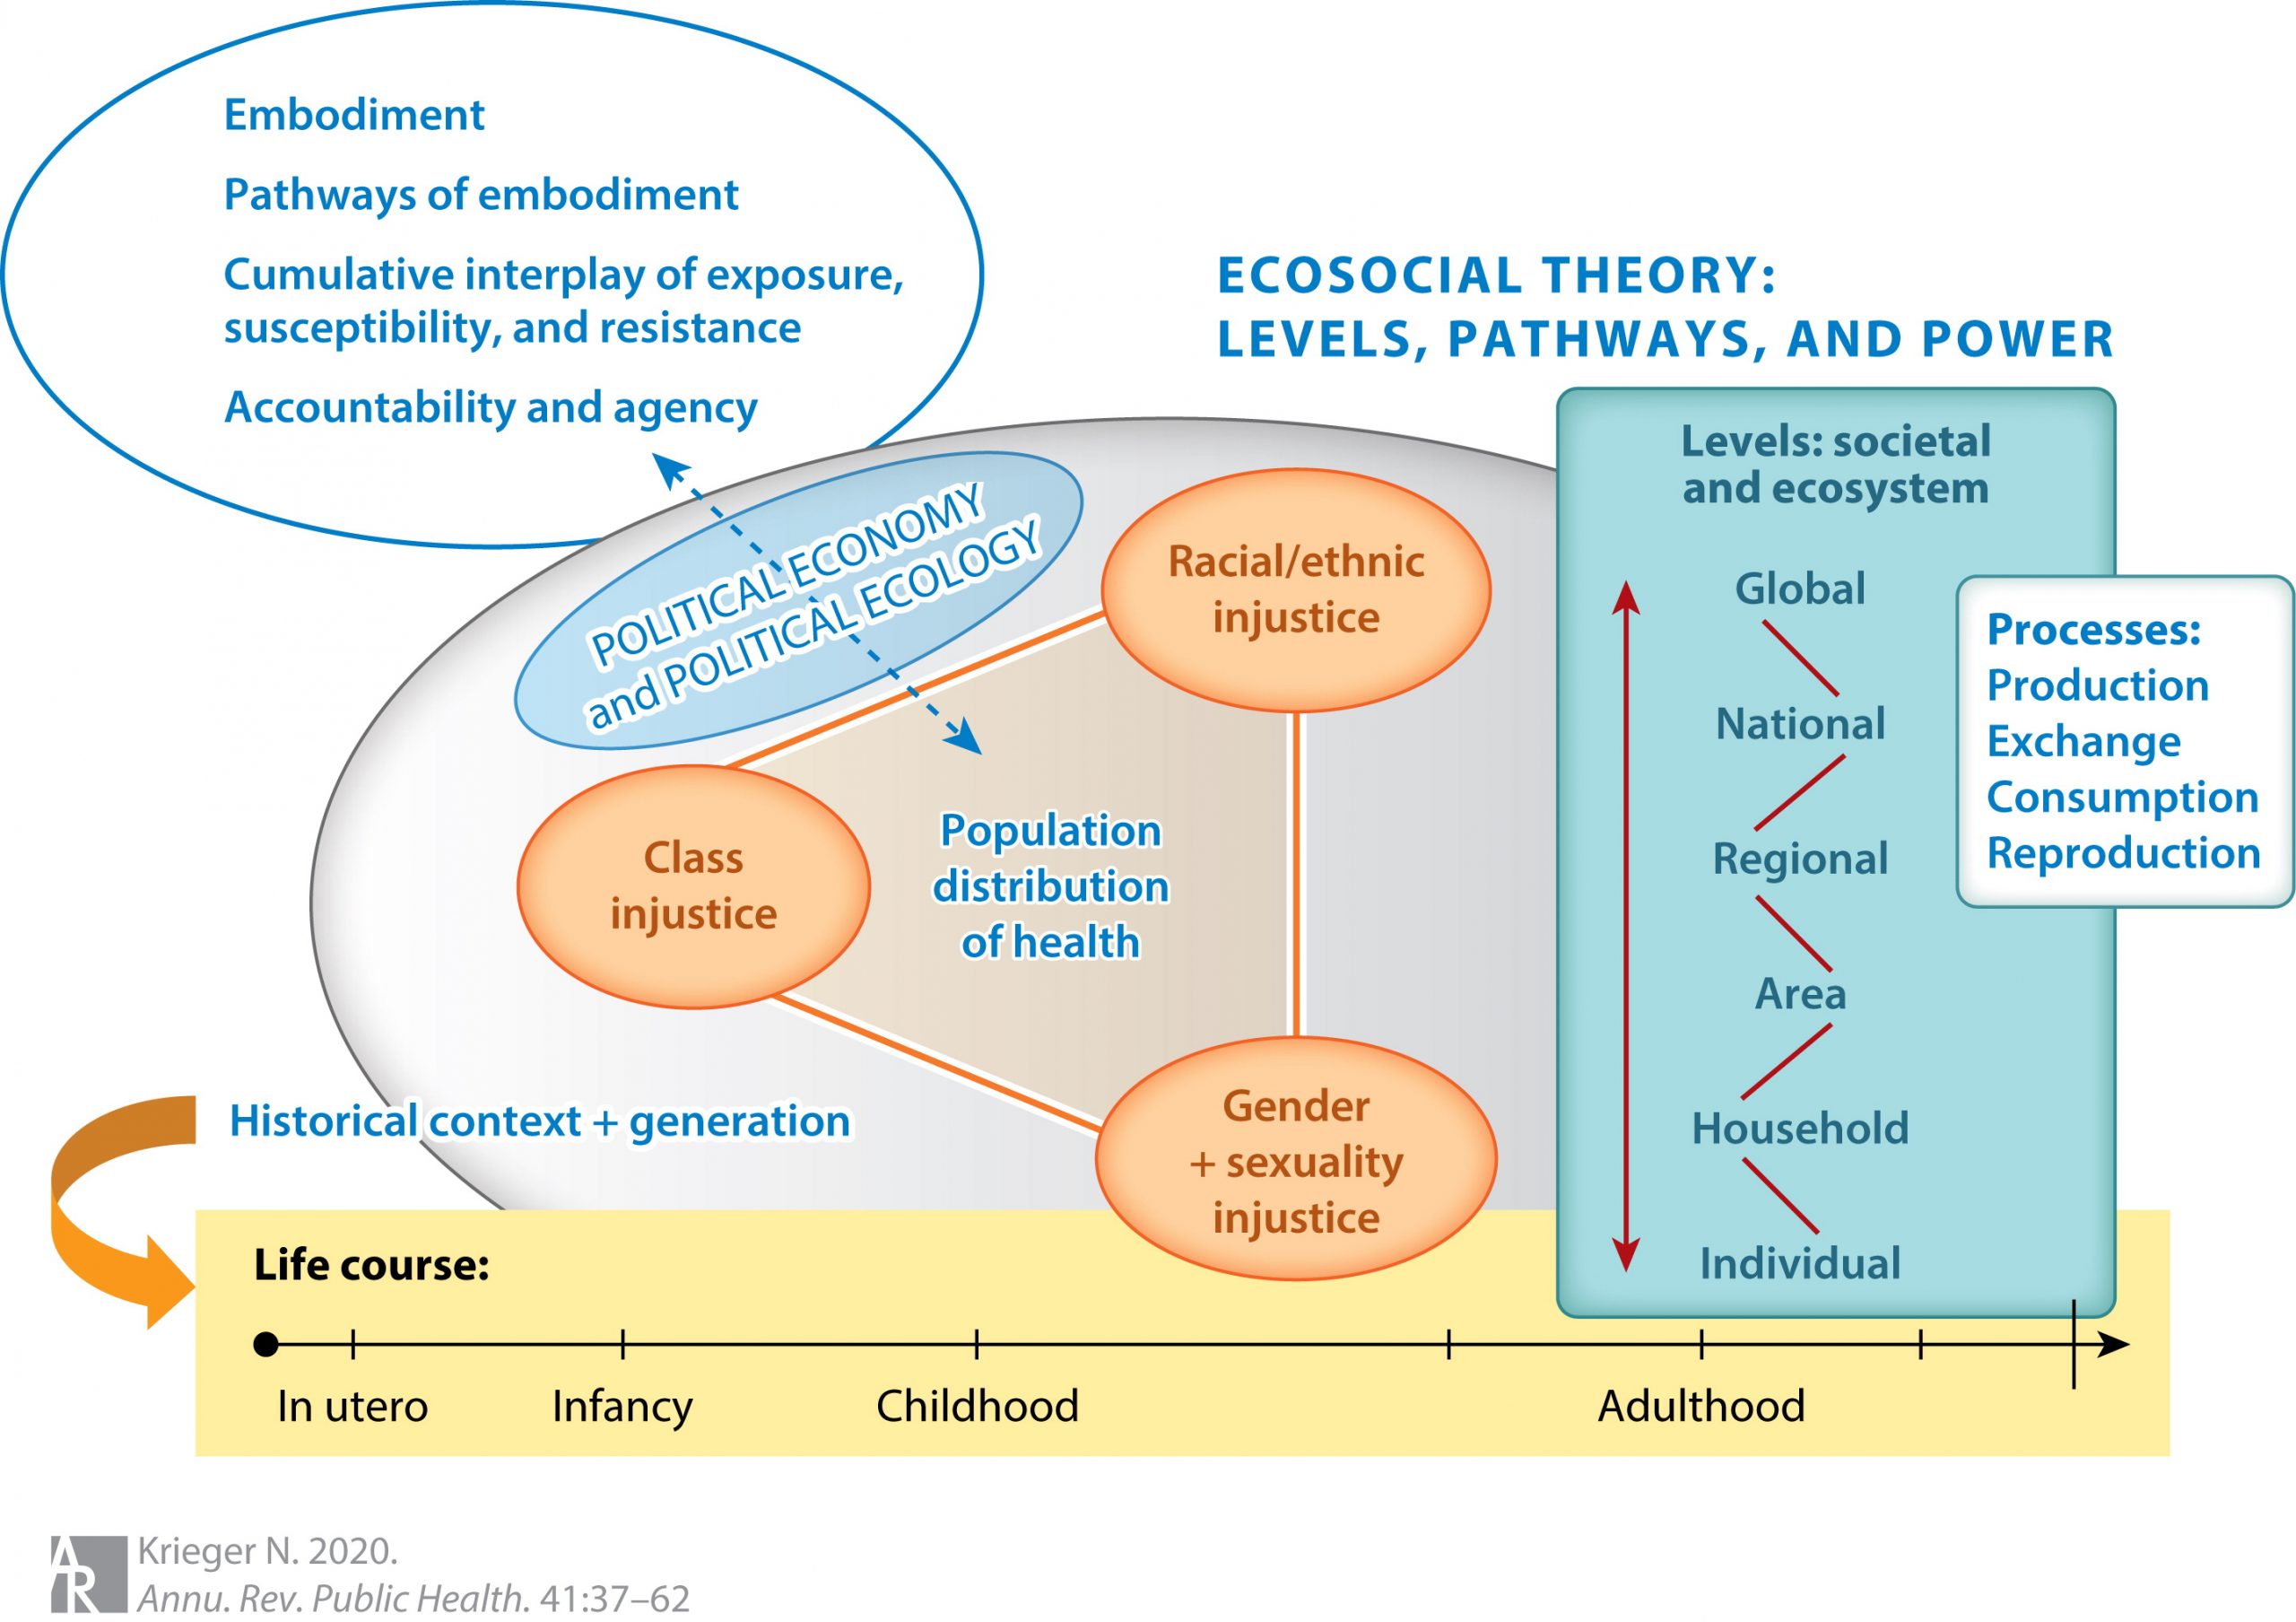
Another approach used to examine cause-and-effect relationships is testing whether, under specific conditions, changes made to policies (e.g., segregation) or services (e.g., models of health care that support patients with affordable housing) are followed by improvements in health. Take a look at Figure 2.2 below – this is a diagram of the ecosocial theory of disease distribution (Krieger, 2020). Approaches like interrupted time series analysis can be used to assess whether policy changes addressing forms of injustice (represented within the blue shaded oval labeled “Political Economy and Political Ecology”) result in changes in the population prevalence of illness and distribution of health.
Deeper Dive
To learn more about the strengths and limitations of these descriptive, predictive, and causal inference approaches to analyzing health inequity, here are a few key books:
- Social Epidemiology 2nd edition (Berkman et al., 2015)
- Rethinking Social Epidemiology: Towards a Science of Change (O’Campo & Dunn, 2011)
- Modern Epidemiology 4th edition (Rothman et al., 2021)
- Critical Epidemiology and the People’s Health (Breilh, 2021)
Test Your Knowledge
- How is data related to colonization and intersecting forms of oppression and unfairness?
- How are health inequality, inequity, and injustice the same?
- What are three sources of data on social determinants of health that can be collected by measuring each of the following: people, places, and systems?
- What are three general types of analysis used to examine health inequities?
Achieving parity in policy, process, and outcomes for historically and/or currently underrepresented and/or marginalized people and groups while accounting for diversity (The University of British Columbia, n.d.).
(1) Information and knowledge about the environment, lands, skies, resources, and non-humans with which they have relations; (2) Information about Indigenous persons such as administrative, census, health, social, commercial, and corporate; and (3) Information and knowledge about Indigenous Peoples as collectives, including traditional and cultural information, oral histories, ancestral and clan knowledge, cultural sites, and stories, belongings (Carroll et al., 2020, p. 3).
An active, intentional, and continuous process to address inequities in power and privilege, and build a respectful and diverse community that ensures welcoming spaces and opportunities to flourish for all (The University of British Columbia, n.d.).
