Module 2: Life Records
Lesson 2.2: Understanding Social Networks through Parish Registers
Introduction
The Catholic Church was a pivotal institution in Mi’kma’ki and Acadie but was slow to grow over the 17th century. Some of the first Europeans to visit this area were Catholic priests like Pierre Biard and Enemond Masse. Because of regular conflict with the English, however, it was not until the 1680s that the church began to establish itself in the region, with local parish churches taking root in places like Minas and Beaubassin. Though they were never well supported, these parish churches played a significant role in structuring daily and seasonal life, especially after 1713 when Britain allowed Catholic priests to continue operating in the space they now called Nova Scotia.
By the 1710s, the Catholic church was well entrenched in the culture of the region. As we have already seen from the 1708 census, by that decade missionary Antoine Gaulin had begun to lay the groundwork for the church’s relationship with the Mi’kmaq. If you refer back to the documents we studied in lesson 1, you can also see the importance of the church in the way Acadian society was structured around parishes. A parish is a geographical unit, centred around a church and usually – though not always in Acadie – assigned a priest. In a place like Acadie, and a time period like the 18th century, the parish church was usually the only institutional structure in a community. As such it served not only a religious role, but a political and social role as well.
The most important work of the church was to ensure that the people living under its authority received Catholicism’s Holy Sacraments. Though records of Mass and first communion were either not kept or have not survived, the church was much more diligent in recording baptisms, marriages, and burials. By the turn of the 18th century, the recording of these rites of passage had become part of Catholic law. These church records served a purpose not unlike that which birth certificates, marriage licenses, and death certificates do today. Unlike today, however, the rules about the keeping of these records developed during a time when church and state were deeply intertwined. Knowing when a person was born, married, and died was important information for legal proceedings (such as inheritance) and state building (such as taxes). The church – with its local footprint in a parish – served as a tool for recording and safekeeping this information.
Using Parish Registers
Much like the censuses explored in the last lesson, parish registers can be difficult sources to use. On the surface, each record appears to convey very little information. Usually all that is noted in these records are the names of participants, the date, their relationship to each other, the type of religious event (usually a baptism, burial, or marriage), and the name of the priest presiding over it. Individually, these records provide very little information about a community. Taken together, however, these records can be much more powerful, revealing to us important information about prominent individuals and families within a community.
To get a feel for parish registers, we have transcribed and translated twenty-two records from the Beaubassin Parish Records for you. These records are from the Acadian community of Beaubassin during the early 1720s. There are thousands of these French, hand-written records available. These twenty-two were selected for being both representative of the larger collection, yet also unique, given that they also include a handful of Mi’kmaw participants.
Learning Outcomes
By the end of this lesson, you should be able to:
- Describe the basic structure of 18th-century Catholic parish registers and how historians can use them.
- Use MS Excel to re-organize and analyze the data derived from the parish registers.
- Build and analyze a basic social network using Gephi.
Technologies used for this lesson
- Gephi is a visualization and exploration software for graphs and networks. Gephi is open-source and free. It runs on Windows, Mac OS X and Linux. Gephi support, privacy policy, terms of use.
- Microsoft Excel is a spreadsheet tool developed by Microsoft for Windows, macOS, Android and iOS.
Instructions
This is a unique lesson that follows a different structure from all of the other lessons you will complete in this course. You will find more detailed instructions about this lesson’s activities below the “Documents” section.
Documents
- Parish Register for Beaubassin in Acadie covering the period from the 9th July 1712 to the 9th May 1723, Archives départementales de la Charente-Maritime, site de La Rochelle.
- These records were created by the Sulpician missionary Rene-Charles Breslay. Trained in France, Breslay arrived in the Saint Lawrence Valley in 1694. While visiting France in 1719, he encountered the seigneur of Ile Saint Jean and was compelled to move their in 1720. In this capacity, as the first priest to live on Epekwitk (Ile Saint Jean), he also served as the missionary at Chignecto. These records were created near the end of his term in this part of Mi’kma’ki, though he later served at Louisbourg and Annapolis Royal before returning to France in 1729.
- Click here (Beaubassin Parish Records) to access the twenty-two records from folios 11 to 14v that have been transcribed for this exercise.
Introducing Gephi
To develop a deeper understanding of what parish records can teach us, we will use the open source tool Gephi to build a basic social network.
If you have not done so already, download and open Gephi.
Gephi is a fairly straightforward program that helps reveal connections between records. To do social network analysis with Gephi, you need two types of information:
- Nodes – the entities under examination; in our case, the people noted on the documents;
- Edges – the relationships between the nodes; in our case, (for example) baptisms.
For the religious events we’re looking at, there are four types of relationships we will use:
- Child: the relationship between a parent and child;
- Spouse: the relationship between parents;
- Godparent: the relationship between godparents and baptized person;
- Act: the relationship between any people for whom their relationship is unknown (godparents and parents, for example).
The word “Act” is used for relationships that are unclear. In these cases, all we know is that these two people appeared in the same record together; the record does not provide any additional information about the relationship between these nodes.
Developing Excel Sheets (.csv files)
Now, let’s build up the files that we will need to import into Gephi to conduct our social network analysis. To do this, you will need to create several comma-separated value (CSV) files. It is easiest to do this in MS Excel. Just make sure that when you are saving your file, you make the file type .csv rather than using Excel’s default setting. If you know how to build an Excel file, go ahead; if you’re new to Excel, watch this quick video introduction to Excel.
To help you better organize this information we will demonstrate the process, using the first baptism in the transcriptions that we have provided to you as our example:
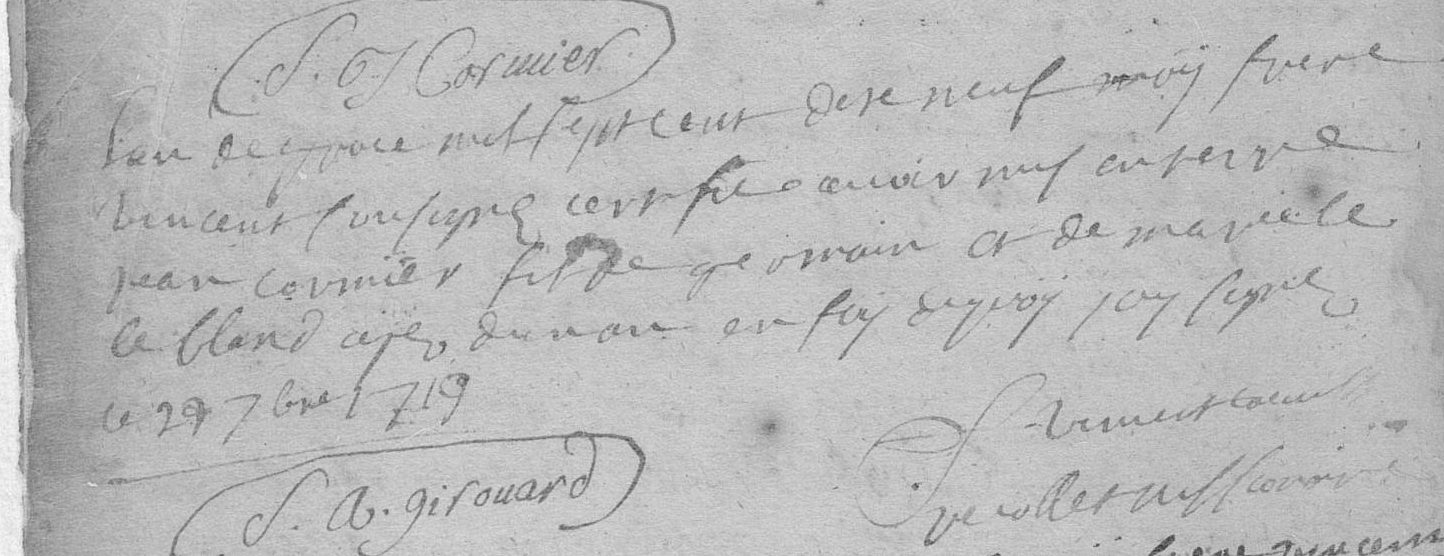
“On the first day of the month of June of the year seventeen hundred twenty-three I the undersigned René Charles de Breslay Missionary priest and parish pastor of Lisle de St. Jean and other dependencies and vicar general of Monsignor bishop of kebec baptized for lack of a parish priest and doing the curial functions of this parish of Beaubassin Joseph son of Michel Chikaguet sauvage Mikmaque and of Marguerite Bernard his wife aged about one month The godfather Guillaume sire inhabitant of this parish The Godmother Anne Blanchard wife of claude Bourgeois also inhabitant of the said parish which declared not to know how to sign, as required by the ordinance.”
To transform this record into information that is readable through Gephi, make a table like the one shown below, which includes all of the information you know about each person mentioned in the transcription. In this record, we have noted the record number, the person’s name, their role in the act, and their ethnicity (“M” for Mi’kmaq and “F” for French). Generally, we can assume that a person’s ethnicity is French, unless the act specifically states otherwise. This table will become the basis for your Node Attributes table. Be sure to save it as a .csv file (call it Beaubassin Node Attributes).
| Record | ID | Role | Ethnicity |
| 1 | Joseph | Baptized | M |
| 1 | Michel Chikaguet | Father | M |
| 1 | Marguerite Bernard | Mother | M |
| 1 | Guillaume Sire | Godparent | F |
| 1 | Anne Blanchard | Godparent | F |
| 1 | Claude Bourgeois | Spouse of Anne Blanchard | M |
Notes on Reading the Records
One difference between this table and the record itself is that we have chosen to record Marguerite Bernard as Mi’kmaw. We have made this choice because Marguerite’s identity is not otherwise stated. Though it might be more accurate to list her identity as uncertain, if you look at the next record we have transcribed, that of Cécile – wife of François 8abniketch – it is clear that she is Mi’kmaw (though again without annotation). We have chosen to interpret the identity of ethnically-unidentified married partners and children as the same as their ethnically-identified partners or parents. These are important decisions that need to be made in advance, before importing the table into Gephi, in order to ensure your records are consistent and that your methods are transparent.
As you build this table you will notice that there are some records that provide more detail than what we have provided in this example. One good example is the role of the ondoié. This French word is difficult to translate. It refers to someone other than a priest who has performed a baptism. The term ondoiement means “emergency baptism.” Give some consideration to how you will include people in this role in your tables.
Standardizing the Records
Once complete, you will want to standardize your records. To do this, click on the “Data” tab at the top of your screen. Click on “Sort.” In the menu, sort by “Name.” Now scroll through your records to ensure that there are no records that will lead to confusion. For any entries with the same name but who are clearly two different people (such as the two ‘Anne’s in baptismal records 12 and 13), rename them using numbers to distinguish one person from the other. Because it is clear that this is not the same “Anne” being baptized, use the label “Anne – 1” for the person in Act 12 and “Anne – 2” for the person in Act 13. Keep note of these decisions in a separate file as you conduct your work. This way you will be able to remind your future self about the decisions you made. If you were doing a larger project, you would also want to consult the work of genealogists like Bona Arsenault and Stephen White to confirm identities.
Once you have made this table, it will be easier to identify the relationships involved in each baptism. Now, it is time to make your relationships table (call it Beaubassin Relationships). Here, starting with your primary person (Joseph, in this case), enter each of the relationships found in this record.
Your table should look like this, with the frequency of each name in the “Source” column decreasing as you work through each participant. For this record, each person should appear a total of five times between the “Source” and “Target” columns. Here is what the table should look like once you are finished:
| Record ID | Source | Relationship | Target |
| 1 | Joseph | Child | Michel Chikaguet |
| 1 | Joseph | Child | Marguerite Bernard |
| 1 | Joseph | Godparent | Guillaume Sire |
| 1 | Joseph | Godparent | Anne Blanchard |
| 1 | Joseph | Act | Claude Bourgeois |
| 1 | Michel Chikaguet | Spouse | Marguerite Bernard |
| 1 | Michel Chikaguet | Act | Guillaume Sire |
| 1 | Michel Chikaguet | Act | Anne Blanchard |
| 1 | Michel Chikaguet | Act | Claude Bourgeois |
| 1 | Marguerite Bernard | Act | Guillaume Sire |
| 1 | Marguerite Bernard | Act | Anne Blanchard |
| 1 | Marguerite Bernard | Act | Claude Bourgeois |
| 1 | Guillaume Sire | Act | Anne Blanchard |
| 1 | Guillaume Sire | Act | Claude Bourgeois |
| 1 | Anne Blanchard | Spouse | Claude Bourgeois |
You are almost ready to do some social network analysis. Before you import your spreadsheets into Gephi, there are a few additional changes you need to make.
In the first .csv (Excel) file (Node Attributes), you will notice that it is comprised of four columns: Record, ID, Role, and Ethnicity. This file is used to create the nodes in the social network we will build. A node is the entity (in this case, a person) who enters into a relationship with another node. Gephi will have difficulty reading this file because you have two ‘Anne’s. Before making any changes, save a backup version of the file under a different file name. Then, to make the file more legible, remove all of the duplicated people, ensuring that you have added numbers to the names of distinct individuals. Taking this action also means you should remove the “Record” and “Role” columns, because they are no longer necessary.
Uploading to Gephi
You can now import this file. To do this, click on the word “File” in the top left-hand corner, then click on “Import Spreadsheet.” Click on the Node Attributes file and follow the instructions. Once complete, your screen should look like this:
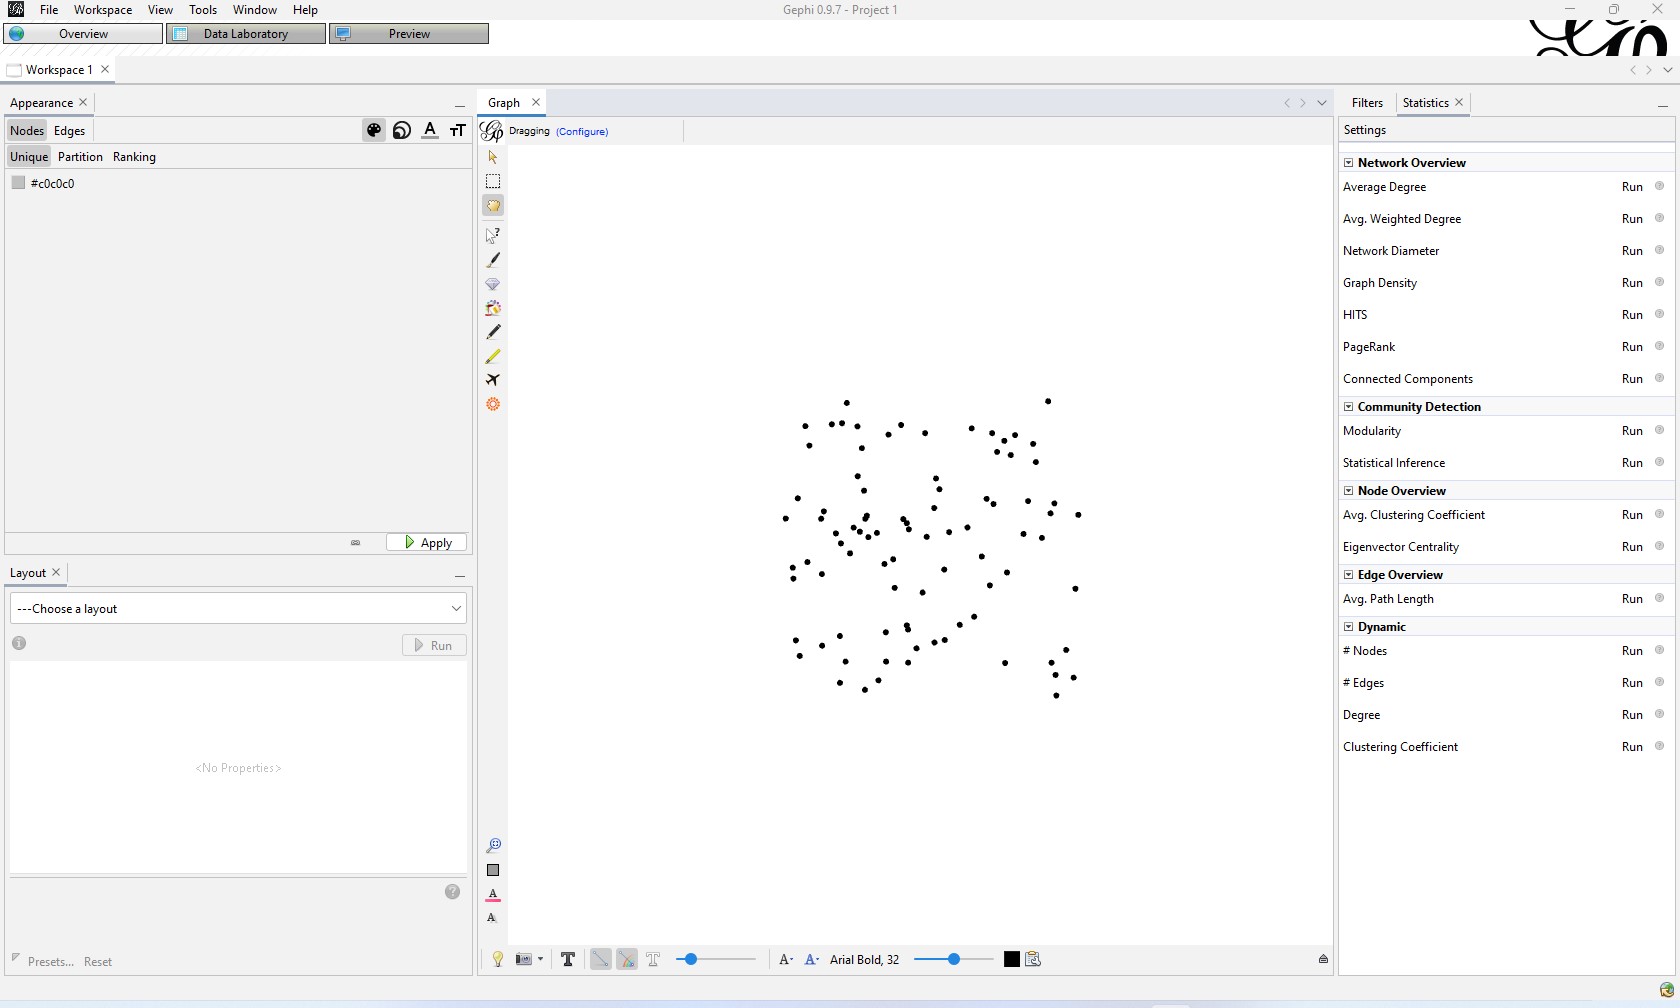
There is nothing yet here to analyze; it is simply a random graph of all the people included in your “Beaubassin Node Attributes” file.
Now it is time to add the relationships between each of the nodes/people. For this, you will use the “Beaubassin Relationships” file. This file creates what are called “edges.” An edge creates a relationship between two nodes. The two most important columns in this file are “Source” and “Target.” As you have likely noticed, these columns list the same names as the “ID” column in the “Node Attribute” file. The “Source” and “Target” columns define the nodes that are in relationship with each other. The “Relationship” column applies an attribute to the relationship. In this case, it describes the relationship between the two nodes (child, parent, spouse, and “act”).
In order for the software to read your file, you need to include an additional column: “Type”. You will need to add this column between the “Relationship” and “Target” columns. This additional column determines whether the edge is directed or undirected. For our purposes we are using undirected edges and do not need to consider this further at this time. Just enter “Undirected” in each of the rows in the “Type” column (use cut and paste).
Your table should now look like this:
| Record ID | Source | Type | Relationship | Target |
| 1 | Joseph | Undirected | Child | Michel Chikaguet |
| 1 | Joseph | Undirected | Child | Marguerite Bernard |
| 1 | Joseph | Undirected | Godparent | Guillaume Sire |
| 1 | Joseph | Undirected | Godparent | Anne Blanchard |
| 1 | Joseph | Undirected | Act | Claude Bourgeois |
| 1 | Michel Chikaguet | Undirected | Spouse | Marguerite Bernard |
| 1 | Michel Chikaguet | Undirected | Act | Guillaume Sire |
| 1 | Michel Chikaguet | Undirected | Act | Anne Blanchard |
| 1 | Michel Chikaguet | Undirected | Act | Claude Bourgeois |
| 1 | Marguerite Bernard | Undirected | Act | Guillaume Sire |
| 1 | Marguerite Bernard | Undirected | Act | Anne Blanchard |
| 1 | Marguerite Bernard | Undirected | Act | Claude Bourgeois |
| 1 | Guillaume Sire | Undirected | Act | Anne Blanchard |
| 1 | Guillaume Sire | Undirected | Act | Claude Bourgeois |
| 1 | Anne Blanchard | Undirected | Spouse | Claude Bourgeois |
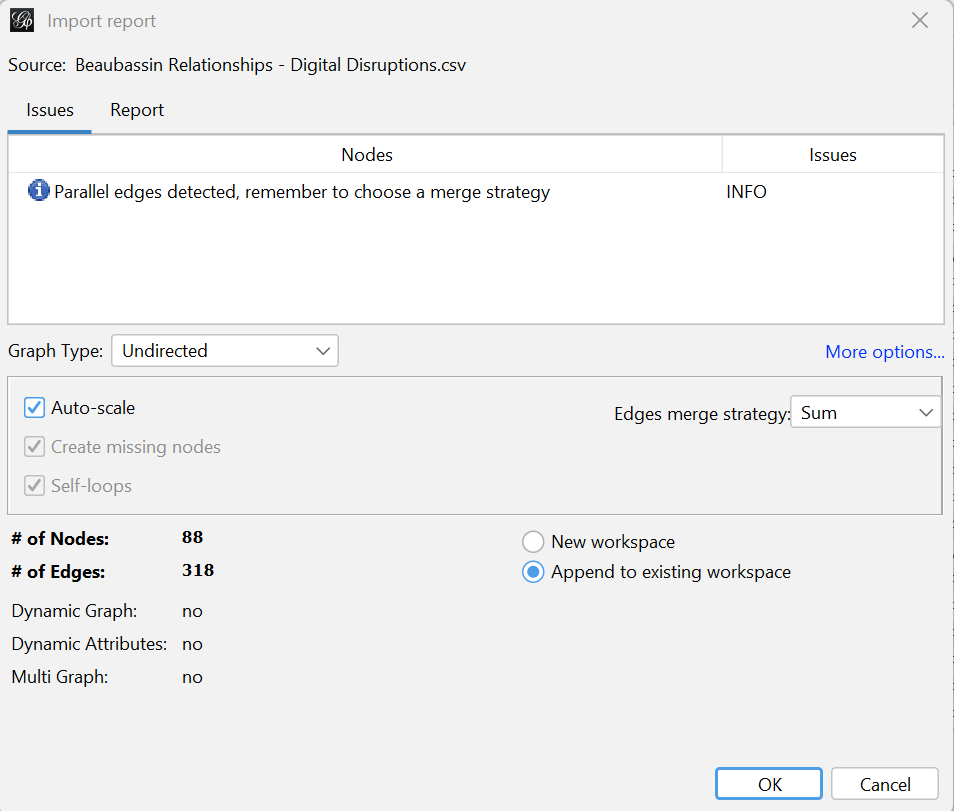
Use the same process as you just did for “Beaubassin Node Attributes” to load the “Beaubassin Relationships” file into Gephi. This time, though, when you get to the “Import Report” (the third pop-up) change the selection on the bottom right of the pop-up box from “New workspace” to “Append to existing workspace.”
Once complete, your screen should look like this:
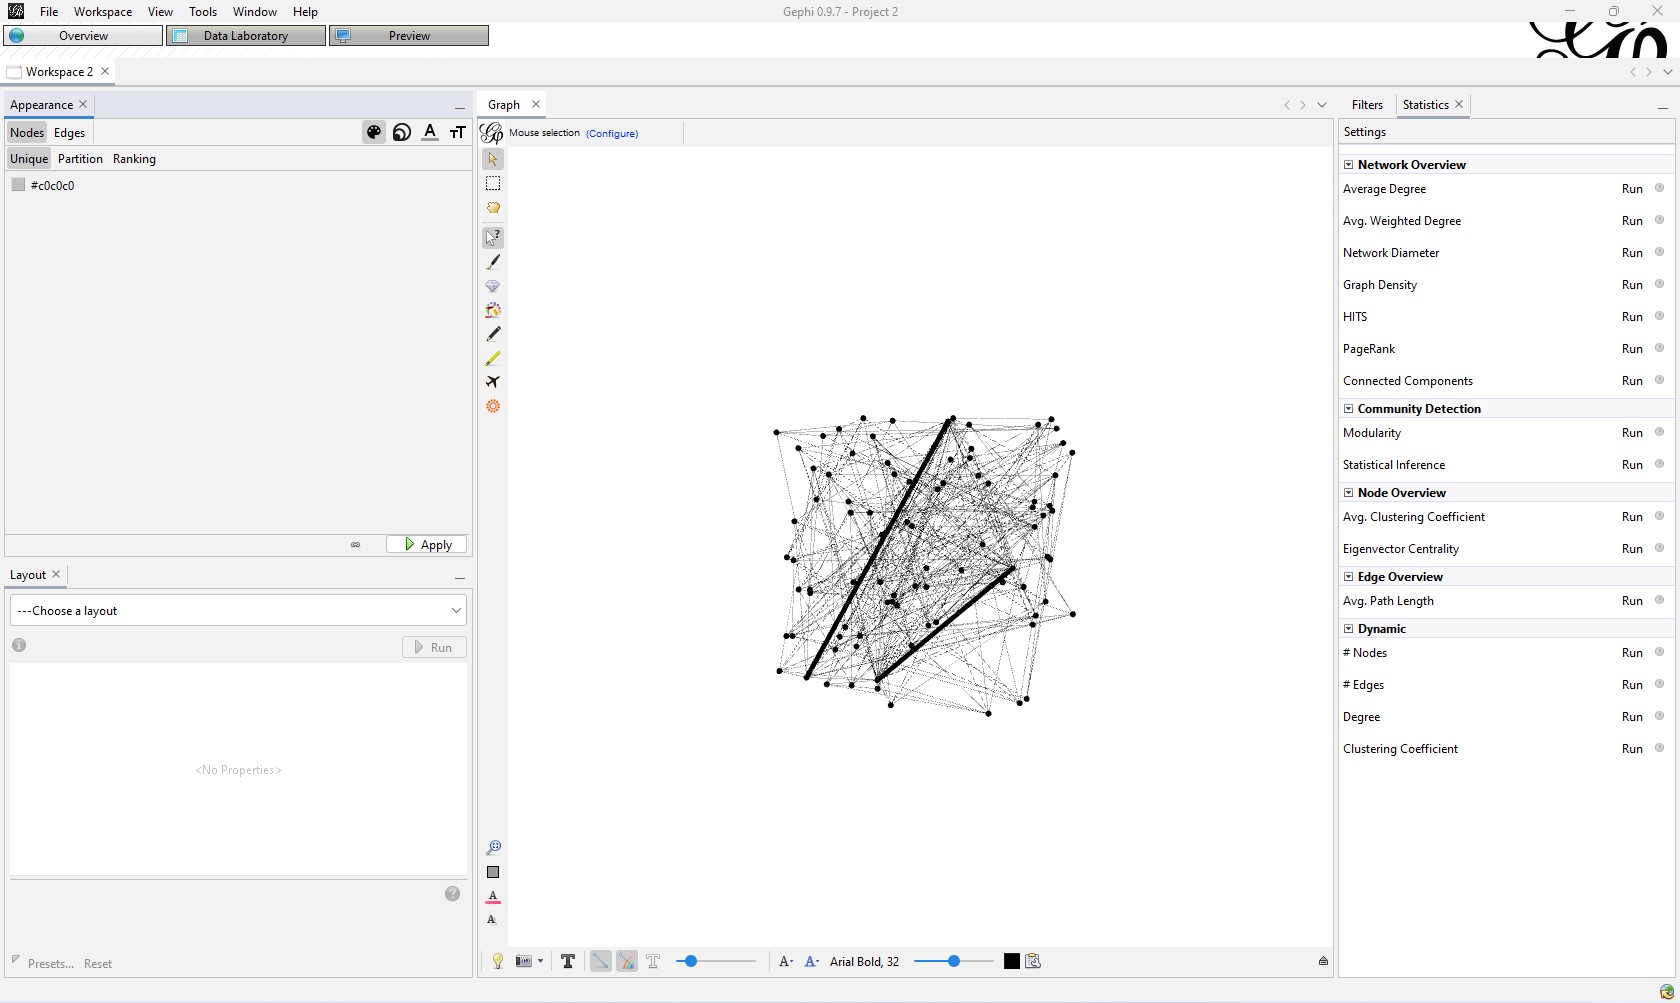
Now you have a social network graph to explore. Before doing so, though, click on the “Data Laboratory” tab – the second tab along the options bar above the graph box, between “Overview” and “Preview” – to see how Gephi has merged your two files.
Exploring the Social Network Graph
Returning to the graph, make navigating the graph easier by changing the node colours to represent ethnicity. To do this, click on “Partition” underneath “Nodes” and “Edges” in the top left side of the screen (“Nodes” should be shaded dark grey). A drop down box will appear. Click on “Ethnicity.”
Now, change the edge colours to represent the type of relationship. To do this, click on the word “Edges” above the word “Partition.” Click on “Partition” again and choose “Interaction.” Now your graph will be a little easier to understand. Your screen should look something like this:
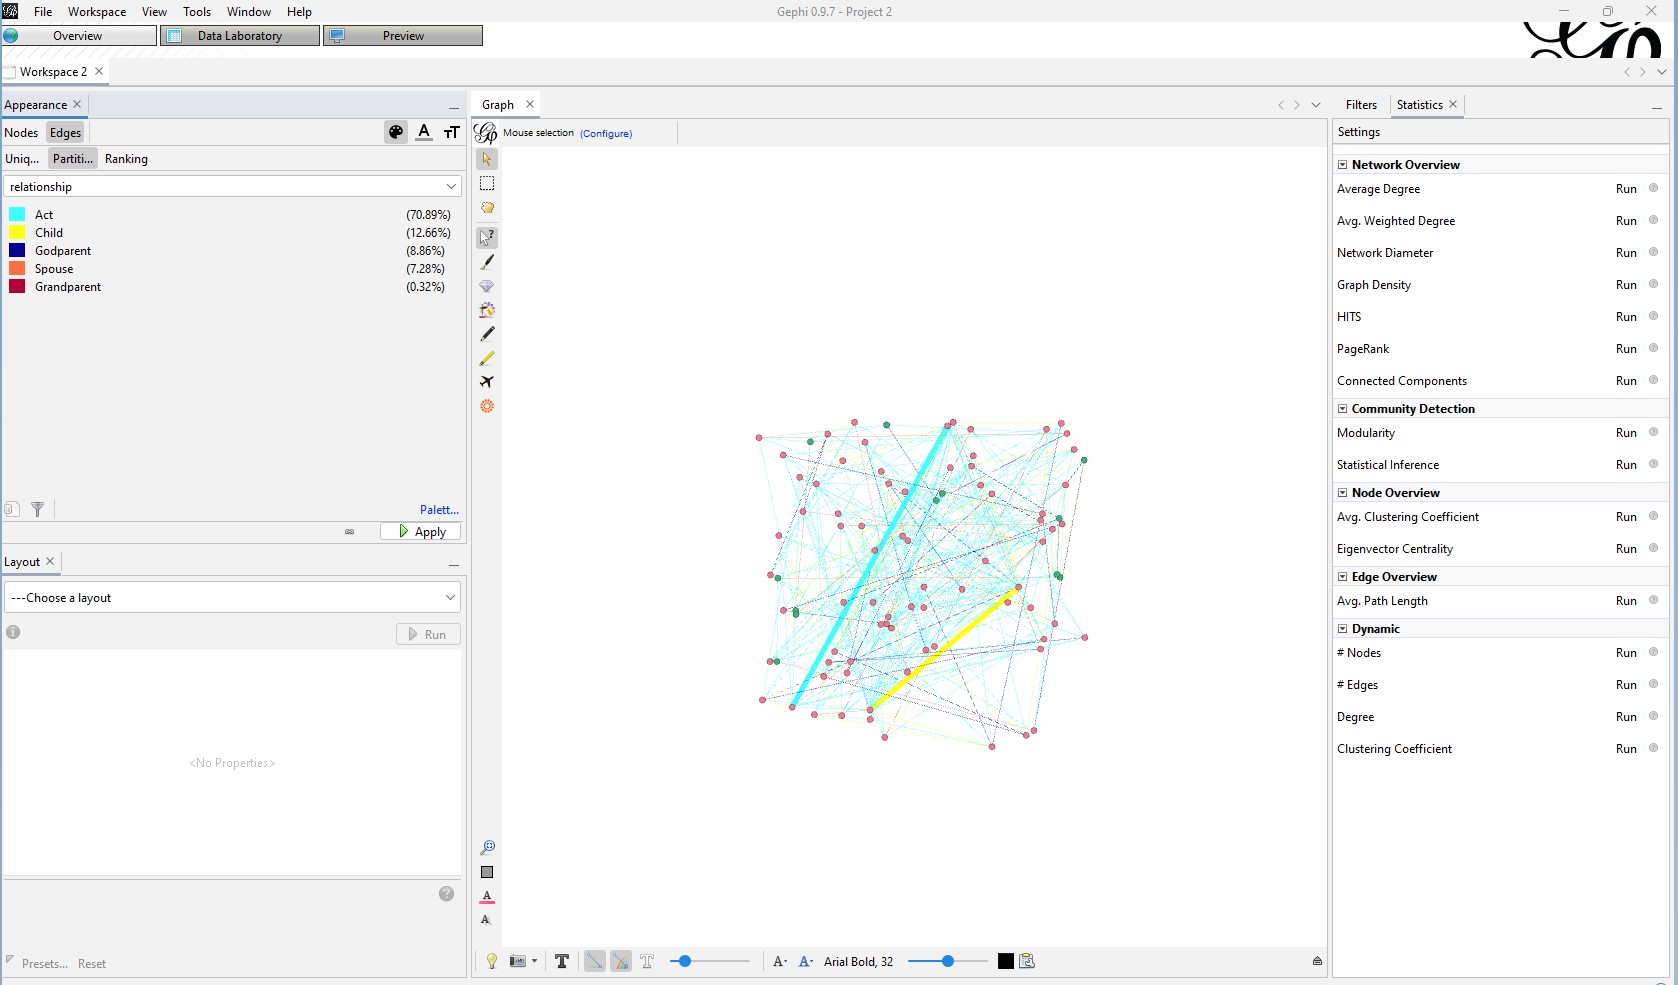
One way to interpret the graph is to look at what is called “Degree.” Beside the words “Nodes” and “Edges” on the left, you will notice a symbol with three circles. Click on it. Then click on “Ranking.” Then choose “Degree.” In the boxes that appear, keep “min” set to 1 and raise “max” to 14. You should now see three larger nodes. In the graph box (the central window), click on the icon with an arrow and question mark, then click on one of the larger nodes. The left sidebar will provide you with information about the node you have selected.
If you have done everything correctly, these three larger nodes should be ‘Michel Poirier,’ ‘Francois Poirier,’ or ‘Michel Bourk – 1.’
Use this clicker to explore other parts of the graph.
Next, take the time to play around with the layout options offered in the bottom left hand corner of the screen. Consider the following:
- What does each layout teach us about this dataset?
- How does representing the information in different ways help us think more deeply about this type of source?
Looking at the right sidebar on the screen, use the various statistical tools listed under “Statistics,” the tab to the right of “Details.” As you run these tools, Gephi will analyze your network. You will see numbers appear as you click these buttons.
If you switch back to “Data Laboratory,” you will also see that Gephi has provided analyses for each of your nodes. You can rank each of these categories to learn more about your specific network. The following list describes some of the basic categories for you to explore:
- Degree: The number of edges attached to a specific node.
- Eccentricity: The distance between a selected node and the node farthest from it.
- Closeness Centrality: The average distance from a selected node and all others in its network.
- Betweenness Centrality: How often a selected node is found on the shortest paths within a network.
- Modularity Class: This is an algorithm used to identify communities.
Conclusion
Now that you have explored the basic functionality of Gephi, return to your initial list of information that you gleaned from these twenty-two parish records.
- How does this social network analysis help you to see these records differently than you did when you first read through them?
- What insights might social network analysis provide to help us understand the history of Acadie?
- Taken together, what contributions can parish records make to our understanding of Acadian and Mi’kmaw histories?
Extend your learning
Now that you have done a little bit of social network analysis, why not investigate social networks at Port Royal, using the Port Royal parish registers available through the Government of Canada’s Open Data project.
