How to Use This Ebook
Phillip Ruscica
More detailed thin section images and site descriptions are available for instructors. Please email virtual.petrology.network@utoronto.ca
Introduction
This book utilizes the H5P framework in addition to embedded content from other websites to produce and display digital outcrops, hand samples, thin sections, and on-site photographs. Each type of content has its own interaction prompts and this sections explains how to navigate through them. Some interactions are common to the content types, such as clicking on the button on the top right to enable full-screen, and pressing escape on your keyboard to exit.
Additional information can be shown in any of the content types with a blue plus sign. Clicking on it will display relevant text, images, videos, or links.
Satellite Overview Image & Geologic Map Slider
Each site has an overview of its physical location with satellite data and the bedrock geology (Ontario Geological Survey OGS). This is displayed as an image juxtaposition where the clicking and dragging the white vertical bar changes between the two images. To access the legend on the OGS website, click on the link below the respective map at the beginning of each pressbook.
You can also navigate to the respective 3D outcrop model by selecting the plus sign in the legend.
Digital Outcrops
The digital outcrops have had their perspectives rendered in H5P and put into 360 virtual tours. This allows for the perspective to be changed by selecting an arrow on the outer perimeter of the image to move in that direction. You can go back to the previous perspective by selecting the back arrow in the top left of the image, or by selecting the respective direction.
Each of the outcrops contains a link to the 3D model. This link is located at the bottom left of each 360 virtual tour.
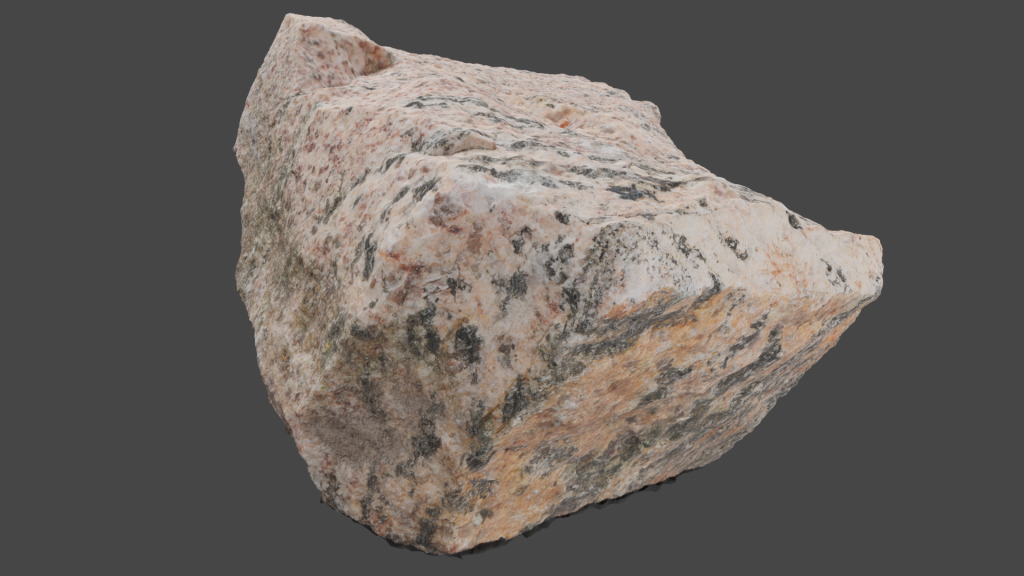
3D Models of Outcrops and Hand Samples
Each outcrop and hand sample can also be explored in detail on Sketchfab. You can open the model by expanding the text box by clicking on the blue plus sign and following the link. On Sketchfab, holding the left click on your mouse allows you to rotate the outcrop. Holding the scroll wheel down (also holding the right click) allows you to drag the outcrop. Use the scroll wheel to zoom toward or away from the outcrop.
Outcrop & Thin Section Imagery
The site images and corresponding thin sections are displayed with Google slide shows within the book.To move to the next slide, you can either click anywhere on it or use the controls on the bottom left. These controls allow you to go to the previous slide, next slide, and they show you the current slide number.
Additionally, higher magnification thin section close up views are shown as embedded YouTube videos. Click on the ‘Play’ button to start the video showing the rotation of the microscope’s stage.
Scanning Electron Microscope Results
Where available, results from the Scanning Electron Microscope (SEM) are displayed as a series of images. Click on the arrow on the right or left side to navigate between them.
Please send any questions, comments, or concerns to virtual.petrology.network@utoronto.ca
You should be ready to get the most out of all the interactions this book has to offer! Click on the link below to load the next chapter.
Go to the: Acknowledgements!

