Introduction to Our Students & Supports for Them
1 Demographic Information about our Undergraduate Students
Introduction
The Psychology Department at UTSC and the UTSC community more broadly are home to a highly diverse student population. This chapter serves to provide some context for the later chapters of this handbook which investigate these facets of diversity in detail, and the various ways in which we can cultivate an equitable and inclusive environment for our students.
UTSC Program-Wide Student Demographics
This section features demographic information from across the entire UTSC student population. The data featured in this section is sourced from the University of Toronto’s Quick Facts from 2023-2024.
Undergraduate Student Enrollment
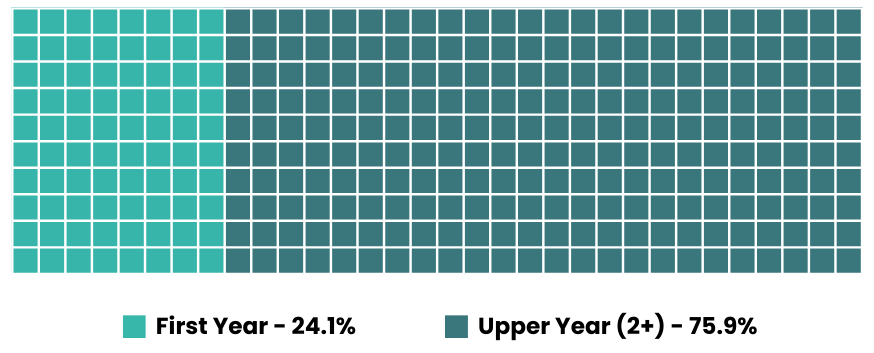
14,601 Total Students – 3,428 first-year undergraduate, 10,772 upper-year (2+) undergraduate, 401 graduate
International & Domestic Students
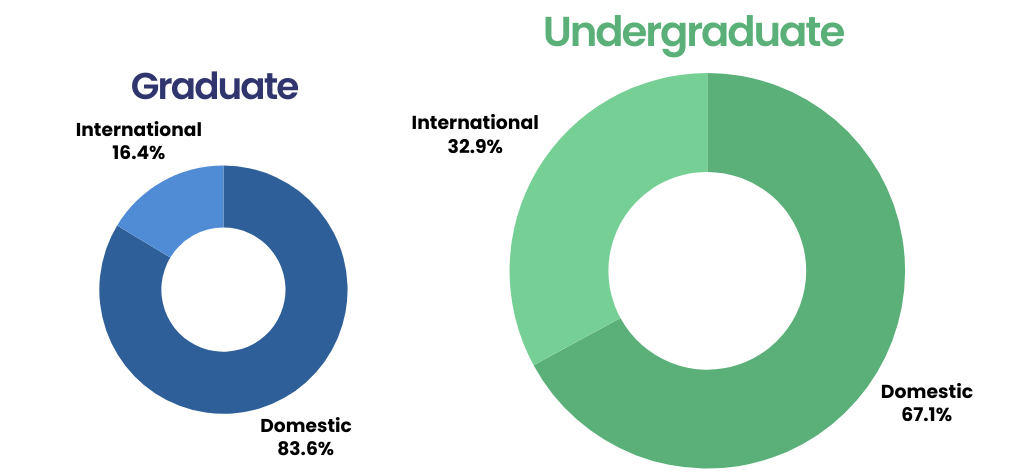
Graduate – 62 (16.4%) international, 317 (83.6%) domestic
Undergraduate – 4,595 (32.9%) international, 9,362 (67.1%) domestic
UTSC Psychology Department Demographics
This section features demographic information specific to the UTSC Psychology Department students.
Data Collected by the University
Student Enrollment
- Number of graduate students: 90 in the experimental and the clinical programs (as of 2024)
- Number of post-docs: <10 (as of 2024)
Gender
- UTSC undergraduate
- Female: 7,725 (55.3%)
- Male: 5,907 (42.3%)
- Another gender identity or unreported: 325 (2.3%)
- UTSC graduate
- Female: 231 (60.9%)
- Male: 144 (38.0%)
- Another gender identity or unreported: 4 (1.1%)
Demographic Data Collected by the Undergraduate EDI Climate Survey
The following information reflects the student demographic information collected from the UTSC Psychology Undergraduate EDI Climate Survey in Fall 2023 (N = 550). Options reflect survey wording. Question prompts are listed under each category.
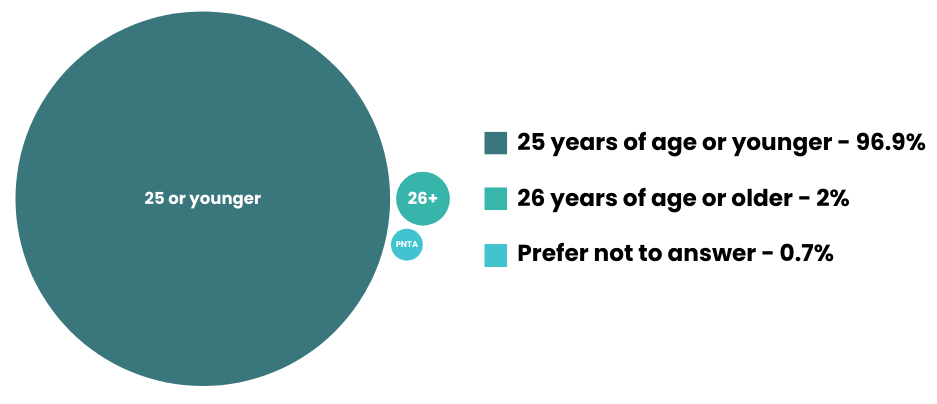
Age
To the extent that you feel comfortable doing so, please indicate which of the following best describes your age?
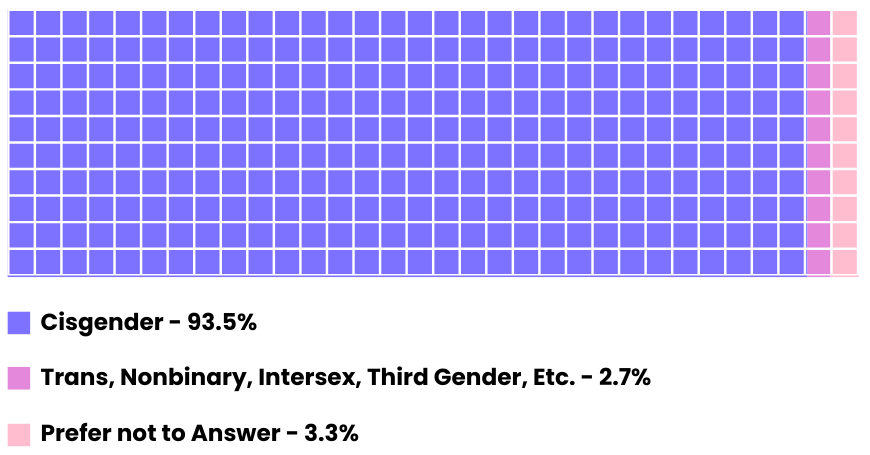
Sex-Gender Diversity
To the extent that you feel comfortable doing so, please indicate which of the following best describes your gender identity in relation to the sex to which you were assigned at birth.
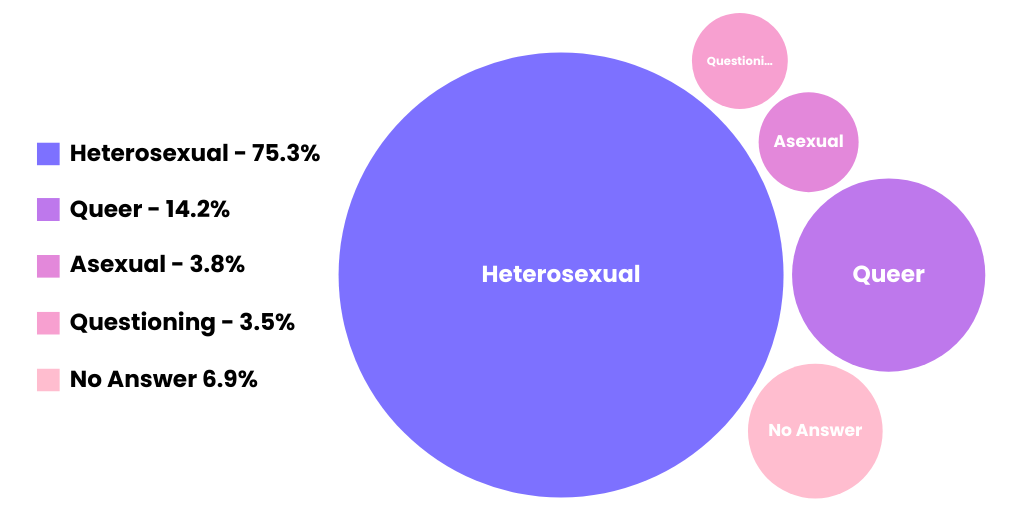
Sexual Identity & Orientation
To the extent that you feel comfortable doing so, please indicate which of the following terms best describes your sexual identity / sexual orientation. Check as many as apply.
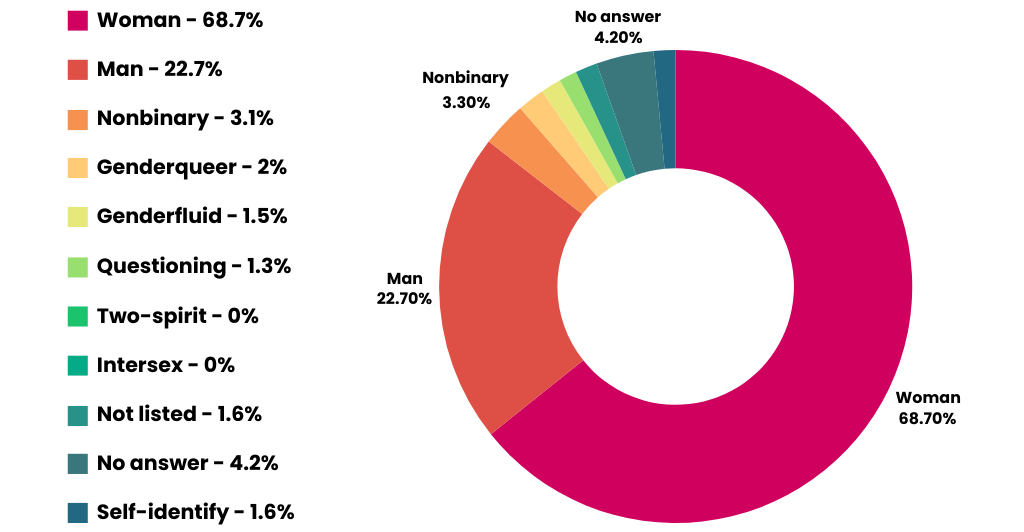
Gender Identity
To the extent that you feel comfortable doing so, please indicate which of the following terms best describes your gender identity. Check as many as apply.
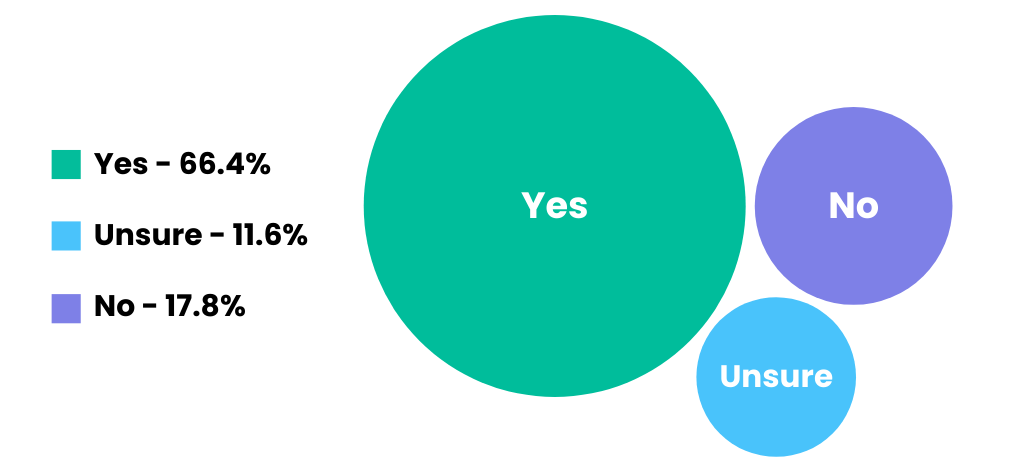
Racialized Identity
We are aware that many individuals in Canada who are not White or Caucasian no longer use the term “visible minorities”, and instead self-identify as “people of colour” or “racialized persons”. This terminology recognizes that, through the process of racialization, Western societies have created ideas of race as real, different and unequal, which impacts individuals’ economic, political and social lives. Do you identify as a racialized person/person of colour?
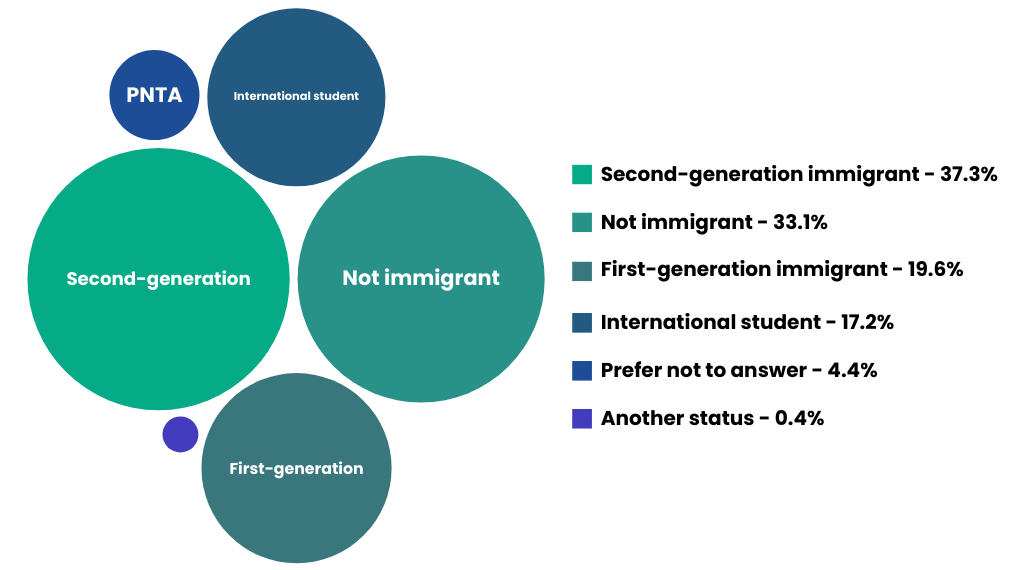
Immigration Status
To the extent that you feel comfortable doing so, please indicate which of the following describes your immigration status.
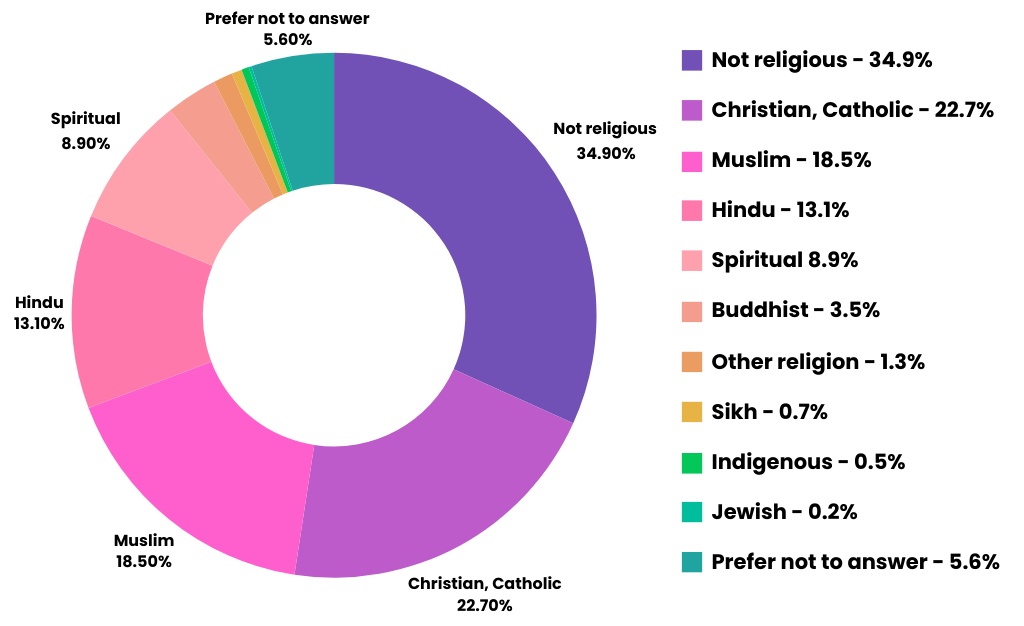
Religious Affiliation & Identity
To the extent that you feel comfortable doing so, please indicate which of the following best describes your religious affiliation and identity. Check all that apply.
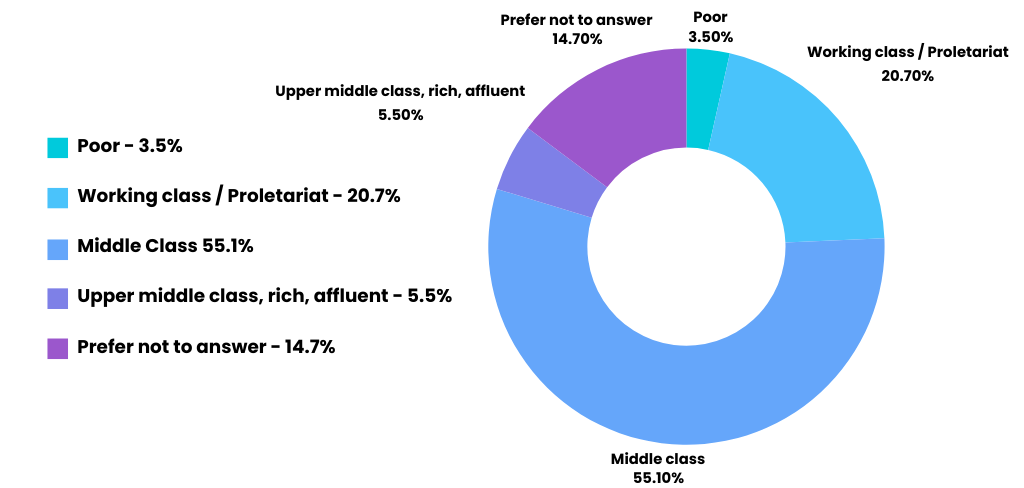
Socioeconomic Status (SES)
To which one of the following social class groups do you most strongly identify? (If your social class has changed over time, select the option that best describes your social class during formative periods of your identity development).
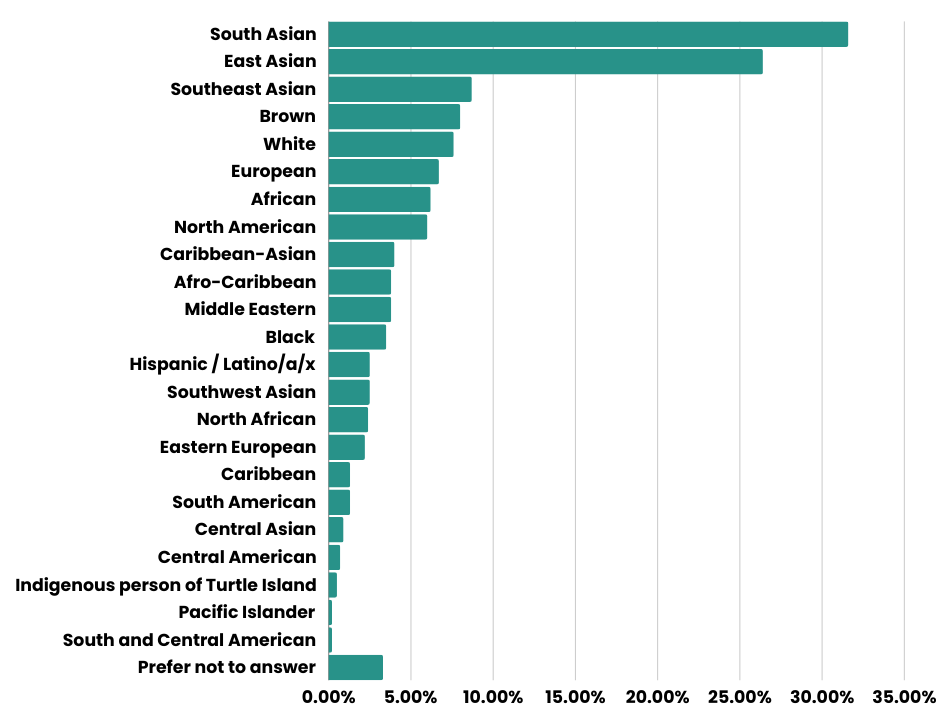
Race/Ethnicity/Cultural Background
To the extent that you feel comfortable doing so, please indicate which of the following best describes your racial / cultural / ethnic background. Check as many as apply.
Resources
This resource from the University provides updated information regarding demographic and enrollment information from across all UofT campuses.
Contributions
Roles follow the CRediT Taxonomy. Names are listed in alphabetical order.
Conceptualization, Writing – Original draft: Kosha Bramesfeld, Jessica Chan, Ilakkiah Chandran, Mehvish Islam, Farzana Jahan, Aliza Kazmi, Stephanie Li, Andre Wang
Investigation: Jessica Chan, Ilakkiah Chandran, Mehvish Islam, Farzana Jahan, Aliza Kazmi, Stephanie Li
Visualization: Amman Khurana
Supervision: Jessica Dere

Feedback/Errata