59 Additional Considerations
Learning Objectives
- Define Type I and Type II errors, explain why they occur, and identify some steps that can be taken to minimize their likelihood.
- Define statistical power, explain its role in the planning of new studies, and use online tools to compute the statistical power of simple research designs.
- List some criticisms of conventional null hypothesis testing, along with some ways of dealing with these criticisms.
In this section, we consider a few other issues related to null hypothesis testing, including some that are useful in planning studies and interpreting results. We even consider some long-standing criticisms of null hypothesis testing, along with some steps that researchers in psychology have taken to address them.
Errors in Null Hypothesis Testing
In null hypothesis testing, the researcher tries to draw a reasonable conclusion about the population based on the sample. Unfortunately, this conclusion is not guaranteed to be correct. This discrepancy is illustrated by Figure 13.3. The rows of this table represent the two possible decisions that researchers can make in null hypothesis testing: to reject or retain the null hypothesis. The columns represent the two possible states of the world: the null hypothesis is false or it is true. The four cells of the table, then, represent the four distinct outcomes of a null hypothesis test. Two of the outcomes—rejecting the null hypothesis when it is false and retaining it when it is true—are correct decisions. The other two—rejecting the null hypothesis when it is true and retaining it when it is false—are errors.
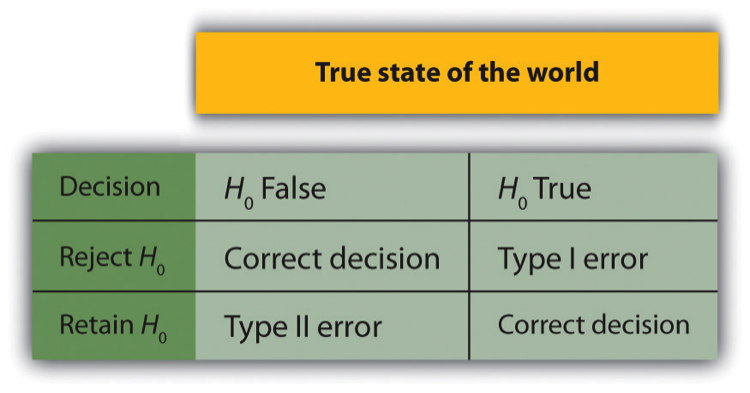
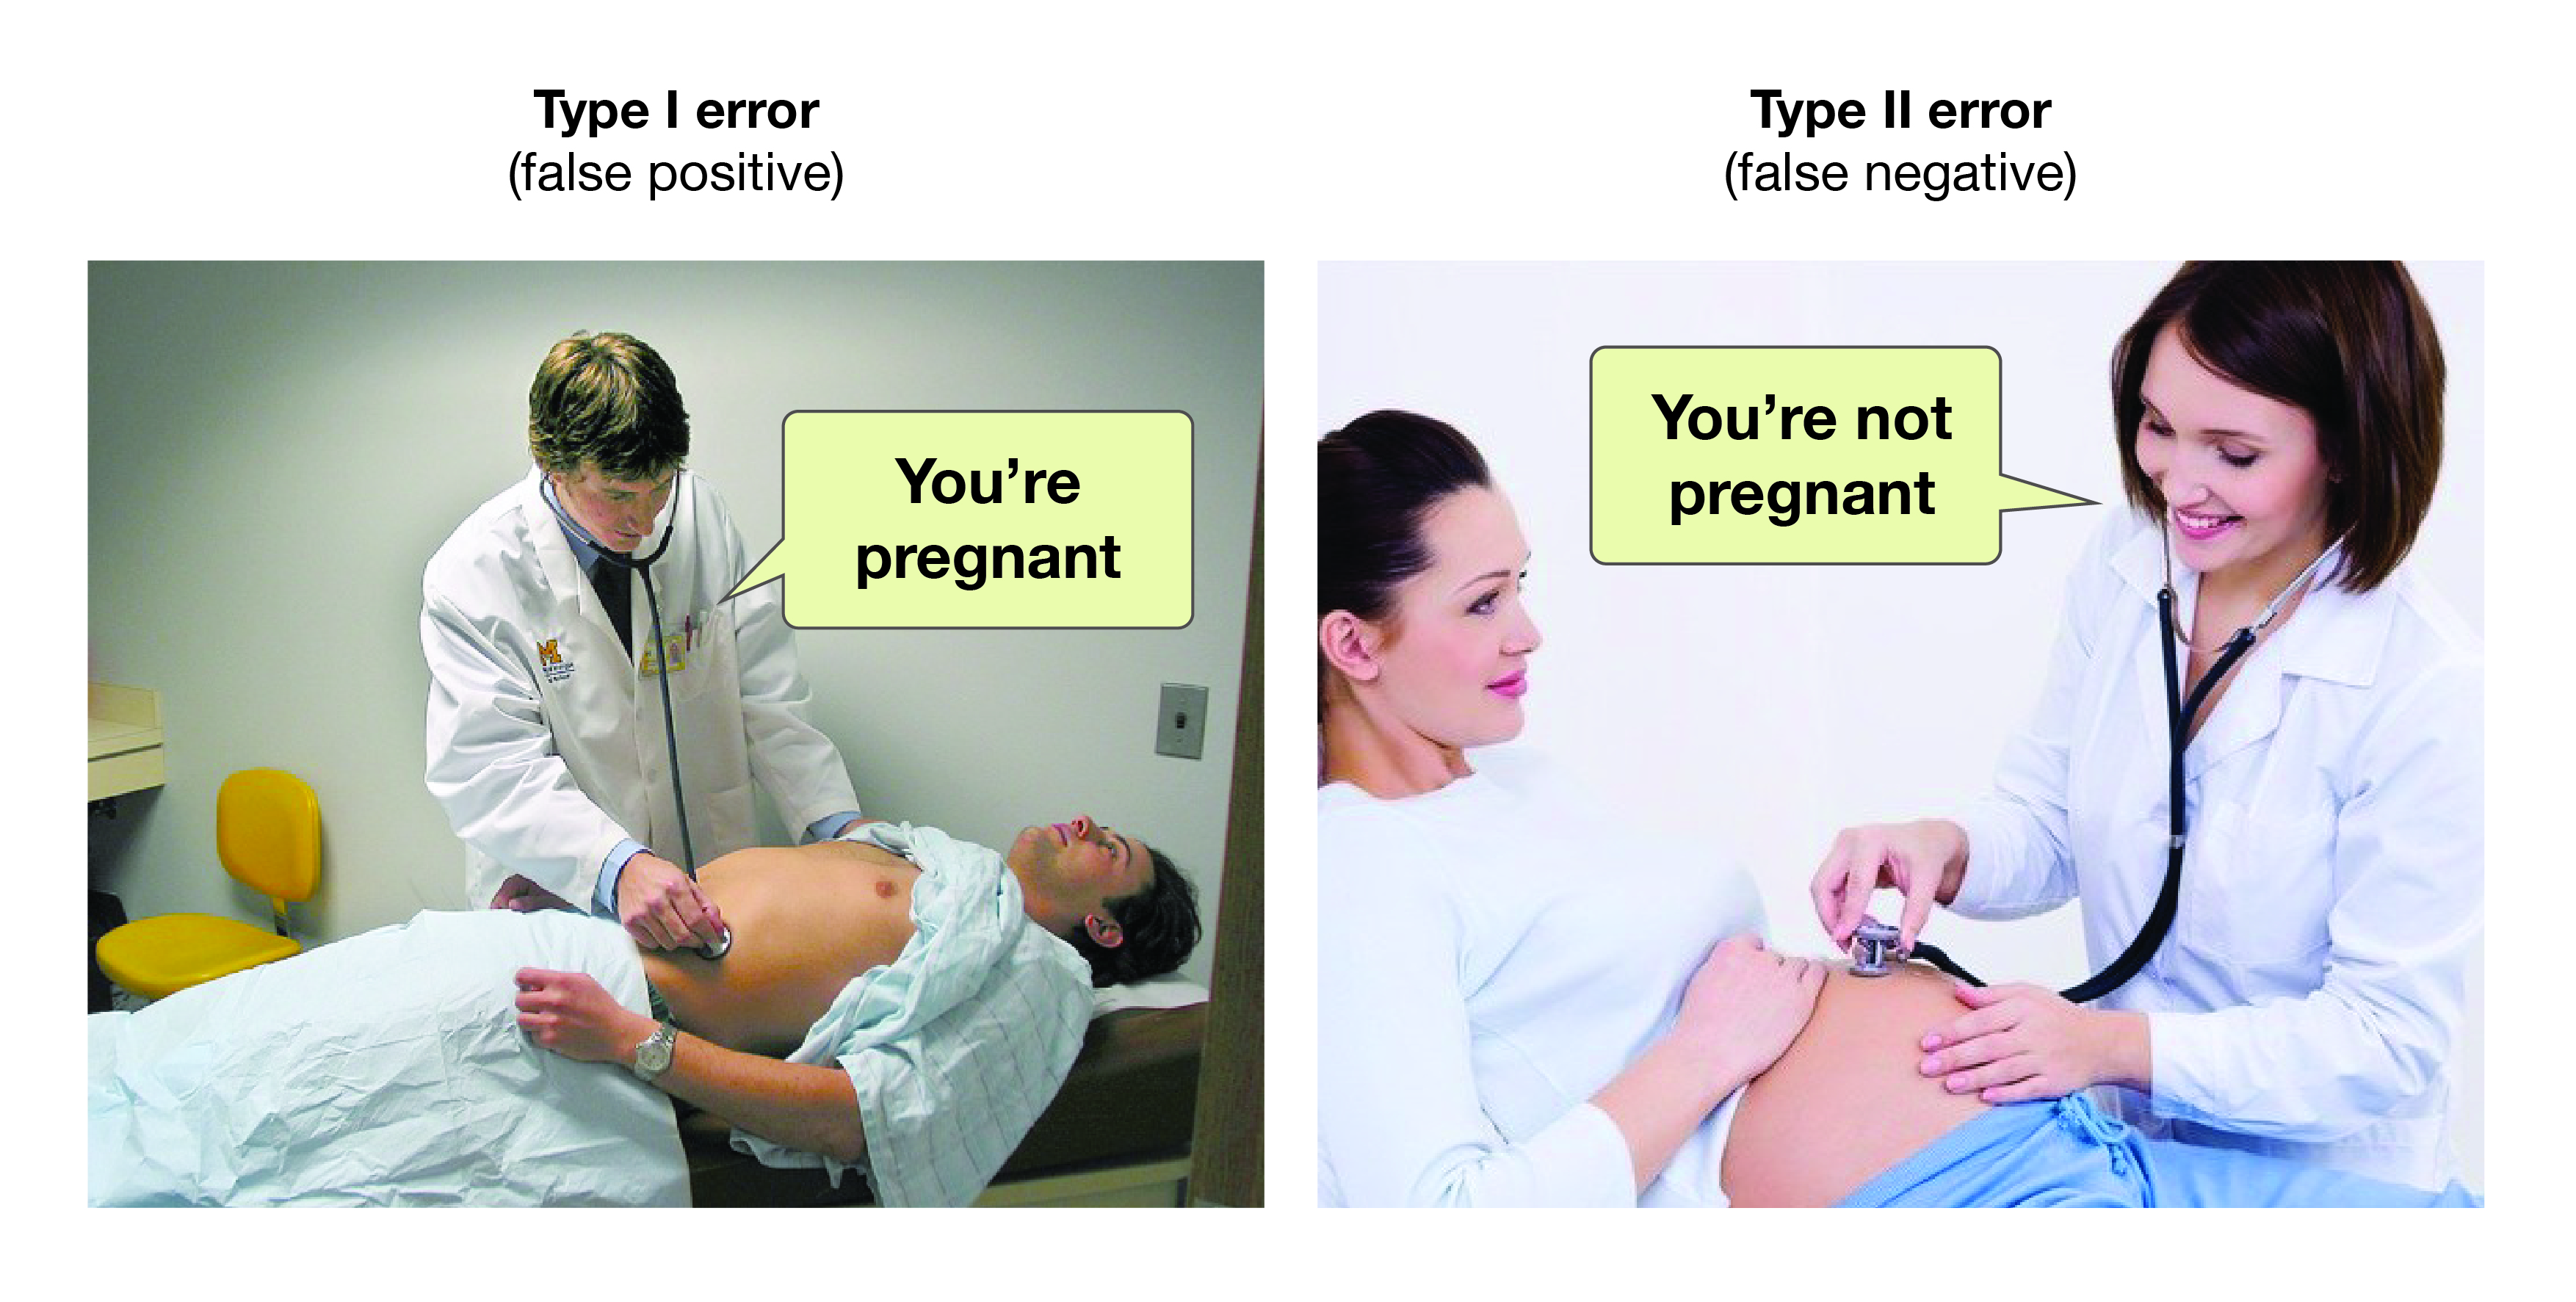
Rejecting the null hypothesis when it is true is called a Type I error. This error means that we have concluded that there is a relationship in the population when in fact there is not. Type I errors occur because even when there is no relationship in the population, sampling error alone will occasionally produce an extreme result. In fact, when the null hypothesis is true and α is .05, we will mistakenly reject the null hypothesis 5% of the time. (This possibility is why α is sometimes referred to as the “Type I error rate.”) Retaining the null hypothesis when it is false is called a Type II error. This error means that we have concluded that there is no relationship in the population when in fact there is a relationship. In practice, Type II errors occur primarily because the research design lacks adequate statistical power to detect the relationship (e.g., the sample is too small). We will have more to say about statistical power shortly.
In principle, it is possible to reduce the chance of a Type I error by setting α to something less than .05. Setting it to .01, for example, would mean that if the null hypothesis is true, then there is only a 1% chance of mistakenly rejecting it. But making it harder to reject true null hypotheses also makes it harder to reject false ones and therefore increases the chance of a Type II error. Similarly, it is possible to reduce the chance of a Type II error by setting α to something greater than .05 (e.g., .10). But making it easier to reject false null hypotheses also makes it easier to reject true ones and therefore increases the chance of a Type I error. This provides some insight into why the convention is to set α to .05. There is some agreement among researchers that the .05 level of α keeps the rates of both Type I and Type II errors at acceptable levels.
The possibility of committing Type I and Type II errors has several important implications for interpreting the results of our own and others’ research. One is that we should be cautious about interpreting the results of any individual study because there is a chance that it reflects a Type I or Type II error. This possibility is why researchers consider it important to replicate their studies. Each time researchers replicate a study and find a similar result, they rightly become more confident that the result represents a real phenomenon and not just a Type I or Type II error.
Another issue related to Type I errors is the so-called file drawer problem (Rosenthal, 1979)[1]. The idea is that when researchers obtain statistically significant results, they tend to submit them for publication, and journal editors and reviewers tend to accept them. But when researchers obtain non-significant results, they tend not to submit them for publication, or if they do submit them, journal editors and reviewers tend not to accept them. Researchers end up putting these non-significant results away in a file drawer (or nowadays, in a folder on their hard drive). One effect of this tendency is that the published literature probably contains a higher proportion of Type I errors than we might expect on the basis of statistical considerations alone. Even when there is a relationship between two variables in the population, the published research literature is likely to overstate the strength of that relationship. Imagine, for example, that the relationship between two variables in the population is positive but weak (e.g., ρ = +.10). If several researchers conduct studies on this relationship, then sampling error is likely to produce results ranging from weak negative relationships (e.g., r = −.10) to moderately strong positive ones (e.g., r = +.40). But because of the file drawer problem, it is likely that only those studies producing moderate to strong positive relationships are published. The result is that the effect reported in the published literature tends to be stronger than it really is in the population.
The file drawer problem is a difficult one because it is a product of the way scientific research has traditionally been conducted and published. One solution is registered reports, whereby journal editors and reviewers evaluate research submitted for publication without knowing the results of that research (see https://cos.io/rr/). The idea is that if the research question is judged to be interesting and the method judged to be sound, then a non-significant result should be just as important and worthy of publication as a significant one. Short of such a radical change in how research is evaluated for publication, researchers can still take pains to keep their non-significant results and share them as widely as possible (e.g., in publicly available repositories and at professional conferences). Many scientific disciplines now have journals devoted to publishing non-significant results. In psychology, for example, there is the Journal of Articles in Support of the Null Hypothesis (http://www.jasnh.com).
In 2014, Uri Simonsohn, Leif Nelson, and Joseph Simmons published an article (Simonsohn, Nelson, & Simmons, 2014)[2] accusing psychology researchers of creating too many Type I errors in psychology by engaging in research practices they called p-hacking. Researchers who p-hack make various decisions in the research process to increase their chance of a statistically significant result (and type I error) by arbitrarily removing outliers, selectively choosing to report dependent variables, only presenting significant results, etc. until their results yield a desirable p value. Their groundbreaking paper contributed to a major conversation in the field about publishing standards and improving the reliability of our results that continues today.
Statistical Power
The statistical power of a research design is the probability of rejecting the null hypothesis given the sample size and expected relationship strength. For example, the statistical power of a study with 50 participants and an expected Pearson’s r of +.30 in the population is .59. That is, there is a 59% chance of rejecting the null hypothesis if indeed the population correlation is +.30. Statistical power is the complement of the probability of committing a Type II error. So in this example, the probability of committing a Type II error would be 1 − .59 = .41. Clearly, researchers should be interested in the power of their research designs if they want to avoid making Type II errors. In particular, they should make sure their research design has adequate power before collecting data. A common guideline is that a power of .80 is adequate. This guideline means that there is an 80% chance of rejecting the null hypothesis for the expected relationship strength.
The topic of how to compute power for various research designs and null hypothesis tests is beyond the scope of this book. However, there are online tools that allow you to do this by entering your sample size, expected relationship strength, and α level for various hypothesis tests (see “Computing Power Online”). In addition, Table 13.6 shows the sample size needed to achieve a power of .80 for weak, medium, and strong relationships for a two-tailed independent-samples t-test and for a two-tailed test of Pearson’s r. Notice that this table amplifies the point made earlier about relationship strength, sample size, and statistical significance. In particular, weak relationships require very large samples to provide adequate statistical power.
| Null Hypothesis Test | ||
| Relationship Strength | Independent-Samples t-Test | Test of Pearson’s r |
| Strong (d = .80, r = .50) | 52 | 28 |
| Medium (d = .50, r = .30) | 128 | 84 |
| Weak (d = .20, r = .10) | 788 | 782 |
What should you do if you discover that your research design does not have adequate power? Imagine, for example, that you are conducting a between-subjects experiment with 20 participants in each of two conditions and that you expect a medium difference (d = .50) in the population. The statistical power of this design is only .34. That is, even if there is a medium difference in the population, there is only about a one in three chance of rejecting the null hypothesis and about a two in three chance of committing a Type II error. Given the time and effort involved in conducting the study, this probably seems like an unacceptably low chance of rejecting the null hypothesis and an unacceptably high chance of committing a Type II error.
Given that statistical power depends primarily on relationship strength and sample size, there are essentially two steps you can take to increase statistical power: increase the strength of the relationship or increase the sample size. Increasing the strength of the relationship can sometimes be accomplished by using a stronger manipulation or by more carefully controlling extraneous variables to reduce the amount of noise in the data (e.g., by using a within-subjects design rather than a between-subjects design). The usual strategy, however, is to increase the sample size. For any expected relationship strength, there will always be some sample large enough to achieve adequate power.
Computing Power Online
The following links are to tools that allow you to compute statistical power for various research designs and null hypothesis tests by entering information about the expected relationship strength, the sample size, and the α level. They also allow you to compute the sample size necessary to achieve your desired level of power (e.g., .80). The first is an online tool. The second is a free downloadable program called G*Power.
- Russ Lenth’s Power and Sample Size Page: http://www.stat.uiowa.edu/~rlenth/Power/index.html
- G*Power: http://www.gpower.hhu.de
Problems With Null Hypothesis Testing, and Some Solutions
Again, null hypothesis testing is the most common approach to inferential statistics in psychology. It is not without its critics, however. In fact, in recent years the criticisms have become so prominent that the American Psychological Association convened a task force to make recommendations about how to deal with them (Wilkinson & Task Force on Statistical Inference, 1999)[3]. In this section, we consider some of the criticisms and some of the recommendations.
Criticisms of Null Hypothesis Testing
Some criticisms of null hypothesis testing focus on researchers’ misunderstanding of it. We have already seen, for example, that the p value is widely misinterpreted as the probability that the null hypothesis is true. (Recall that it is really the probability of the sample result if the null hypothesis were true.) A closely related misinterpretation is that 1 − p equals the probability of replicating a statistically significant result. In one study, 60% of a sample of professional researchers thought that a p value of .01—for an independent-samples t-test with 20 participants in each sample—meant there was a 99% chance of replicating the statistically significant result (Oakes, 1986)[4]. Our earlier discussion of power should make it clear that this figure is far too optimistic. As Table 13.5 shows, even if there were a large difference between means in the population, it would require 26 participants per sample to achieve a power of .80. And the program G*Power shows that it would require 59 participants per sample to achieve a power of .99.
Another set of criticisms focuses on the logic of null hypothesis testing. To many, the strict convention of rejecting the null hypothesis when p is less than .05 and retaining it when p is greater than .05 makes little sense. This criticism does not have to do with the specific value of .05 but with the idea that there should be any rigid dividing line between results that are considered significant and results that are not. Imagine two studies on the same statistical relationship with similar sample sizes. One has a p value of .04 and the other a p value of .06. Although the two studies have produced essentially the same result, the former is likely to be considered interesting and worthy of publication and the latter simply not significant. This convention is likely to prevent good research from being published and to contribute to the file drawer problem.
Yet another set of criticisms focus on the idea that null hypothesis testing—even when understood and carried out correctly—is simply not very informative. Recall that the null hypothesis is that there is no relationship between variables in the population (e.g., Cohen’s d or Pearson’s r is precisely 0). So to reject the null hypothesis is simply to say that there is some nonzero relationship in the population. But this assertion is not really saying very much. Imagine if chemistry could tell us only that there is some relationship between the temperature of a gas and its volume—as opposed to providing a precise equation to describe that relationship. Some critics even argue that the relationship between two variables in the population is never precisely 0 if it is carried out to enough decimal places. In other words, the null hypothesis is never literally true. So rejecting it does not tell us anything we did not already know!
To be fair, many researchers have come to the defense of null hypothesis testing. One of them, Robert Abelson, has argued that when it is correctly understood and carried out, null hypothesis testing does serve an important purpose (Abelson, 1995)[5]. Especially when dealing with new phenomena, it gives researchers a principled way to convince others that their results should not be dismissed as mere chance occurrences.
The End of p-Values?
In 2015, the editors of Basic and Applied Social Psychology announced a ban on the use of null hypothesis testing and related statistical procedures (Tramimow & Marks, 2015)[6]. Authors are welcome to submit papers with p-values, but the editors will remove them before publication. Although they did not propose a better statistical test to replace null hypothesis testing, the editors emphasized the importance of descriptive statistics and effect sizes. Although not widely adopted, this rejection of the “gold standard” of statistical validity has continued the conversation in psychology, of questioning exactly what we know and how we know it.
What to Do?
Even those who defend null hypothesis testing recognize many of the problems with it. But what should be done? Some suggestions now appear in the APA Publication Manual. One is that each null hypothesis test should be accompanied by an effect size measure such as Cohen’s d or Pearson’s r. By doing so, the researcher provides an estimate of how strong the relationship in the population is—not just whether there is one or not. (Remember that the p value cannot substitute as a measure of relationship strength because it also depends on the sample size. Even a very weak result can be statistically significant if the sample is large enough.)
Another suggestion is to use confidence intervals rather than null hypothesis tests. A confidence interval around a statistic is a range of values that is computed in such a way that some percentage of the time (usually 95%) the population parameter will lie within that range. For example, a sample of 20 university students might have a mean calorie estimate for a chocolate chip cookie of 200 with a 95% confidence interval of 160 to 240. In other words, there is a very good (95%) chance that the mean calorie estimate for the population of university students lies between 160 and 240. Advocates of confidence intervals argue that they are much easier to interpret than null hypothesis tests. Another advantage of confidence intervals is that they provide the information necessary to do null hypothesis tests should anyone want to. In this example, the sample mean of 200 is significantly different at the .05 level from any hypothetical population mean that lies outside the confidence interval. So the confidence interval of 160 to 240 tells us that the sample mean is statistically significantly different from a hypothetical population mean of 250 (because the confidence interval does not include the value of 250).
Finally, there are more radical solutions to the problems of null hypothesis testing that involve using very different approaches to inferential statistics. Bayesian statistics, for example, is an approach in which the researcher specifies the probability that the null hypothesis and any important alternative hypotheses are true before conducting the study, conducts the study, and then updates the probabilities based on the data. It is too early to say whether this approach will become common in psychological research. For now, null hypothesis testing—supported by effect size measures and confidence intervals—remains the dominant approach.
- Rosenthal, R. (1979). The file drawer problem and tolerance for null results. Psychological Bulletin, 83, 638–641. ↵
- Simonsohn U., Nelson L. D., & Simmons J. P. (2014). P-Curve: a key to the file drawer. Journal of Experimental Psychology: General, 143(2), 534–547. doi: 10.1037/a0033242 ↵
- Wilkinson, L., & Task Force on Statistical Inference. (1999). Statistical methods in psychology journals: Guidelines and explanations. American Psychologist, 54, 594–604. ↵
- Oakes, M. (1986). Statistical inference: A commentary for the social and behavioral sciences. Chichester, UK: Wiley. ↵
- Abelson, R. P. (1995). Statistics as principled argument. Mahwah, NJ: Erlbaum. ↵
- Tramimow, D. & Marks, M. (2015). Editorial. Basic and Applied Social Psychology, 37, 1–2. https://dx.doi.org/10.1080/01973533.2015.1012991 ↵
Research methods is my favorite course to teach. It is somewhat less popular with students, but I’m working on that issue. Part of the excitement of teaching this class comes from the uniquely open framework—students get to design a research study about a topic that interests them. By reading my students’ papers every semester, I learn about a wide range of topics relevant to social work that I otherwise would not have known about. But what topic should you choose?
Chapter outline
- 2.1 Getting started
- 2.2 Sources of information
- 2.3 Finding literature
Content advisory
This chapter discusses or mentions the following topics: racism and hate groups, police violence, substance abuse, and mental health.
Learning Objectives
- Begin to write your literature review
- Identify the purpose of a problem statement
- Apply the components of a formal argument to your topic
- Use elements of formal writing style, including signposting and transitions
Congratulations! By now, you should have discovered, retrieved, evaluated, synthesized, and organized the information you need for your literature review. It’s now time to turn that stack of articles, papers, and notes into a literature review--it’s time to start writing!

If you’ve followed the steps in this chapter, you likely have developed an outline that will guide you through the writing process. If you are still unsure of what to include in the literature review, here is a summary. A literature review should:
…clearly describe the questions that are being asked. They also locate the research within the ongoing scholarly dialogue. This is done by summarizing current understandings and by discussing why what we already knows leads to the need for the present research. Literature reviews also define the primary concepts. While this information can appear in any order, these are the elements in all literature reviews. (Loseke, 2017, p. 61) [1]
Do you have enough facts and sources to accomplish these tasks? It’s a good time to consult your outline and notes on each article you plan to include in your literature review. You may also want to consult with your professor on what they expect from you. If there is something that you are missing, you may want to jump back to section 2.3 where we discussed how to search for literature on your topic. While you can always fill in material later, you may run the risk of writing about a topic that you do not fully understand yet. For example, if you don’t have a solid definition of your key concepts or a sense of how the literature has developed over time, it will be difficult to make coherent scholarly claims about your topic.
There is no magical point at which everyone is ready to write. As you consider whether you are ready or not, it may be useful to ask yourself these questions:
- How will my literature review be organized?
- What section headings will I be using?
- How do the various studies relate to each other?
- What contributions do they make to the field?
- What are the limitations of a study/where are the gaps in the research?
- Most importantly, how does my own research fit into what has already been done?
The problem statement
Many scholarly works begin with a problem statement. The problem statement serves two functions: 1) it establishes the importance of your topic as a social problem and 2) it catches the reader's attention and piques their interest. Who would want to read about something unimportant?

A problem statement generally answers the following questions, though these are far from exhaustive:
- Why is this an important problem to study?
- How many people are affected by the problem?
- How does this problem impact other social issues or target populations relevant to social work?
- Why is your target population an important one to study?
Like the rest of your literature review, a strong problem statement should be filled with facts, theories, and arguments based on the literature you’ve found.
Research proposals are significantly different than other essays you've likely completed during your social work studies. If your topic were domestic violence in rural Appalachia in the USA, I’m sure you could come up with answers to the above questions without looking at a single source. However, the purpose of the literature review is not to test your intuition, personal experience, or empathy. Instead, research methods are about learning specific and articulable facts to inform social work action. With a problem statement, you can take a “boring” topic like transportation patterns in major cities and readers to see the topic as an important part of the social world that impacts social work practice.
The structure of a literature review
Problem statement
The problem statement generally belongs at the beginning of the literature review. I recommend limiting the length of the problem statement to one or two paragraphs, as you do not want it to be too lengthy. For the rest of your literature review, there is no set formula for how it should be organized. However, a literature review generally follows the format of any other essay—Introduction, Body, and Conclusion.
Introduction
The introduction to the literature review contains a statement or statements about the overall topic. At minimum, the introduction should define or identify the general topic, issue, or area of concern. You might consider presenting historical background, mentioning the results of a seminal study, or providing definitions of important terms. The introduction may also point to overall trends in what has been previously published on the topic; conflicts in theory, methodology, evidence, and conclusions; or gaps in research and scholarship. In addition, I suggest adding a few sentences that walk the reader through the rest of the literature review by highlighting your main arguments from the body and by previewing your conclusion.

Body
The body of your literature review is where you demonstrate your synthesis and analysis of the literature on your topic, so be sure that you are doing more than just summarizing the facts you've found. I would also caution against organizing your literature review by source—that is, one paragraph for source A, one paragraph for source B, etc. That structure will provide a mediocre summary of the information but will not provide the synthesis that we are aiming for in this section. It also fails to demonstrate the relationships among facts, potential disagreements among research findings, and how each study builds on the work of another. In short, summarization does not demonstrate critical thinking.
Instead of simply summarizing, use your outlines and notes as a guide to the important topics you will to cover, and more importantly, what you have to say about those topics. Literature reviews are written from the perspective of an expert in the field. After an exhaustive literature review, you should feel like you are able to make strong claims about what is true—so make them! There is no need to hide behind “I believe” or “I think.” Put your voice out in front, loud and proud, but make sure you have facts and sources to support your argument.
I’ve used the term “argument” here in a specific way. An argument in writing means more than simply disagreeing with what someone else said. Toulman, Rieke, and Janik (1984) identify six elements of an argument:
- Claim: the thesis statement—what you are trying to prove
- Grounds: theoretical or empirical evidence that supports your claim
- Warrant: your reasoning (rule or principle) connecting the claim and its grounds
- Backing: further facts used to support or legitimize the warrant
- Qualifier: acknowledging that the argument may not be true for all cases
- Rebuttal: considering both sides (as cited in Burnette, 2012) [2]
Let’s walk through an example of an argument. Let's say that I am writing a literature review on a negative income tax, a policy in which people in poverty receive an unconditional cash stipend from the government each month equal to the federal poverty level. I would want to lay out the following:
- Claim: the negative income tax is superior to other forms of anti-poverty assistance.
- Grounds: data comparing negative income tax recipients to those in existing programs, theory supporting a negative income tax, data from evaluations of existing anti-poverty programs, etc.
- Warrant: cash-based programs like the negative income tax are superior to existing anti-poverty programs because they allow the recipient greater self-determination over how to spend their money.
- Backing: data demonstrating the beneficial effects of self-determination on people in poverty.
- Qualifier: the negative income tax does not provide taxpayers and voters with enough control to make sure people in poverty are not wasting financial assistance on frivolous items.
- Rebuttal: policy should be about empowering the oppressed, not protecting the taxpayer, and there are ways of addressing taxpayer opposition through policy design.
Like any effective argument, your literature review must have some kind of structure. For example, it might begin by describing a phenomenon in a general way along with several studies that provide some detail, then describing two or more competing theories of the phenomenon, and finally presenting a hypothesis to test one or more of the theories. Or, it might describe one phenomenon, then describe another phenomenon that seems inconsistent with the first one, then propose a theory that resolves the inconsistency, and finally present a hypothesis to test that theory. In applied research, it might describe a phenomenon or theory, then describe how that phenomenon or theory applies to some important real-world situation, and finally suggest a way to test whether it does, in fact, apply to that situation.
Another important issue is signposting. It may not be a term you are familiar with, but you are likely familiar with the concept. Signposting refers to the words used to identify the organization and structure of your literature review to your reader. The most basic form of signposting is using a topic sentence at the beginning of each paragraph. A topic sentence introduces the argument you plan to make in that paragraph. For example, you might start a paragraph stating, “There is strong disagreement in the literature as to whether the use of psychedelic drugs causes the experience of psychotic disorders, or whether the experience of a psychotic disorder causes the use of psychedelic drugs.” Within that paragraph, your reader would likely assume you will present evidence for both arguments. The concluding sentence of your paragraph should relate to the topic sentence by addressing how the facts and arguments from other authors support a specific conclusion. To continue with our example, I might say, “There is likely a reciprocal effect in which both the use of psychedelic drugs worsens pre-psychotic symptoms and worsening psychosis causes use of psychedelic drugs to self-medicate or escape.”

Signposting also involves using headings and subheadings. Your literature review will use APA formatting, which means you need to follow their rules for bolding, capitalization, italicization, and indentation of headings. Headings help your reader understand the structure of your literature review. They can also help if the reader gets lost and needs to re-orient themselves within the document. I often tell my students to assume that I know nothing and that I need to be shown exactly where they are addressing each part of the literature review. I am sure that they don't mind pretending to walk me through their paper like you would a small child, explaining “first we’ll do this, then we’ll do that, and when we’re done, we’ll know this!”
Another way to use signposting is to open each paragraph with a sentence that links the topic of the paragraph with the one before it. Alternatively, one could end each paragraph with a sentence that links it with the next paragraph. For example, imagine we wanted to link a paragraph about barriers to accessing healthcare with one about the relationship between the patient and physician. We could use a transition sentence like this: “Even if patients overcome these barriers to accessing care, the physician-patient relationship can create new barriers to positive health outcomes.” A transition sentence like this builds a connection between two distinct topics. Transition sentences are also useful within paragraphs. They tell the reader how to consider one piece of information in light of previous information. Even simple transitions like however, similarly, and others demonstrate critical thinking and make your arguments clearer.
Many beginning researchers have difficulty with incorporating transitions into their writing. Let’s look at an example. Instead of beginning a sentence or paragraph by launching into a description of a study, such as “Williams (2004) found that…,” it is better to start by indicating something about why you are describing this particular study. Here are some simple examples:
- Another example of this phenomenon comes from the work of Williams (2004).
- Williams (2004) offers one explanation of this phenomenon.
- An alternative perspective has been provided by Williams (2004).
Now that we know to use signposts, the natural question is “What goes on the signposts?” First, it is extremely important to start with an outline of the main points that you want to make, organized in the order that you want to make them. The basic structure of your argument then should be apparent from the outline itself. Unfortunately, there is no formula I can give you that will work for everyone. I can provide some general pointers on structuring your literature review, though.
The literature review generally moves from general ideas to more specific ones. You can build a review by identifying areas of consensus and areas of disagreement. You may choose to present earlier, historical studies—preferably seminal studies that are of significant importance—and close with most recent work. Another approach is to start with the most distantly related facts and literature and then report on those most closely related to your specific research question. You could also compare and contrast valid approaches, features, characteristics, theories – that is, one approach, then a second approach, followed by a third approach.
Here are some additional tips for writing the body of your literature review:
- Start broad and then narrow down to more specific information.
- When appropriate, cite two or more sources for a single point, but avoid long strings of references for a single point.
- Use quotes sparingly. Quotations for definitions are okay, but reserve quotes for when an author says something so well that you couldn’t possibly phrase it differently. Never use quotes for statistics.
- Paraphrase when you need to relate the specific details within an article, and try to reword it in a way that is understandable to your audience.
- Include only the aspects of the study that are relevant to your literature review. Don’t insert extra facts about a study just to take up space.
- Avoid using first-person language like “I” and “we” to maintain objectivity.
- Avoid using informal language like contractions, idioms, and rhetorical questions.
- Note any sections of your review that lack citations and facts from literature. Your arguments need to be based in specific empirical or theoretical facts. Do not approach this like a reflective journal entry.
- Point out consistent findings and emphasize stronger studies over weaker ones.
- Point out important strengths and weaknesses of research studies, as well as contradictions and inconsistent findings.
- Be specific when pointing out implications and suggestions for further research.
Conclusion
The conclusion should summarize your literature review, discuss implications, and create a space for future or further research needed in this area. Your conclusion, like the rest of your literature review, should have a point that you are trying to make. What are the important implications of your literature review? How do they inform the question you are trying to answer?
Structure overview
While you should consult with your professor and their syllabus for the final structure your literature review should take, here is an example:
- Problem statement
- Establish the importance of the topic
- Number and type of people affected
- Seriousness of the impact
- Physical, psychological, economic, social consequences of the problem
- Introduction
- Definitions of key terms
- Important arguments you will make
- Overview of the organization of the rest of the review
- Body of the review
- Topic 1
- Supporting evidence
- Topic 2
- Supporting evidence
- Topic 3
- Supporting evidence
- Conclusion
- Implications
- Specific suggestions for future research
- How your research topic adds to the literature
- Topic 1
Here are some additional resources, if you are having trouble putting together your literature review:
Doing a literature review / University of Leicester
Get Lit: The Literature Review / Texas A&M Writing Centre
Editing your literature review
For your literature review, remember that your goal is to construct an argument for why your research question is interesting and worth addressing—not argue why your favorite answer to your research question is correct. As you start editing your literature review, make sure that it is balanced. If you want to emphasize the generally accepted understanding of a phenomenon, then of course you should discuss various studies that have demonstrated it. However, if there are other studies that have found contradictory findings, you should discuss them, too. If you are proposing a new theory, then you should discuss findings that are consistent with that theory. However, if there are other findings that are inconsistent with it, again, you should discuss them too. It is acceptable to argue that the balance of the research supports the existence of a phenomenon or is consistent with a theory, but it is never acceptable to ignore contradictory evidence. Besides, a large part of what makes a research question interesting is the uncertainty about its answer (University of Minnesota, 2016). [3]

In addition to subjectivity and bias, another obstruction to getting your literature review written is writer’s block. Often times, writer’s block can come from confusing the creating and editing parts of the writing process. Many writers often start by simply trying to type out what they want to say, regardless of how good it is. Author Anne Lamott (1995) [4] terms these “shitty first drafts” and we all write them. They are a natural and important part of the writing process. Even if you have a detailed outline to work from, the words are not going to fall into place perfectly the first time you start writing. You should consider turning off the editing and critiquing part of your brain for a little while and allow your thoughts to flow. Don’t worry about putting the correct internal citation when you first write. Just get the information out. Only after you’ve reached a natural stopping point might you go back and edit your draft for grammar, APA formatting, organization, flow, and more. Divorcing the writing and editing process can go a long way to addressing writer’s block—as can picking a topic about which you have something to say!
As you are editing, keep in mind these questions adapted from Green (2012): [5]
- Content: Have I clearly stated the main idea or purpose of the paper and addressed all the issues? Is the thesis or focus clearly presented and appropriate for the reader?
- Organization: How well is it structured? Is the organization spelled out for the reader and easy to follow?
- Flow: Is there a logical flow from section to section, paragraph to paragraph, sentence to sentence? Are there transitions between and within paragraphs that link ideas together?
- Development: Have I validated the main idea with supporting material? Are supporting data sufficient? Does the conclusion match the introduction?
- Form: Are there any issues regarding APA styling and formatting? Have you proof-read for redundancy, spelling, punctuation, and grammar? Are there any problems with the wording of your writing or the sentence structure? Have you used terminology properly and checked the definitions of any words you may not be sure of?
Key Takeaways
- The problem statement draws the reader into your topic by highlighting how important the topic is to social work and overall society.
- Signposting is an important component of academic writing that helps your reader follow the structure of your argument and literature review.
- Transitions demonstrate critical thinking and help guide your reader through your arguments.
- Editing and writing are separate processes.
Glossary
Signposting- words that identify the organization and structure of a literature review
Image attributions
Startup notebooks by StartupStockPhotos CC-0
Board front problem by geralt CC-0
Person holding white paper and typewriter by Pexels CC-0
Signs direction Bergen by Mariamichelle CC-0
Learning Objectives
- Describe a micro-, meso-, and macro-level approaches to research
- Provide examples of micro-, meso-, and macro-level studies
In Chapter 1, we reviewed the micro, meso, and macro framework that social workers use to understand the world. As you’ll recall, micro-level research studies individuals and one-on-one interactions, meso-level research studies groups, and macro-level research studies institutions and policies. Let’s take a closer look at some specific examples of social work research to better understand each of the three levels of inquiry described previously. Some topics are best suited to be examined at one specific level, while other topics can be studied at each of the three different levels. The particular level of inquiry might shape a social worker’s questions about the topic, or a social scientist might view the topic from different angles depending on the level of inquiry being employed.
First, let’s consider some examples of different topics that are best suited to a particular level of inquiry. Work by Stephen Marks offers an excellent example of research at the micro-level. In one study, Marks and Shelley MacDermid (1996) [6] draw from prior micro-level theories to empirically study how people balance their roles and identities. In this study, the researchers found that people who experience balance across their multiple roles and activities report lower levels of depression and higher levels of self-esteem and well-being than their less-balanced counterparts. In another study, Marks and colleagues examined the conditions under which husbands and wives feel the most balance across their many roles. They found that different factors are important for different genders. For women, having more paid work hours and more couple time were among the most important factors. For men, having leisure time with their nuclear families was important, and role balance decreased as work hours increased (Marks, Huston, Johnson, & MacDermid, 2001). [7] Both of these studies fall within the category of micro-level analysis.
At the meso-level, social scientists tend to study the experiences of groups and the interactions between groups. In a recent book based on their research with Somali immigrants, Kim Huisman and colleagues (Huisman, Hough, Langellier, & Toner, 2011) [8] examine the interactions between Somalis and Americans in Maine. These researchers found that stereotypes about refugees being unable or unwilling to assimilate and being overly dependent on local social systems are unsubstantiated. In a much different study of group-level interactions, Michael Messner (2009) [9] conducted research on children’s sports leagues. Messner studied interactions among parent volunteers, among youth participants, and between league organizers and parents. They found that gender boundaries and hierarchies are perpetuated by the adults who run such leagues. While these two studies are very different in their specific points of focus, they both have a meso-level focus.
Social workers who conduct macro-level research study interactions at the broadest level, such as interactions between and across nations, states, or cultural systems. One example of macro-level research can be seen in a recent article by David Frank and colleagues (Frank, Camp, & Boutcher, 2010). [10] These researchers examined worldwide changes over time in laws regulating sex. By comparing laws across a number of countries over a period of many years (1945–2005), Frank learned that laws regulating rape, adultery, sodomy, and child sexual abuse shifted in focus from protecting larger entities, such as families, to protecting individuals. In another macro-level study, Leah Ruppanner (2010) [11] studied how national levels of gender equality in 25 different countries affect couples’ divisions of housework. Ruppanner found that as women’s parliamentary representation increases, so does men’s participation in housework.
While it is true that some topics lend themselves to a particular level of inquiry, there are many topics that could be studied from any of the three levels. The choice depends on the specific interest of the researcher, the approach they would like to take and the sorts of questions they want to be able to answer about the topic.
Let’s look at an example. Gang activity has been a topic of interest to social workers for many years and has been studied from each of the levels of inquiry described here. At the micro-level, social workers might study the inner workings of a specific gang, communication styles, and what everyday life is like for gang members. Though not written by a social worker, one example of a micro-level analysis of gang activity can be found in Sanyika Shakur’s 1993 autobiography, Monster. [12] In his book, Shakur describes his former day-to-day life as a member of the Crips in South-Central Los Angeles. Shakur’s recounting of his experiences highlights micro-level interactions between himself, fellow Crips members, and other gangs.
At the meso-level, social workers are likely to examine interactions between gangs or perhaps how different branches of the same gang vary from one area to the next. At the macro-level, we could compare the impact of gang activity across communities or examine the national economic impact of gang activity. Excellent examples of gang research at all three levels of analysis can be found in the Journal of Gang Research published by the National Gang Crime Research Center (NGCRC). [13] Sudhir Venkatesh’s (2008) study, Gang Leader for a Day, [14] is an example of research on gangs that utilizes all three levels of analysis. Venkatesh conducted participant observation with a gang in Chicago. He learned about the everyday lives of gang members (micro) and how the gang he studied interacted with and fit within the landscape of other gang “franchises” (meso). In addition, Venkatesh described the impact of the gang on the broader community and economy (macro).
Key Takeaways
- Social work research can occur at any of the following three analytical levels: micro, meso, or macro.
- Some topics lend themselves to one particular analytical level, while others could be studied from any, or all, of the three levels of analysis.
Learning Objectives
- Define reliability, including the different types and how they are assessed.
- Define validity, including the different types and how they are assessed.
- Describe the kinds of evidence that would be relevant to assessing the reliability and validity of a particular measure.
Again, measurement involves assigning scores to individuals so that they represent some characteristic of the individuals. But how do researchers know that the scores actually represent the characteristic, especially when it is a construct like intelligence, self-esteem, depression, or working memory capacity? The answer is that they conduct research using the measure to confirm that the scores make sense based on their understanding of the construct being measured. This is an extremely important point. Psychologists do not simply assume that their measures work. Instead, they collect data to demonstrate that they work. If their research does not demonstrate that a measure works, they stop using it.
As an informal example, imagine that you have been dieting for a month. Your clothes seem to be fitting more loosely, and several friends have asked if you have lost weight. If at this point your bathroom scale indicated that you had lost 10 pounds, this would make sense and you would continue to use the scale. But if it indicated that you had gained 10 pounds, you would rightly conclude that it was broken and either fix it or get rid of it. In evaluating a measurement method, psychologists consider two general dimensions: reliability and validity.
Reliability
Reliability refers to the consistency of a measure. Psychologists consider three types of consistency: over time (test-retest reliability), across items (internal consistency), and across different researchers (inter-rater reliability).
Test-Retest Reliability
When researchers measure a construct that they assume to be consistent across time, then the scores they obtain should also be consistent across time. Test-retest reliability is the extent to which this is actually the case. For example, intelligence is generally thought to be consistent across time. A person who is highly intelligent today will be highly intelligent next week. This means that any good measure of intelligence should produce roughly the same scores for this individual next week as it does today. Clearly, a measure that produces highly inconsistent scores over time cannot be a very good measure of a construct that is supposed to be consistent.
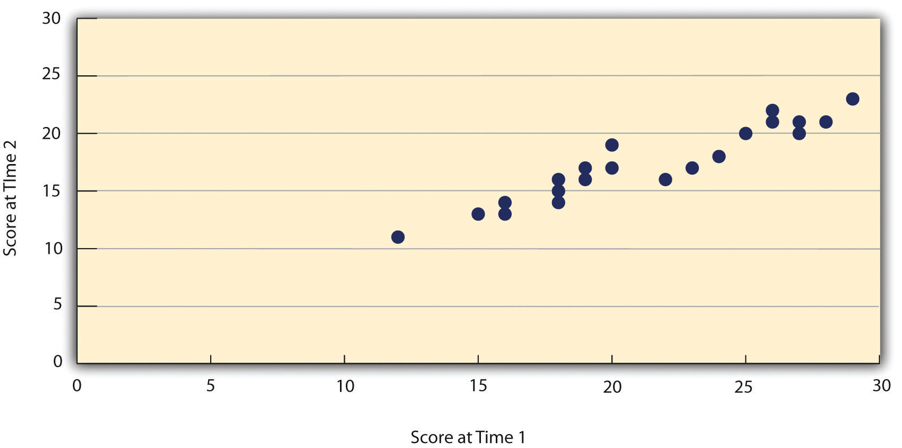
Assessing test-retest reliability requires using the measure on a group of people at one time, using it again on the same group of people at a later time, and then looking at the test-retest correlation between the two sets of scores. This is typically done by graphing the data in a scatterplot and computing the correlation coefficient. Figure 4.2 shows the correlation between two sets of scores of several university students on the Rosenberg Self-Esteem Scale, administered two times, a week apart. The correlation coefficient for these data is +.95. In general, a test-retest correlation of +.80 or greater is considered to indicate good reliability.
Again, high test-retest correlations make sense when the construct being measured is assumed to be consistent over time, which is the case for intelligence, self-esteem, and the Big Five personality dimensions. But other constructs are not assumed to be stable over time. The very nature of mood, for example, is that it changes. So a measure of mood that produced a low test-retest correlation over a period of a month would not be a cause for concern.
Internal Consistency
Another kind of reliability is internal consistency, which is the consistency of people’s responses across the items on a multiple-item measure. In general, all the items on such measures are supposed to reflect the same underlying construct, so people’s scores on those items should be correlated with each other. On the Rosenberg Self-Esteem Scale, people who agree that they are a person of worth should tend to agree that they have a number of good qualities. If people’s responses to the different items are not correlated with each other, then it would no longer make sense to claim that they are all measuring the same underlying construct. This is as true for behavioral and physiological measures as for self-report measures. For example, people might make a series of bets in a simulated game of roulette as a measure of their level of risk seeking. This measure would be internally consistent to the extent that individual participants’ bets were consistently high or low across trials.
Like test-retest reliability, internal consistency can only be assessed by collecting and analyzing data. One approach is to look at a split-half correlation. This involves splitting the items into two sets, such as the first and second halves of the items or the even- and odd-numbered items. Then a score is computed for each set of items, and the relationship between the two sets of scores is examined. For example, Figure 4.3 shows the split-half correlation between several university students’ scores on the even-numbered items and their scores on the odd-numbered items of the Rosenberg Self-Esteem Scale. The correlation coefficient for these data is +.88. A split-half correlation of +.80 or greater is generally considered good internal consistency.

Perhaps the most common measure of internal consistency used by researchers in psychology is a statistic called Cronbach’s α (the Greek letter alpha). Conceptually, α is the mean of all possible split-half correlations for a set of items. For example, there are 252 ways to split a set of 10 items into two sets of five. Cronbach’s α would be the mean of the 252 split-half correlations. Note that this is not how α is actually computed, but it is a correct way of interpreting the meaning of this statistic. Again, a value of +.80 or greater is generally taken to indicate good internal consistency.
Interrater Reliability
Many behavioral measures involve significant judgment on the part of an observer or a rater. Inter-rater reliability is the extent to which different observers are consistent in their judgments. For example, if you were interested in measuring university students’ social skills, you could make video recordings of them as they interacted with another student whom they are meeting for the first time. Then you could have two or more observers watch the videos and rate each student’s level of social skills. To the extent that each participant does, in fact, have some level of social skills that can be detected by an attentive observer, different observers’ ratings should be highly correlated with each other. Inter-rater reliability would also have been measured in Bandura’s Bobo doll study. In this case, the observers’ ratings of how many acts of aggression a particular child committed while playing with the Bobo doll should have been highly positively correlated. Interrater reliability is often assessed using Cronbach’s α when the judgments are quantitative or an analogous statistic called Cohen’s κ (the Greek letter kappa) when they are categorical.
Validity
Validity is the extent to which the scores from a measure represent the variable they are intended to. But how do researchers make this judgment? We have already considered one factor that they take into account—reliability. When a measure has good test-retest reliability and internal consistency, researchers should be more confident that the scores represent what they are supposed to. There has to be more to it, however, because a measure can be extremely reliable but have no validity whatsoever. As an absurd example, imagine someone who believes that people’s index finger length reflects their self-esteem and therefore tries to measure self-esteem by holding a ruler up to people’s index fingers. Although this measure would have extremely good test-retest reliability, it would have absolutely no validity. The fact that one person’s index finger is a centimeter longer than another’s would indicate nothing about which one had higher self-esteem.
Discussions of validity usually divide it into several distinct “types.” But a good way to interpret these types is that they are other kinds of evidence—in addition to reliability—that should be taken into account when judging the validity of a measure. Here we consider three basic kinds: face validity, content validity, and criterion validity.
Face Validity
Face validity is the extent to which a measurement method appears “on its face” to measure the construct of interest. Most people would expect a self-esteem questionnaire to include items about whether they see themselves as a person of worth and whether they think they have good qualities. So a questionnaire that included these kinds of items would have good face validity. The finger-length method of measuring self-esteem, on the other hand, seems to have nothing to do with self-esteem and therefore has poor face validity. Although face validity can be assessed quantitatively—for example, by having a large sample of people rate a measure in terms of whether it appears to measure what it is intended to—it is usually assessed informally.
Face validity is at best a very weak kind of evidence that a measurement method is measuring what it is supposed to. One reason is that it is based on people’s intuitions about human behavior, which are frequently wrong. It is also the case that many established measures in psychology work quite well despite lacking face validity. The Minnesota Multiphasic Personality Inventory-2 (MMPI-2) measures many personality characteristics and disorders by having people decide whether each of over 567 different statements applies to them—where many of the statements do not have any obvious relationship to the construct that they measure. For example, the items “I enjoy detective or mystery stories” and “The sight of blood doesn’t frighten me or make me sick” both measure the suppression of aggression. In this case, it is not the participants’ literal answers to these questions that are of interest, but rather whether the pattern of the participants’ responses to a series of questions matches those of individuals who tend to suppress their aggression.
Content Validity
Content validity is the extent to which a measure “covers” the construct of interest. For example, if a researcher conceptually defines test anxiety as involving both sympathetic nervous system activation (leading to nervous feelings) and negative thoughts, then his measure of test anxiety should include items about both nervous feelings and negative thoughts. Or consider that attitudes are usually defined as involving thoughts, feelings, and actions toward something. By this conceptual definition, a person has a positive attitude toward exercise to the extent that they think positive thoughts about exercising, feels good about exercising, and actually exercises. So to have good content validity, a measure of people’s attitudes toward exercise would have to reflect all three of these aspects. Like face validity, content validity is not usually assessed quantitatively. Instead, it is assessed by carefully checking the measurement method against the conceptual definition of the construct.
Criterion Validity
Criterion validity is the extent to which people’s scores on a measure are correlated with other variables (known as criteria) that one would expect them to be correlated with. For example, people’s scores on a new measure of test anxiety should be negatively correlated with their performance on an important school exam. If it were found that people’s scores were in fact negatively correlated with their exam performance, then this would be a piece of evidence that these scores really represent people’s test anxiety. But if it were found that people scored equally well on the exam regardless of their test anxiety scores, then this would cast doubt on the validity of the measure.
A criterion can be any variable that one has reason to think should be correlated with the construct being measured, and there will usually be many of them. For example, one would expect test anxiety scores to be negatively correlated with exam performance and course grades and positively correlated with general anxiety and with blood pressure during an exam. Or imagine that a researcher develops a new measure of physical risk taking. People’s scores on this measure should be correlated with their participation in “extreme” activities such as snowboarding and rock climbing, the number of speeding tickets they have received, and even the number of broken bones they have had over the years. When the criterion is measured at the same time as the construct, criterion validity is referred to as concurrent validity; however, when the criterion is measured at some point in the future (after the construct has been measured), it is referred to as predictive validity (because scores on the measure have “predicted” a future outcome).
Criteria can also include other measures of the same construct. For example, one would expect new measures of test anxiety or physical risk taking to be positively correlated with existing established measures of the same constructs. This is known as convergent validity.
Assessing convergent validity requires collecting data using the measure. Researchers John Cacioppo and Richard Petty did this when they created their self-report Need for Cognition Scale to measure how much people value and engage in thinking (Cacioppo & Petty, 1982)[15]. In a series of studies, they showed that people’s scores were positively correlated with their scores on a standardized academic achievement test, and that their scores were negatively correlated with their scores on a measure of dogmatism (which represents a tendency toward obedience). In the years since it was created, the Need for Cognition Scale has been used in literally hundreds of studies and has been shown to be correlated with a wide variety of other variables, including the effectiveness of an advertisement, interest in politics, and juror decisions (Petty, Briñol, Loersch, & McCaslin, 2009)[16].
Discriminant Validity
Discriminant validity, on the other hand, is the extent to which scores on a measure are not correlated with measures of variables that are conceptually distinct. For example, self-esteem is a general attitude toward the self that is fairly stable over time. It is not the same as mood, which is how good or bad one happens to be feeling right now. So people’s scores on a new measure of self-esteem should not be very highly correlated with their moods. If the new measure of self-esteem were highly correlated with a measure of mood, it could be argued that the new measure is not really measuring self-esteem; it is measuring mood instead.
When they created the Need for Cognition Scale, Cacioppo and Petty also provided evidence of discriminant validity by showing that people’s scores were not correlated with certain other variables. For example, they found only a weak correlation between people’s need for cognition and a measure of their cognitive style—the extent to which they tend to think analytically by breaking ideas into smaller parts or holistically in terms of “the big picture.” They also found no correlation between people’s need for cognition and measures of their test anxiety and their tendency to respond in socially desirable ways. All these low correlations provide evidence that the measure is reflecting a conceptually distinct construct.
Learning Objectives
- Define measurement and give several examples of measurement in psychology.
- Explain what a psychological construct is and give several examples.
- Distinguish conceptual from operational definitions, give examples of each, and create simple operational definitions.
- Distinguish the four levels of measurement, give examples of each, and explain why this distinction is important.
What Is Measurement?
Measurement is the assignment of scores to individuals so that the scores represent some characteristic of the individuals. This very general definition is consistent with the kinds of measurement that everyone is familiar with—for example, weighing oneself by stepping onto a bathroom scale, or checking the internal temperature of a roasting turkey using a meat thermometer. It is also consistent with measurement in the other sciences. In physics, for example, one might measure the potential energy of an object in Earth’s gravitational field by finding its mass and height (which of course requires measuring those variables) and then multiplying them together along with the gravitational acceleration of Earth (9.8 m/s2). The result of this procedure is a score that represents the object’s potential energy.
This general definition of measurement is consistent with measurement in psychology too. (Psychological measurement is often referred to as psychometrics.) Imagine, for example, that a cognitive psychologist wants to measure a person’s working memory capacity—their ability to hold in mind and think about several pieces of information all at the same time. To do this, she might use a backward digit span task, in which she reads a list of two digits to the person and asks them to repeat them in reverse order. She then repeats this several times, increasing the length of the list by one digit each time, until the person makes an error. The length of the longest list for which the person responds correctly is the score and represents their working memory capacity. Or imagine a clinical psychologist who is interested in how depressed a person is. He administers the Beck Depression Inventory, which is a 21-item self-report questionnaire in which the person rates the extent to which they have felt sad, lost energy, and experienced other symptoms of depression over the past 2 weeks. The sum of these 21 ratings is the score and represents the person's current level of depression.
The important point here is that measurement does not require any particular instruments or procedures. What it does require is some systematic procedure for assigning scores to individuals or objects so that those scores represent the characteristic of interest.
Psychological Constructs
Many variables studied by psychologists are straightforward and simple to measure. These include age, height, weight, and birth order. You can ask people how old they are and be reasonably sure that they know and will tell you. Although people might not know or want to tell you how much they weigh, you can have them step onto a bathroom scale. Other variables studied by psychologists—perhaps the majority—are not so straightforward or simple to measure. We cannot accurately assess people’s level of intelligence by looking at them, and we certainly cannot put their self-esteem on a bathroom scale. These kinds of variables are called constructs (pronounced CON-structs) and include personality traits (e.g., extraversion), emotional states (e.g., fear), attitudes (e.g., toward taxes), and abilities (e.g., athleticism).
Psychological constructs cannot be observed directly. One reason is that they often represent tendencies to think, feel, or act in certain ways. For example, to say that a particular university student is highly extraverted does not necessarily mean that she is behaving in an extraverted way right now. In fact, she might be sitting quietly by herself, reading a book. Instead, it means that she has a general tendency to behave in extraverted ways (e.g., being outgoing, enjoying social interactions) across a variety of situations. Another reason psychological constructs cannot be observed directly is that they often involve internal processes. Fear, for example, involves the activation of certain central and peripheral nervous system structures, along with certain kinds of thoughts, feelings, and behaviors—none of which is necessarily obvious to an outside observer. Notice also that neither extraversion nor fear “reduces to” any particular thought, feeling, act, or physiological structure or process. Instead, each is a kind of summary of a complex set of behaviors and internal processes.
The Big Five
The Big Five is a set of five broad dimensions that capture much of the variation in human personality. Each of the Big Five can even be defined in terms of six more specific constructs called “facets” (Costa & McCrae, 1992)[17].

The conceptual definition of a psychological construct describes the behaviors and internal processes that make up that construct, along with how it relates to other variables. For example, a conceptual definition of neuroticism (another one of the Big Five) would be that it is people’s tendency to experience negative emotions such as anxiety, anger, and sadness across a variety of situations. This definition might also include that it has a strong genetic component, remains fairly stable over time, and is positively correlated with the tendency to experience pain and other physical symptoms.
Students sometimes wonder why, when researchers want to understand a construct like self-esteem or neuroticism, they do not simply look it up in the dictionary. One reason is that many scientific constructs do not have counterparts in everyday language (e.g., working memory capacity). More important, researchers are in the business of developing definitions that are more detailed and precise—and that more accurately describe the way the world is—than the informal definitions in the dictionary. As we will see, they do this by proposing conceptual definitions, testing them empirically, and revising them as necessary. Sometimes they throw them out altogether. This is why the research literature often includes different conceptual definitions of the same construct. In some cases, an older conceptual definition has been replaced by a newer one that fits and works better. In others, researchers are still in the process of deciding which of various conceptual definitions is the best.
Operational Definitions
An operational definition is a definition of a variable in terms of precisely how it is to be measured. These measures generally fall into one of three broad categories. Self-report measures are those in which participants report on their own thoughts, feelings, and actions, as with the Rosenberg Self-Esteem Scale (Rosenberg, 1965)[18]. Behavioral measures are those in which some other aspect of participants’ behavior is observed and recorded. This is an extremely broad category that includes the observation of people’s behavior both in highly structured laboratory tasks and in more natural settings. A good example of the former would be measuring working memory capacity using the backward digit span task. A good example of the latter is a famous operational definition of physical aggression from researcher Albert Bandura and his colleagues (Bandura, Ross, & Ross, 1961)[19]. They let each of several children play for 20 minutes in a room that contained a clown-shaped punching bag called a Bobo doll. They filmed each child and counted the number of acts of physical aggression the child committed. These included hitting the doll with a mallet, punching it, and kicking it. Their operational definition, then, was the number of these specifically defined acts that the child committed during the 20-minute period. Finally, physiological measures are those that involve recording any of a wide variety of physiological processes, including heart rate and blood pressure, galvanic skin response, hormone levels, and electrical activity and blood flow in the brain.
For any given variable or construct, there will be multiple operational definitions. Stress is a good example. A rough conceptual definition is that stress is an adaptive response to a perceived danger or threat that involves physiological, cognitive, affective, and behavioral components. But researchers have operationally defined it in several ways. The Social Readjustment Rating Scale (Holmes & Rahe, 1967)[20] is a self-report questionnaire on which people identify stressful events that they have experienced in the past year and assigns points for each one depending on its severity. For example, a man who has been divorced (73 points), changed jobs (36 points), and had a change in sleeping habits (16 points) in the past year would have a total score of 125. The Hassles and Uplifts Scale (Delongis, Coyne, Dakof, Folkman & Lazarus, 1982) [21] is similar but focuses on everyday stressors like misplacing things and being concerned about one’s weight. The Perceived Stress Scale (Cohen, Kamarck, & Mermelstein, 1983) [22] is another self-report measure that focuses on people’s feelings of stress (e.g., “How often have you felt nervous and stressed?”). Researchers have also operationally defined stress in terms of several physiological variables including blood pressure and levels of the stress hormone cortisol.
When psychologists use multiple operational definitions of the same construct—either within a study or across studies—they are using converging operations. The idea is that the various operational definitions are “converging” or coming together on the same construct. When scores based on several different operational definitions are closely related to each other and produce similar patterns of results, this constitutes good evidence that the construct is being measured effectively and that it is useful. The various measures of stress, for example, are all correlated with each other and have all been shown to be correlated with other variables such as immune system functioning (also measured in a variety of ways) (Segerstrom & Miller, 2004)[23]. This is what allows researchers eventually to draw useful general conclusions, such as “stress is negatively correlated with immune system functioning,” as opposed to more specific and less useful ones, such as “people’s scores on the Perceived Stress Scale are negatively correlated with their white blood counts.”
Levels of Measurement
The psychologist S. S. Stevens suggested that scores can be assigned to individuals in a way that communicates more or less quantitative information about the variable of interest (Stevens, 1946)[24]. For example, the officials at a 100-m race could simply rank order the runners as they crossed the finish line (first, second, etc.), or they could time each runner to the nearest tenth of a second using a stopwatch (11.5 s, 12.1 s, etc.). In either case, they would be measuring the runners’ times by systematically assigning scores to represent those times. But while the rank ordering procedure communicates the fact that the second-place runner took longer to finish than the first-place finisher, the stopwatch procedure also communicates how much longer the second-place finisher took. Stevens actually suggested four different levels of measurement (which he called “scales of measurement”) that correspond to four types of information that can be communicated by a set of scores, and the statistical procedures that can be used with the information.
The nominal level of measurement is used for categorical variables and involves assigning scores that are category labels. Category labels communicate whether any two individuals are the same or different in terms of the variable being measured. For example, if you ask your participants about their marital status, you are engaged in nominal-level measurement. Or if you ask your participants to indicate which of several ethnicities they identify themselves with, you are again engaged in nominal-level measurement. The essential point about nominal scales is that they do not imply any ordering among the responses. For example, when classifying people according to their favorite color, there is no sense in which green is placed "ahead of" blue. Responses are merely categorized. Nominal scales thus embody the lowest level of measurement[25].
The remaining three levels of measurement are used for quantitative variables. The ordinal level of measurement involves assigning scores so that they represent the rank order of the individuals. Ranks communicate not only whether any two individuals are the same or different in terms of the variable being measured but also whether one individual is higher or lower on that variable. For example, a researcher wishing to measure consumers' satisfaction with their microwave ovens might ask them to specify their feelings as either "very dissatisfied," "somewhat dissatisfied," "somewhat satisfied," or "very satisfied." The items in this scale are ordered, ranging from least to most satisfied. This is what distinguishes ordinal from nominal scales. Unlike nominal scales, ordinal scales allow comparisons of the degree to which two individuals rate the variable. For example, our satisfaction ordering makes it meaningful to assert that one person is more satisfied than another with their microwave ovens. Such an assertion reflects the first person's use of a verbal label that comes later in the list than the label chosen by the second person.
On the other hand, ordinal scales fail to capture important information that will be present in the other levels of measurement we examine. In particular, the difference between two levels of an ordinal scale cannot be assumed to be the same as the difference between two other levels (just like you cannot assume that the gap between the runners in first and second place is equal to the gap between the runners in second and third place). In our satisfaction scale, for example, the difference between the responses "very dissatisfied" and "somewhat dissatisfied" is probably not equivalent to the difference between "somewhat dissatisfied" and "somewhat satisfied." Nothing in our measurement procedure allows us to determine whether the two differences reflect the same difference in psychological satisfaction. Statisticians express this point by saying that the differences between adjacent scale values do not necessarily represent equal intervals on the underlying scale giving rise to the measurements. (In our case, the underlying scale is the true feeling of satisfaction, which we are trying to measure.)
The interval level of measurement involves assigning scores using numerical scales in which intervals have the same interpretation throughout. As an example, consider either the Fahrenheit or Celsius temperature scales. The difference between 30 degrees and 40 degrees represents the same temperature difference as the difference between 80 degrees and 90 degrees. This is because each 10-degree interval has the same physical meaning (in terms of the kinetic energy of molecules).
Interval scales are not perfect, however. In particular, they do not have a true zero point even if one of the scaled values happens to carry the name "zero." The Fahrenheit scale illustrates the issue. Zero degrees Fahrenheit does not represent the complete absence of temperature (the absence of any molecular kinetic energy). In reality, the label "zero" is applied to its temperature for quite accidental reasons connected to the history of temperature measurement. Since an interval scale has no true zero point, it does not make sense to compute ratios of temperatures. For example, there is no sense in which the ratio of 40 to 20 degrees Fahrenheit is the same as the ratio of 100 to 50 degrees; no interesting physical property is preserved across the two ratios. After all, if the "zero" label were applied at the temperature that Fahrenheit happens to label as 10 degrees, the two ratios would instead be 30 to 10 and 90 to 40, no longer the same! For this reason, it does not make sense to say that 80 degrees is "twice as hot" as 40 degrees. Such a claim would depend on an arbitrary decision about where to "start" the temperature scale, namely, what temperature to call zero (whereas the claim is intended to make a more fundamental assertion about the underlying physical reality).
In psychology, the intelligence quotient (IQ) is often considered to be measured at the interval level. While it is technically possible to receive a score of 0 on an IQ test, such a score would not indicate the complete absence of IQ. Moreover, a person with an IQ score of 140 does not have twice the IQ of a person with a score of 70. However, the difference between IQ scores of 80 and 100 is the same as the difference between IQ scores of 120 and 140.
Finally, the ratio level of measurement involves assigning scores in such a way that there is a true zero point that represents the complete absence of the quantity. Height measured in meters and weight measured in kilograms are good examples. So are counts of discrete objects or events such as the number of siblings one has or the number of questions a student answers correctly on an exam. You can think of a ratio scale as the three earlier scales rolled up in one. Like a nominal scale, it provides a name or category for each object (the numbers serve as labels). Like an ordinal scale, the objects are ordered (in terms of the ordering of the numbers). Like an interval scale, the same difference at two places on the scale has the same meaning. However, in addition, the same ratio at two places on the scale also carries the same meaning (see Table 4.1).
The Fahrenheit scale for temperature has an arbitrary zero point and is therefore not a ratio scale. However, zero on the Kelvin scale is absolute zero. This makes the Kelvin scale a ratio scale. For example, if one temperature is twice as high as another as measured on the Kelvin scale, then it has twice the kinetic energy of the other temperature.
Another example of a ratio scale is the amount of money you have in your pocket right now (25 cents, 50 cents, etc.). Money is measured on a ratio scale because, in addition to having the properties of an interval scale, it has a true zero point: if you have zero money, this actually implies the absence of money. Since money has a true zero point, it makes sense to say that someone with 50 cents has twice as much money as someone with 25 cents.
Stevens’s levels of measurement are important for at least two reasons. First, they emphasize the generality of the concept of measurement. Although people do not normally think of categorizing or ranking individuals as measurement, in fact, they are as long as they are done so that they represent some characteristic of the individuals. Second, the levels of measurement can serve as a rough guide to the statistical procedures that can be used with the data and the conclusions that can be drawn from them. With nominal-level measurement, for example, the only available measure of central tendency is the mode. With ordinal-level measurement, the median or mode can be used as indicators of central tendency. Interval and ratio-level measurement are typically considered the most desirable because they permit for any indicators of central tendency to be computed (i.e., mean, median, or mode). Also, ratio-level measurement is the only level that allows meaningful statements about ratios of scores. Once again, one cannot say that someone with an IQ of 140 is twice as intelligent as someone with an IQ of 70 because IQ is measured at the interval level, but one can say that someone with six siblings has twice as many as someone with three because number of siblings is measured at the ratio level.
| Level of Measurement | Category labels | Rank order | Equal intervals | True zero |
| NOMINAL | X | |||
| ORDINAL | X | X | ||
| INTERVAL | X | X | X | |
| RATIO | X | X | X | X |
Learning Objectives
- Distinguish between descriptive and inferential statistics
- Identify the different kinds of descriptive statistics researchers use to summarize their data
- Describe the purpose of inferential statistics.
- Distinguish between Type I and Type II errors.
Once the study is complete and the observations have been made and recorded the researchers need to analyze the data and draw their conclusions. Typically, data are analyzed using both descriptive and inferential statistics. Descriptive statistics are used to summarize the data and inferential statistics are used to generalize the results from the sample to the population. In turn, inferential statistics are used to make conclusions about whether or not a theory has been supported, refuted, or requires modification.
Descriptive Statistics
Descriptive statistics are used to organize or summarize a set of data. Examples include percentages, measures of central tendency (mean, median, mode), measures of dispersion (range, standard deviation, variance), and correlation coefficients.
Measures of central tendency are used to describe the typical, average and center of a distribution of scores. The mode is the most frequently occurring score in a distribution. The median is the midpoint of a distribution of scores. The mean is the average of a distribution of scores.
Measures of dispersion are also considered descriptive statistics. They are used to describe the degree of spread in a set of scores. So are all of the scores similar and clustered around the mean or is there a lot of variability in the scores? The range is a measure of dispersion that measures the distance between the highest and lowest scores in a distribution. The standard deviation is a more sophisticated measure of dispersion that measures the average distance of scores from the mean. The variance is just the standard deviation squared. So it also measures the distance of scores from the mean but in a different unit of measure.
Typically means and standard deviations are computed for experimental research studies in which an independent variable was manipulated to produce two or more groups and a dependent variable was measured quantitatively. The means from each experimental group or condition are calculated separately and are compared to see if they differ.
For non-experimental research, simple percentages may be computed to describe the percentage of people who engaged in some behavior or held some belief. But more commonly non-experimental research involves computing the correlation between two variables. A correlation coefficient describes the strength and direction of the relationship between two variables. The values of a correlation coefficient can range from −1.00 (the strongest possible negative relationship) to +1.00 (the strongest possible positive relationship). A value of 0 means there is no relationship between the two variables. Positive correlation coefficients indicate that as the values of one variable increase, so do the values of the other variable. A good example of a positive correlation is the correlation between height and weight, because as height increases weight also tends to increase. Negative correlation coefficients indicate that as the value of one variable increase, the values of the other variable decrease. An example of a negative correlation is the correlation between stressful life events and happiness; because as stress increases, happiness is likely to decrease.
Inferential Statistics
As you learned in the section of this chapter on sampling, typically researchers sample from a population but ultimately they want to be able to generalize their results from the sample to a broader population. Researchers typically want to infer what the population is like based on the sample they studied. Inferential statistics are used for that purpose. Inferential statistics allow researchers to draw conclusions about a population based on data from a sample. Inferential statistics are crucial because the effects (i.e., the differences in the means or the correlation coefficient) that researchers find in a study may be due simply to random chance variability or they may be due to a real effect (i.e., they may reflect a real relationship between variables or a real effect of an independent variable on a dependent variable).
Researchers use inferential statistics to determine whether their effects are statistically significant. A statistically significant effect is one that is unlikely due to random chance and therefore likely represents a real effect in the population. More specifically results that have less than a 5% chance of being due to random error are typically considered statistically significant. When an effect is statistically significant it is appropriate to generalize the results from the sample to the population. In contrast, if inferential statistics reveal that there is more than a 5% chance that an effect could be due to chance error alone then the researcher must conclude that their result is not statistically significant.
It is important to keep in mind that statistics are probabilistic in nature. They allow researchers to determine whether the chances are low that their results are due to random error, but they don’t provide any absolute certainty. Hopefully, when we conclude that an effect is statistically significant it is a real effect that we would find if we tested the entire population. And hopefully when we conclude that an effect is not statistically significant there really is no effect and if we tested the entire population we would find no effect. And that 5% threshold is set at 5% to ensure that there is a high probability that we make a correct decision and that our determination of statistical significance is an accurate reflection of reality.
But mistakes can always be made. Specifically, two kinds of mistakes can be made. First, researchers can make a Type I error, which is a false positive. It is when a researcher concludes that their results are statistically significant (so they say there is an effect in the population) when in reality there is no real effect in the population and the results are just due to chance (they are a fluke). When the threshold is set to 5%, which is the convention, then the researcher has a 5% chance or less of making a Type I error. You might wonder why researchers don’t set it even lower to reduce the chances of making a Type I error. The reason is when the chances of making a Type I error are reduced, the chances of making a Type II error are increased. A Type II error is a missed opportunity. It is when a researcher concludes that their results are not statistically significant when in reality there is a real effect in the population and they just missed detecting it. Once again, these Type II errors are more likely to occur when the threshold is set too low (e.g., set at 1% instead of 5%) and/or when the sample was too small.
