12 Analyzing the Data
Learning Objectives
- Distinguish between descriptive and inferential statistics
- Identify the different kinds of descriptive statistics researchers use to summarize their data
- Describe the purpose of inferential statistics.
- Distinguish between Type I and Type II errors.
Once the study is complete and the observations have been made and recorded the researchers need to analyze the data and draw their conclusions. Typically, data are analyzed using both descriptive and inferential statistics. Descriptive statistics are used to summarize the data and inferential statistics are used to generalize the results from the sample to the population. In turn, inferential statistics are used to make conclusions about whether or not a theory has been supported, refuted, or requires modification.
Descriptive Statistics
Descriptive statistics are used to organize or summarize a set of data. Examples include percentages, measures of central tendency (mean, median, mode), measures of dispersion (range, standard deviation, variance), and correlation coefficients.
Measures of central tendency are used to describe the typical, average and center of a distribution of scores. The mode is the most frequently occurring score in a distribution. The median is the midpoint of a distribution of scores. The mean is the average of a distribution of scores.
Measures of dispersion are also considered descriptive statistics. They are used to describe the degree of spread in a set of scores. So are all of the scores similar and clustered around the mean or is there a lot of variability in the scores? The range is a measure of dispersion that measures the distance between the highest and lowest scores in a distribution. The standard deviation is a more sophisticated measure of dispersion that measures the average distance of scores from the mean. The variance is just the standard deviation squared. So it also measures the distance of scores from the mean but in a different unit of measure.
Typically means and standard deviations are computed for experimental research studies in which an independent variable was manipulated to produce two or more groups and a dependent variable was measured quantitatively. The means from each experimental group or condition are calculated separately and are compared to see if they differ.
For non-experimental research, simple percentages may be computed to describe the percentage of people who engaged in some behavior or held some belief. But more commonly non-experimental research involves computing the correlation between two variables. A correlation coefficient describes the strength and direction of the relationship between two variables. The values of a correlation coefficient can range from −1.00 (the strongest possible negative relationship) to +1.00 (the strongest possible positive relationship). A value of 0 means there is no relationship between the two variables. Positive correlation coefficients indicate that as the values of one variable increase, so do the values of the other variable. A good example of a positive correlation is the correlation between height and weight, because as height increases weight also tends to increase. Negative correlation coefficients indicate that as the value of one variable increase, the values of the other variable decrease. An example of a negative correlation is the correlation between stressful life events and happiness; because as stress increases, happiness is likely to decrease.
Inferential Statistics
As you learned in the section of this chapter on sampling, typically researchers sample from a population but ultimately they want to be able to generalize their results from the sample to a broader population. Researchers typically want to infer what the population is like based on the sample they studied. Inferential statistics are used for that purpose. Inferential statistics allow researchers to draw conclusions about a population based on data from a sample. Inferential statistics are crucial because the effects (i.e., the differences in the means or the correlation coefficient) that researchers find in a study may be due simply to random chance variability or they may be due to a real effect (i.e., they may reflect a real relationship between variables or a real effect of an independent variable on a dependent variable).
Researchers use inferential statistics to determine whether their effects are statistically significant. A statistically significant effect is one that is unlikely due to random chance and therefore likely represents a real effect in the population. More specifically results that have less than a 5% chance of being due to random error are typically considered statistically significant. When an effect is statistically significant it is appropriate to generalize the results from the sample to the population. In contrast, if inferential statistics reveal that there is more than a 5% chance that an effect could be due to chance error alone then the researcher must conclude that their result is not statistically significant.
It is important to keep in mind that statistics are probabilistic in nature. They allow researchers to determine whether the chances are low that their results are due to random error, but they don’t provide any absolute certainty. Hopefully, when we conclude that an effect is statistically significant it is a real effect that we would find if we tested the entire population. And hopefully when we conclude that an effect is not statistically significant there really is no effect and if we tested the entire population we would find no effect. And that 5% threshold is set at 5% to ensure that there is a high probability that we make a correct decision and that our determination of statistical significance is an accurate reflection of reality.
But mistakes can always be made. Specifically, two kinds of mistakes can be made. First, researchers can make a Type I error, which is a false positive. It is when a researcher concludes that their results are statistically significant (so they say there is an effect in the population) when in reality there is no real effect in the population and the results are just due to chance (they are a fluke). When the threshold is set to 5%, which is the convention, then the researcher has a 5% chance or less of making a Type I error. You might wonder why researchers don’t set it even lower to reduce the chances of making a Type I error. The reason is when the chances of making a Type I error are reduced, the chances of making a Type II error are increased. A Type II error is a missed opportunity. It is when a researcher concludes that their results are not statistically significant when in reality there is a real effect in the population and they just missed detecting it. Once again, these Type II errors are more likely to occur when the threshold is set too low (e.g., set at 1% instead of 5%) and/or when the sample was too small.
The most frequently occurring score in a distribution.
The midpoint of a distribution of scores in the sense that half the scores in the distribution are less than it and half are greater than it.
The average of a distribution of scores (symbolized M) where the sum of the scores are divided by the number of scores.
A measure of dispersion that measures the distance between the highest and lowest scores in a distribution.
Learning Objectives
- Develop and revise questions that focus your inquiry
- Create a concept map that demonstrates the relationships between concepts
Once you have selected your topic area and reviewed literature related to it, you may need to narrow it down to something that can be realistically researched and answered. In the last section, we learned about asking who, what, when, where, why, and how questions. As you read more about your topic area, the focus of your inquiry should become more specific and clearer. As a result, you might begin to ask questions that describe a phenomenon, compare one phenomenon with another, or probe the relationship between two concepts.
You might begin by asking a series of PICO questions. Although the PICO method is used primarily in the health sciences, it can also be useful for narrowing/refining a research question in the social sciences. A way to formulate an answerable question using the PICO model could look something like this:
- Patient, population or problem: What are the characteristics of the patient or population? (e.g., gender, age, other demographics) What is the social problem or diagnosis you are interested in? (e.g., poverty or substance use disorder)
- Intervention or exposure: What do you want to do with the patient, person, or population (e.g., treat, diagnose, observe)? For example, you may want to observe a client’s behavior or a reaction to a specific type of treatment.
- Comparison: What is the alternative to the intervention? (e.g., other therapeutic interventions, programs, or policies) For example, how does a sample group that is assigned to mandatory rehabilitation compare to a sample group assigned to an intervention that builds motivation to enter treatment voluntarily?
- Outcome: What are the relevant outcomes? (e.g., academic achievement, healthy relationships, shame) For example, how does recognizing triggers for trauma flashbacks impact the target population?
Some examples of how the PICO method is used to refine a research question include:
- “Can music therapy improve communication skills in students diagnosed with autism spectrum disorder?”
- Population (autistic students)
- Intervention (music therapy)
- “How effective are antidepressant medications in reducing symptoms of anxiety and depression?”
- Population (clients with anxiety and depression)
- Intervention (antidepressants)
- “How does race impact help-seeking behaviors for students with mental health diagnoses?
- Population (students with mental health diagnoses, students of minority races)
- Comparison (students of different races)
- Outcome (seeking help for mental health issues)
Another mnemonic technique used in the social sciences for narrowing a topic is SPICE. An example of how SPICE factors can be used to develop a research question is given below:
Setting – for example, a college campus
Perspective – for example, college students
Intervention – for example, text message reminders
Comparisons – for example, telephone message re minders
Evaluation – for example, number of cigarettes used after text message reminder compared to the number of cigarettes used after a telephone reminder
Developing a concept map
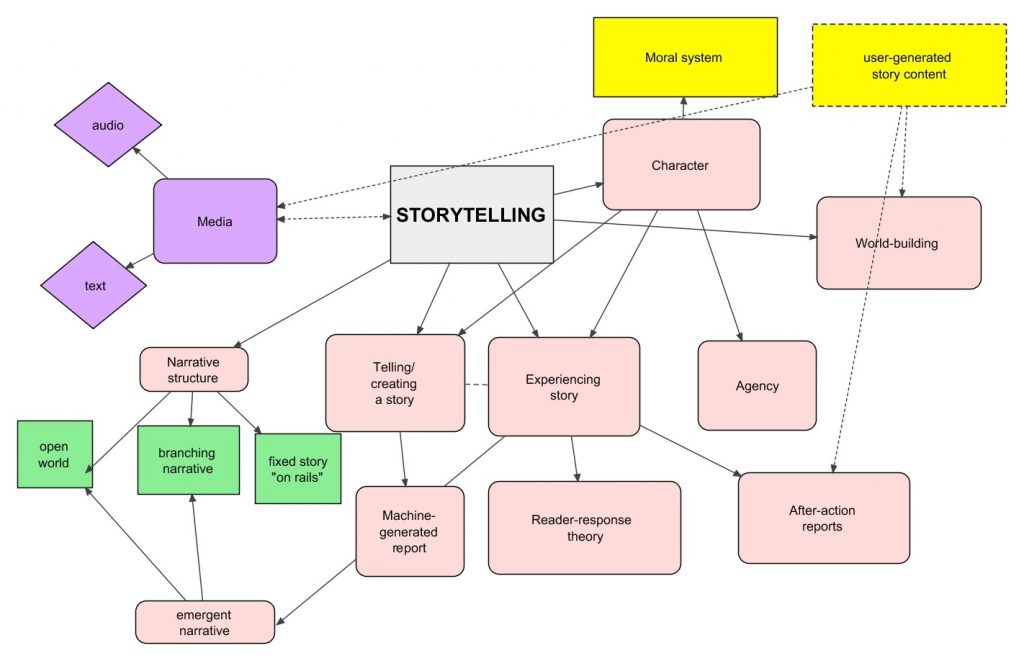
Likewise, developing a concept map or mind map around your topic may help you analyze your question and determine more precisely what you want to research. Using this technique, start with the broad topic, issue, or problem, and begin writing down all the words, phrases and ideas related to that topic that come to mind and then ‘map’ them to the original idea. This technique is illustrated in Figure 3.2.
Concept mapping aims to improve the “description of the breadth and depth of literature in a domain of inquiry. It also facilitates identification of the number and nature of studies underpinning mapped relationships among concepts, thus laying the groundwork for systematic research reviews and meta-analyses” (Lesley, Floyd, & Oermann, 2002, p. 229). [2] Its purpose, like the other methods of question refining, is to help you organize, prioritize, and integrate material into a workable research area; one that is interesting, answerable, feasible, objective, scholarly, original, and clear.
The process of concept mapping is beneficial when you begin your own literature review, as it will help you to come up with keywords and concepts related to your topic. Concept mapping can also be helpful when creating a topical outline or drafting your literature review, as it demonstrates the important of each concept and sub-concepts as well as the relationships between each concept.
For example, perhaps your initial idea or interest is how to prevent obesity. After an initial search of the relevant literature, you realize the topic of obesity is too broad to adequately cover in the time you have to do your literature review. You decide to narrow your focus to causes of childhood obesity. Using PICO factors, you further narrow your search to the influence of family factors on overweight children. A potential research question might then be “What maternal factors are associated with toddler obesity in the United States?” You’re now ready to begin searching the literature for studies, reports, cases, and other information sources that relate to this question.
Similarly, for a broad topic like school performance or grades, and after an initial literature search that provides some variables, examples of a narrow research question might be:
- “To what extent does parental involvement in children’s education relate to school performance over the course of the early grades?”
- “Do parental involvement levels differ by family, social, demographic, and contextual characteristics?”
- “What forms of parent involvement are most highly correlated with children’s outcomes? What factors might influence the extent of parental involvement?” (Early Childhood Longitudinal Program, 2011). [3]
In either case, your literature search, working question, and understanding of the topic are constantly changing as your knowledge of the topic deepens. Conducting a literature review is an iterative process, as it stops, starts, and loops back on itself multiple times before completion. As research is a practice behavior of social workers, you should apply the same type of critical reflection to your inquiry as you would to your clinical or macro practice.
Key Takeaways
- As you read more articles, you should revise your original question to make it more focused and clear.
- You can further develop the important concepts and relationships for your project by using concept maps and the PICO/SPICE frameworks.
Learning Objectives
- Identify the key components of empirical journal articles
- Define the basic elements of the results section in a journal article
- Describe statistical significance and confidence intervals
Reading scholarly articles can be a more challenging than reading a book, magazine, news article—or even some textbooks. Theoretical and practical articles are, generally speaking, easier to understand. Empirical articles, because they add new knowledge, must go through great detail to demonstrate that the information they offer is based on solid science. Empirical articles can be challenging to read, and this section is designed to make that process easier for you.

Nearly all articles will have an abstract, the short paragraph at the beginning of an article that summarizes the author’s research question, methods used to answer the question, and key findings. The abstract may also give you some idea about the theoretical perspective of the author. In effect, the abstract provides you with a framework to understand the rest of the article and the article's punch line: what the author(s) found, and whether the article is relevant to your area of inquiry. For this reason, I suggest skimming abstracts as part of the literature search process.
As you will recall from Chapter 2, theoretical articles have no set structure and will look similar to reading a chapter of a book. Empirical articles contain the following sections (although exact section names vary): introduction, methods, results, and discussion. The introduction contains the literature review for the article and is an excellent source of information as you build your own literature review. The methods section reviews how the author gathered their sample, how they measured their variables, and how the data were analyzed. The results section provides an in-depth discussion of the findings of the study. The discussion section reviews the main findings and addresses how those findings fit in with the existing literature. At the end, there will be a list of references (which you should read!) and there may be a few tables, figures, or appendices if applicable.
While you should get into the habit of familiarizing yourself with each part of the articles you wish to cite, there are strategic ways to read journal articles that can make them a little easier to digest. Once you have read the abstract for an article and determined it is one you’d like to read in full, read through the introduction and discussion sections next. The introduction section will showcase other articles and findings that are significant in your topic area, so reading through it will be beneficial for your own information-gathering process for your literature review. Reading an article’s discussion section helps you understand what the author views as their study’s major findings and how the author perceives those findings to relate to other research.
As you progress through your research methods course, you will pick up additional research elements that are important to understand. You will learn how to identify qualitative and quantitative methods, as well as exploratory, explanatory, and descriptive research methods. You will also learn the criteria for establishing causality and the different types of causality. Subsequent chapters of this textbook will address other elements of journal articles, including choices about measurement, sampling, and design. As you learn about these additional items, you will find that the methods and results sections begin to make more sense and you will understand how the authors reached their conclusions.
As you read a research report, there are several questions you can ask yourself about each section, from abstract to conclusion. Those questions are summarized in Table 3.1. Keep in mind that the questions covered here are designed to help you, the reader, to think critically about the research you come across and to get a general understanding of the strengths, weaknesses, and key takeaways from a given study. I hope that by considering how you might respond to the following questions while reading research reports, you’ll gain confidence in describing the report to others and discussing its meaning and impact with them.
| Report section | Questions worth asking |
| Abstract | What are the key findings? How were those findings reached? What framework does the researcher employ? |
| Acknowledgments | Who are this study’s major stakeholders? Who provided feedback? Who provided support in the form of funding or other resources? |
| Problem statement (introduction) | How does the author frame their research focus? What other possible ways of framing the problem exist? Why might the author have chosen this particular way of framing the problem? |
| Literature review (introduction) |
How selective does the researcher appear to have been in identifying relevant literature to discuss? Does the review of literature appear appropriately extensive? Does the researcher provide a critical review? |
| Sample (methods) | Where was the data collected? Did the researcher collect their own data or use someone else's data? What population is the study trying to make claims about, and does the sample represent that population well? What are the sample’s major strengths and major weaknesses? |
| Data collection (methods) | How were the data collected? What do you know about the relative strengths and weaknesses of the method employed? What other methods of data collection might have been employed, and why was this particular method employed? What do you know about the data collection strategy and instruments (e.g., questions asked, locations observed)? What don’t you know about the data collection strategy and instruments? |
| Data analysis (methods) | How were the data analyzed? Is there enough information provided for you to feel confident that the proper analytic procedures were employed accurately? |
| Results | What are the study’s major findings? Are findings linked back to previously described research questions, objectives, hypotheses, and literature? Are sufficient amounts of data (e.g., quotes and observations in qualitative work, statistics in quantitative work) provided in order to support conclusions drawn? Are tables readable? |
| Discussion/conclusion | Does the author generalize to some population beyond her/his/their sample? How are these claims presented? Are claims made supported by data provided in the results section (e.g., supporting quotes, statistical significance)? Have limitations of the study been fully disclosed and adequately addressed? Are implications sufficiently explored? |
Understanding the results section
As mentioned previously in this chapter, reading the abstract that appears in most reports of scholarly research will provide you with an excellent, easily digestible review of a study’s major findings and of the framework the author is using to position their findings. Abstracts typically contain just a few hundred words, so reading them is a nice way to quickly familiarize yourself with a study. If the study seems relevant to your paper, it’s probably worth reading more. If it’s not, then you have only spent a minute or so reading the abstract. Another way to get a snapshot of the article is to scan the headings, tables, and figures throughout the report (Green & Simon, 2012). [4]
At this point, I have read hundreds of literature reviews written by students. One of the challenges I have noted is that students will report the summarized results from the abstract, rather than the detailed findings in the results section of the article. This is a problem when you are writing a literature review because you need to provide specific and clear facts that support your reading of the literature. The abstract may say something like: “we found that poverty is associated with mental health status.” For your literature review, you want the details, not the summary. In the results section of the article, you may find a sentence that states: “for households in poverty, children are three times more likely to have a mental health diagnosis.” This more detailed information provides a stronger basis on which to build a literature review.
Using the summarized results in an abstract is an understandable mistake to make. The results section often contains terminology, diagrams, and symbols that may be hard to understand without having completed advanced coursework on statistical or qualitative analysis. To that end, the purpose of this section is to improve reading comprehension by providing an introduction to the basic components of a results section.
Journal articles often contain tables, and scanning them is a good way to begin reading an article. A table provides a quick, condensed summary of the report’s key findings. The use of tables is not limited to one form or type of data, though they are used most commonly in quantitative research. Tables are a concise way to report large amounts of data. Some tables present descriptive information about a researcher’s sample, which is often the first table in a results section. These tables will likely contain frequencies (N) and percentages (%). For example, if gender happened to be an important variable for the researcher’s analysis, a descriptive table would show how many and what percent of all study participants are women, men, or other genders. Frequencies or counts will probably be listed as N, while the percent symbol (%) might be used to indicate percentages.
In a table presenting a causal relationship, two sets of variables are represented. The independent variable, or cause, and the dependent variable, the effect. We’ll go into more detail on variables in Chapter 6. The independent variable attributes are typically presented in the table’s columns, while dependent variable attributes are presented in rows. This allows the reader to scan across a table’s rows to see how values on the dependent variable attributes change as the independent variable attribute values change. Tables displaying results of quantitative analysis will also likely include some information about the strength and statistical significance of the relationships presented in the table. These details tell the reader how likely it is that the relationships presented will have occurred simply by chance.
Let’s look at a specific example. Table 3.2 shows data from a study of older adults that was conducted by Dr. Blackstone, an original author of this textbook. It presents the causal relationship between gender and the experience of harassing behaviors in the workplace. In this example, gender is the independent variable (the cause) and the harassing behaviors listed are the dependent variables (the effects). [5] Therefore, we place gender in the table’s columns and harassing behaviors in the table’s rows.
Reading across the table’s top row, we see that 2.9% of women in the sample reported experiencing subtle or obvious threats to their safety at work, while 4.7% of men in the sample reported the same. We can read across each of the rows of the table in this way. Reading across the bottom row, we see that 9.4% of women in the sample reported experiencing staring or invasion of their personal space at work while just 2.3% of men in the sample reported having the same experience. We’ll discuss p value later in this section.
| Behavior Experienced at work | Women | Men | p value |
| Subtle or obvious threats to your safety | 2.9% | 4.7% | 0.623 |
| Being hit, pushed, or grabbed | 2.2% | 4.7% | 0.480 |
| Comments or behaviors that demean your gender | 6.5% | 2.3% | 0.184 |
| Comments or behaviors that demean your age | 13.8% | 9.3% | 0.407 |
| Staring or invasion of your personal space | 9.4% | 2.3% | 0.039 |
| Note: Sample size was 138 for women and 43 for men. | |||
These statistics represent what the researchers found in their sample, and they are using their sample to make conclusions about the true population of all employees in the real world. Because the methods we use in social science are never perfect, there is some amount of error in that value. The researchers in this study estimated the true value we would get if we asked every employee in the world the same questions on our survey. Researchers will often provide a confidence interval, or a range of values in which the true value is likely to be, to provide a more accurate description of their data. For example, at the time I’m writing this, my wife and I are expecting our first child next month. The doctor told us our due date was August 15th. But the doctor also told us that August 15th was only their best estimate. They were actually 95% sure our baby might be born any time between August 1st and September 1st. Confidence intervals are often listed with a percentage, like 90% or 95%, and a range of values, such as between August 1st and September 1st. You can read that as: we are 95% sure your baby will be born between August 1st and September 1st. So, while we get a due date of August 15th, the uncertainty about the exact date is reflected in the confidence interval provided by our doctor.
Of course, we cannot assume that these patterns didn’t simply occur by chance. How confident can we be that the findings presented in the table did not occur by chance? This is where tests of statistical significance come in handy. Statistical significance tells us the likelihood that the relationships we observe could be caused by something other than chance. While your statistics class will give you more specific details on tests of statistical significance and reading quantitative tables, the important thing to be aware of as a non-expert reader of tables is that some of the relationships presented will be statistically significant and others may not be. Tables should provide information about the statistical significance of the relationships presented. When reading a researcher’s conclusions, pay attention to which relationships are statistically significant and which are not.
In Table 3.2, you may have noticed that a p value is noted in the very last column of the table. A p value is a statistical measure of the probability that there is no relationship between the variables under study. Another way of putting this is that the p value provides guidance on whether or not we should reject the null hypothesis. The null hypothesis is simply the assumption that no relationship exists between the variables in question. In Table 3.2, we see that for the first behavior listed, the p value is 0.623. This means that there is a 62.3% chance that the null hypothesis is correct in this case. In other words, it seems likely that any relationship between observed gender and experiencing threats to safety at work in this sample is simply due to chance.
In the final row of the table, however, we see that the p value is 0.039. In other words, there is a 3.9% chance that the null hypothesis is correct. Thus, we can be somewhat more confident than in the preceding example that there may be some relationship between a person’s gender and their experiencing the behavior noted in this row. Statistical significance is reported in reference to a value, usually 0.05 in the social science. This means that the probability that the relationship between gender and experiencing staring or invasion of personal space at work is due to random chance is less than 5 in 100. Social science often uses 0.05, but other values are used. Studies using 0.1 are using a more forgiving standard of significance, and therefore, have a higher likelihood of error (10%). Studies using 0.01 are using a more stringent standard of significance, and therefore, have a lower likelihood of error (1%).
Notice that I’m hedging my bets here by using words like somewhat and may be. When testing hypotheses, social scientists generally phrase their findings in terms of rejecting the null hypothesis rather than making bold statements about the relationships observed in their tables. You can learn more about creating tables, reading tables, and tests of statistical significance in a class focused exclusively on statistical analysis. For now, I hope this brief introduction to reading tables will improve your confidence in reading and understanding the quantitative tables you encounter while reading reports of social science research.
A final caveat is worth noting here. The previous discussion of tables and reading the results section is applicable to quantitative articles. Quantitative articles will contain a lot of numbers and the results of statistical tests demonstrating association between those numbers. Qualitative articles, on the other hand, will consist mostly of quotations from participants. For most qualitative articles, the authors want to put their results in the words of their participants, as they are the experts. The results section may be organized by theme, with each paragraph or subsection illustrating through quotes how the authors interpret what people in their study said.
Key Takeaways
- Reading a research article requires reading beyond the abstract.
- In tables presenting causal relationships, the independent variable is typically presented in the table’s columns while the dependent variables are presented in the table’s rows.
- When reading a research report, there are several key questions you should ask yourself for each section of the report.
Glossary
Abstract- the short paragraph at the beginning of an article that summarizes its main point
Confidence interval- a range of values in which the true value is likely to be
Null hypothesis- the assumption that no relationship exists between the variables in question
p-value- a statistical measure of the probability that there is no relationship between the variables under study
Statistical significance- the likelihood that the relationships that are observed could be caused by something other than chance
Table- a quick, condensed summary of the report’s key findings
Image Attributions
CSAF releases 2009 reading list by Master Sgt. Steven Goetsch public domain
A research method that allows researchers to draw conclusions or infer about a population based on data from a sample.
An effect that is unlikely due to random chance and therefore likely represents a real effect in the population.
Research methods is my favorite course to teach. It is somewhat less popular with students, but I’m working on that issue. Part of the excitement of teaching this class comes from the uniquely open framework—students get to design a research study about a topic that interests them. By reading my students’ papers every semester, I learn about a wide range of topics relevant to social work that I otherwise would not have known about. But what topic should you choose?
Chapter outline
- 2.1 Getting started
- 2.2 Sources of information
- 2.3 Finding literature
Content advisory
This chapter discusses or mentions the following topics: racism and hate groups, police violence, substance abuse, and mental health.
