17.2 Types of Diversity

Everyone learns differently and has different personalities. The following are other various aspects of diversity. These are just some of the types of diversity you are likely to encounter on college campuses and in our society generally.
Diversity of race. Race refers to what we generally think of as biological differences and is often defined by what some think of as skin colour. Such perceptions are often at least as much social as they are biological.
Diversity of ethnicity. Ethnicity is a cultural distinction that is different from race. An ethnic group is a group of people who share a common identity and a perceived cultural heritage that often involves shared ways of speaking and behaving, religion, traditions, and other traits. Race and ethnicity are sometimes interrelated but not automatically so.
Diversity of cultural background. Culture, like ethnicity, refers to shared characteristics, language, beliefs, behaviours, and identity. We are all influenced by our culture to some extent.
Diversity of educational background. Colleges do not use a cookie-cutter approach to admit only students with identical academic skills. Diversity of educational background helps ensure a free flow of ideas and challenges those who might become set in their ways.

Diversity of geography. People from different places within Canada or the world often have a range of differences in ideas, attitudes, and behaviours.
Diversity of socioeconomic background. People’s identities are influenced by how they grow up, and part of that background often involves socioeconomic factors. Socioeconomic diversity can contribute a wide variety of ideas and attitudes.
Diversity of gender roles. Women have virtually all professional and social roles, including those once dominated by men, and men have taken on many roles, such as raising a child, that were formerly occupied mostly by women. These changing roles have brought diverse new ideas and attitudes to college campuses.
Diversity of age. While younger students attending college immediately after high school are generally within the same age range, older students returning to school bring a diversity of age. Because they often have broader life experiences, many older students bring different ideas and attitudes to the campus.
Diversity of sexual orientation. People who are lesbian, gay, bisexual, transgendered, transsexual, and two spirited make up a significant percentage of people in Canadian society and students on college campuses. Exposure to this diversity helps others overcome stereotypes and become more accepting of human differences.
Diversity of religion. For many people, religion is not just a weekly practice but a larger spiritual force that infuses their lives. Religion helps shape different ways of thinking and behaving, and thus diversity of religion brings a wider benefit of diversity to college.
Diversity of political views. A diversity of political views helps broaden the level of discourse on campuses concerning current events and the roles of government and leadership at all levels. College students are frequently concerned about issues such as environmentalism and civil rights and can help bring about change.

Diversity of physical ability. Some students have athletic talents. Some students have physical disabilities. Physical differences among students brings yet another kind of diversity to colleges, a diversity that both widens opportunities for a college education and also helps all students better understand how people relate to the world in physical as well as intellectual ways.
Diversity of extracurricular abilities. Students participate in a wide variety of activities outside of class: clubs, activities, abilities in music and the arts, and so on. A student body with diverse interests and skills benefits all students by helping make the college experience full and enriching at all levels.
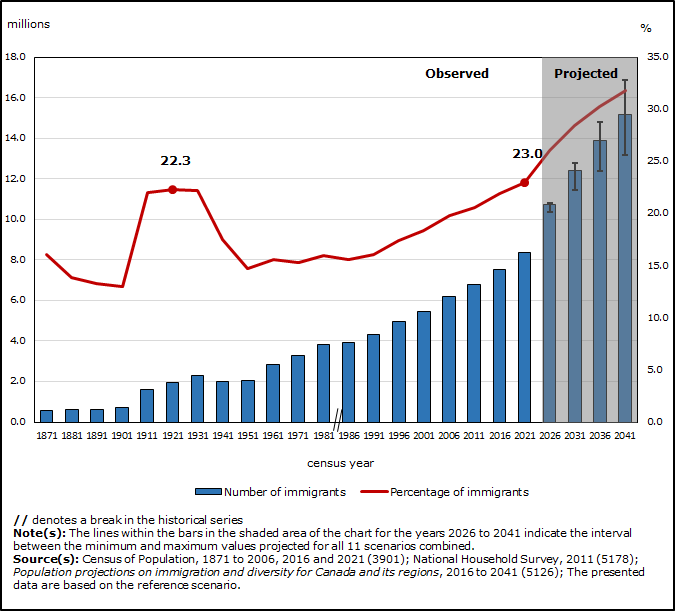
Nearly one in four people in Canada are immigrants, the highest proportion of the population in more than 150 years

Image Long Description
This is a combination bar and line chart showing the overall counts and proportion of the population of Canada who are immigrants, for each census since 1871. The left vertical axis shows the count of immigrants per period, in millions, from 0.0 million to 18.0 million, by increments of 2.0 million. The right vertical axis shows the proportion of the population of Canada that immigrants represent, in percent, from 0.0% to 35.0%, by increments of 5.
The horizontal axis shows the following census years: 1871, 1881, 1891, 1901, 1911, 1921, 1931, 1941, 1951, 1961, 1971, 1981, 1986, 1991, 1996, 2001, 2006, 2011, 2016, 2021, 2026, 2031, 2036, and 2041.
Each bar represents the count of immigrants on that census, with 594,207 in 1871; 602,984 in 1881; 643,871 in 1891; 699,500 in 1901; 1,586,961 in 1911; 1,955,736 in 1921; 2,307,525 in 1931; 2,018,847 in 1941; 2,059,911 in 1951; 2,844,263 in 1961; 3,295,530 in 1971; 3,843,335 in 1981; 3,908,150 in 1986; 4,342,890 in 1991; 4,971,070 in 1996; 5,448,480 in 2001; 6,186,950 in 2006; 6,775,770 in 2011; 7,540,830 in 2016; 8,361,505 in 2021; 10,712,000 in 2026; 12,408,000 in 2031; 13,891,000 in 2036; and 15,155,000 in 2041.
There is a shaded area within the chart representing the years when the proportion of the population that are immigrants is based on projected data (2026 to 2041).
The chart includes a horizontal line that shows the proportion of the population of Canada that immigrants represent, with 16.1% in 1871; 13.9% in 1881; 13.3% in 1891; 13.0% in 1901; 22.0% in 1911; 22.3% in 1921; 22.2% in 1931; 17.5% in 1941; 14.7% in 1951; 15.6% in 1961; 15.3% in 1971; 16.0% in 1981; 15.6% in 1986; 16.1% in 1991; 17.4% in 1996; 18.4% in 2001; 19.8% in 2006; 20.6% in 2011; 21.9% in 2016; 23.0% in 2021; 26.0% in 2026; 28.4% in 2031; 30.3% in 2036; and 31.8% in 2041.
“5.3 Types of Diversity” from Fanshawe SOAR by Kristen Cavanagh is licensed under a Creative Commons Attribution-NonCommercial-ShareAlike 4.0 International License, except where otherwise noted.

