Li(p,n)
Procedure
4.1 Detector Setup
- You will set up the detector alongside the technician. Note that the very last step is turning on the high voltage to the detector.
- The detector is placed in-line with the neutron beam but behind as much shielding as possible remember that we need to detect moderated (i.e. slow) neutrons.
- With the detector set up, run the USB cable to the counting area, start the MCA software, turn on the high voltage to 1450V, and begin collecting a spectrum that should consist of electrical background noise.
4.2 Proton Beam Alignment
- Once the instruments are ready and the area is clear, the nuclear technician will turn on the proton beam and magnetically/electrostatically steer the beam to the lithium target.
- Once the beam is on-target, the student can request which proton energy to operate at.
4.3 Data Collection
- Once the beam is on-target, the student can request which proton energy to operate at. Once the operator signals that the beam is ready, begin collecting data with the MCA software. It’s a good idea to start at about 2.3 MeV since that’s where the maximum neutron flux should be happening. Take note of the deadtime. It should be less than 50%. If higher, request to lower the proton beam current, move the detector, or change the amplifier gain settings. Within about 30 seconds of taking data, you should be able to see peaks in the energy spectrum due to neutrons being absorbed in the detector.
- As you collect data, have someone in your group trying to plot some of the spectra as you go. If there is a serious problem in collecting data, best to find out before you leave the accelerator facility and can no longer collect data.
4.4 Data Analysis Techniques
- Your spectrum will likely have much more structure than you would like. There is likely an X-ray peak in your spectrum alongside the low-energy neutron peak, as well as background gammas/X-rays and a near-constant electrical noise, as in Figure 4.
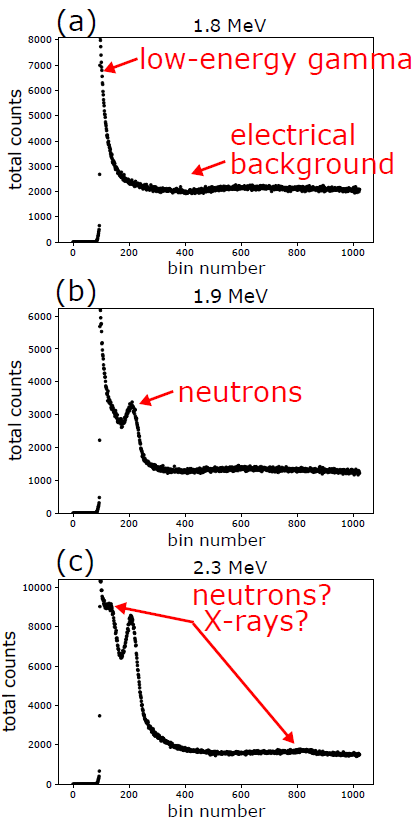
Figure 4: Example data. (a) was taken below the threshold energy to produce neutrons, showing the low-energy gamma/X-ray peak and background due to electrical noise. (b) was taken above threshold and has a new peak due to neutron production. (c) was taken at the peak of the 2nd resonance (2.3 MeV) and has several peaks that are probably due to neutrons. - Use the data just before the X-ray/neutron peaks and the data just after those peaks to fit an exponential decay. You’re basically fitting the low-energy gamma curve in order to subtract it. Note that exponential decay is probably not the correct function to use, but it’s close and easy enough to do in Python.
- The low-energy gamma/electrical noise needs to be removed from EACH spectrum you collect. See Figure 5 for an example of the fit. Hopefully you can see how the fit can be subtracted from the data to be left with the signal due to neutrons (or X-rays?)

Figure 5: Example data showing the fit function for the low-gamma/electrical noise background. Subtracting the fit from the data will leave the signal due only to neutrons. - Then there are at least two choice for this analysis: 1 – Sum the background-subtracted counts. This technique is easy but less precise, especially if your background fit isn’t great. 2 – Fit the background subtracted data with the typical Briet-Wigner function (Equation (2)), then take the amplitude or integral of the curve as a measure of the counts. Please talk with your lab instructor if you aren’t sure how to analyze your data.