High-Performance Computing for Large-Scale Digital Humanities Projects
Very large digital humanities projects using “Big Data” can potentially benefit from high-performance computing resources. In this case, “high-performance” indicates the use of multiple processors, known as parallel processing, to simultaneously process large amounts of data. It also indicates large computational tasks being executed, which is known as parallel computing. Although the uptake of utilization of high-performance computational facilities has been substantial in digital cultural heritage, there have been different challenges of re-purposing these resources for textual analysis in the humanities.
Historians have used these resources for analyzing census information, specifically for cleaning and managing the data, and for matching census records (Terras, 2009). There are many other potential applications of high-performance computing technology in history. For instance, there is a need for creating a longitudinal database, consisting of census records matched temporally. Such a database would enable tracking individuals, groups, and population changes over time. Another potential application is the creation of variant lists that would address variants and errors in data, which are mostly consequences of the data collection process. Such variant lists would allow normalizing the search process and provide probabilistic and statistical information for further analysis. High-performance computing can also be used to verify census records, which are often missing information. The development of OCR methods for copperplate script (a type of English calligraphic handwriting used in census data), and digitizing missing fields in these records, were needed (Terras, 2009).
In other examples of high-performance computing applications to historical scholarship, two projects at University College London in collaboration with the British Library were undertaken to analyze 60,000 digitized fiction and non-fiction books from the 17th through 19th centuries. The data were encoded in compressed ALTO XML code, which describing OCR text and the layout of digitized material. The size of the dataset was approximately 224 GB. The high-performance systems were used for computational queries that could not be performed through standard search interfaces. Results returned from these queries obtained from high-performance computational methods were then provided to scholars for subsequent close reading, visualization, and analysis on local computing resources (Terras et al., 2018).
History of Medicine
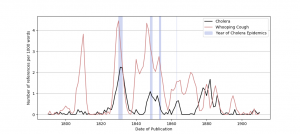
One project involved geospatial and demographic analysis to study how the occurrence of diseases described in the published literature compare to known epidemics in the 19th century, or whether there are correlations between infectious disease outbreaks and mentions of these diseases in fiction and non-fiction literature. The goal was to better understand the cultural response to diseases by examining the source of the texts that refer to these outbreaks, thereby illuminating the relationships between epidemiology, public health, and the published historical record (Terras et al., 2018). Through time series visualizations of the number of references per 1000 words (y-axis) against the date of publication (x-axis or time axis) for various diseases (whooping cough, cholera, tuberculosis, and measles) and highlighting the dates of actual epidemics on the graph, it was found that there was a steep increase in the mention of cholera in the literature that coincided with the 1831-32 outbreak in the U.K., and a smaller increase in mentions during the 1848-1849 epidemic. A simulated representation of this time series plot (using synthetic data but modeled on the original graph in Figure 1 in (Terras et al., 2018)) is shown below. Details on the generation of this plot are described in a subsequent course in this series. The reader is referred to (Terras et al., 2018) for the graphical representation of the data used in the study.
The data used in this study could be linked to digitized historical newspapers and other data sources to further clarify cultural issues related to epidemics. For the current study, time-series visualizations based on the corpus of literature provided researchers with useful overviews that can also be potentially valuable to historians, epidemiologists, and historians of science, whose opportunities to analyze these open-source datasets are more limited (Terras et al., 2018).
Historical Analysis of Images in Printed Books (1750 – 1850)
In another study enabled by high-performance computing resources, changes in imaging techniques and image sizes over different genres could be studied. The research specifically focused on the 100 years between 1750 and 1850, when improvements in printing technologies facilitated combining text and imagery. The broader question is how techniques from the digital humanities compare with traditional methods. Again, the 60,000-book data were used.
The XML from the books were queried using computation techniques to determine the coordinates of boundary boxes around image, as identified from OCR. The data returned from this process includes the title, author, place of publication, and reference number for each book. For each of the approximately 1 million images in the corpus of books, the page number on which the image appeared, the (x, y) coordinates of the top-left corner, the width, height, and percentage of space taken up on the page were also recorded. Two types of analysis were then performed.
The data that were derived from the processing on the high-performance computing system were used to generate a heatmap, or matrix visualization, of the size of the figures (as percentage of the page) on the y-axis vs. time on the x-axis (or time axis). Each point was coloured according to the number of instances the size-year combination was found. This type of visualization can potentially yield interesting insights. For instance, full-page and very small images (less than 15% of the page) were predominant between the 1750s and 1810s. After this time, changes in lithography technology enabled a diversification in the size of the pages. This study therefore provided insights into to patterns of book illustrations during a period of change in printing technology. A simulated representation of this heatmap (using synthetic data but modeled on the original graph in Figure 2 in (Terras et al., 2018)) is shown below. Details on the generation of this plot are described in a subsequent course in this series. The reader is referred to (Terras et al., 2018) for the graphical representation of the data used in the study.
![This figure displays a heatmap indicating the number of publications that have a specific size of figures as percentages of a page and the year. The x-axis is labeled “Year”, ranging from 1750 to 1850, and the y-axis is labeled “Size of Figures [% of Page]”, ranging from 0 to 100. The heat map colours represent the normalized number of publications, ranging from 0 in blue, passing through green, to 1 in yellow, and is represented by a colour bar to the right of the figure, labeled “Normalized Number of Publications”. The density of green to yellow cells in the heat map indicate higher numbers of publications for all size of figure percentages increases from 1750 to 1850.](https://ecampusontario.pressbooks.pub/app/uploads/sites/2182/2022/02/DIGI2xxx_15_p18_1-300x225.png)
In a further analysis step executed on local (non-HPC) resources, a script was written in the R language to generate graphs based on image data for individual books. Books on history, geology, and topography were selected for this analysis. The page number was plotted on the x-axis. The size of the figures, as a percentage of the page, was plotted on the y-axis. The visualizations represent the size of illustrations in a specific book. This analysis can be used to assess how the placement of the images, as well as their sizes, affected the reading experience between books in multi-volume works.
In addition to the specific research questions addressed by these investigations, several issues were identified related to deploying HPC resources – originally intended for scientific and engineering applications – for digital humanities scholarship. Scientific data is generally much larger than humanities data, but more structured. It consists mostly of numeric data, and is generally homogeneous (i.e., there is a large amount of data that have the same structure, such as floating-point numbers in tables). The data are also typically acquired from sensors (such as temperature or precipitation sensors), from experiments, from measurements and observations, or from simulations. The converse is true with humanities data, which generally exhibits much less structure. Humanities data exhibits more uncertainty and heterogeneity, and may be of low quality. It is generally smaller than scientific data. Whereas scientific data are collected, a substantial amount of humanities data is transcribed by humans. Different resources are needed in humanities research, such as XML processing libraries. Data also required transformation into a small number of larger files so that it could be processed in parallel on multiple processors.
Although HPC resources can open new research directions, and in some cases are necessary for “Big Data” processing of large-scale humanities data, the technical challenges of using these resources or developing and deploying tools for them are substantial. A standard set of queries on large-scale textual data can be used to address many research problems in the humanities, and therefore, these results can be provided to researchers through research support services. This is another area in which librarians can enable and facilitate humanities research on large-scale architectures, by employing adjustable procedures for defined computational queries. Computational specialists, such as research software engineers, can develop more complex queries beyond what is provided by these recipes.
